
jewelie
Rank 4
Rank 4
March 18, 2020
Solved

Is my In Home Display (IHD) displaying the wrong time?

  • March 18, 2020
  • 58 replies
  • 8570 views

Hi

We had our SMETS2.0 smart meter and IHD last year.

Looks like there's still bugs.  😉

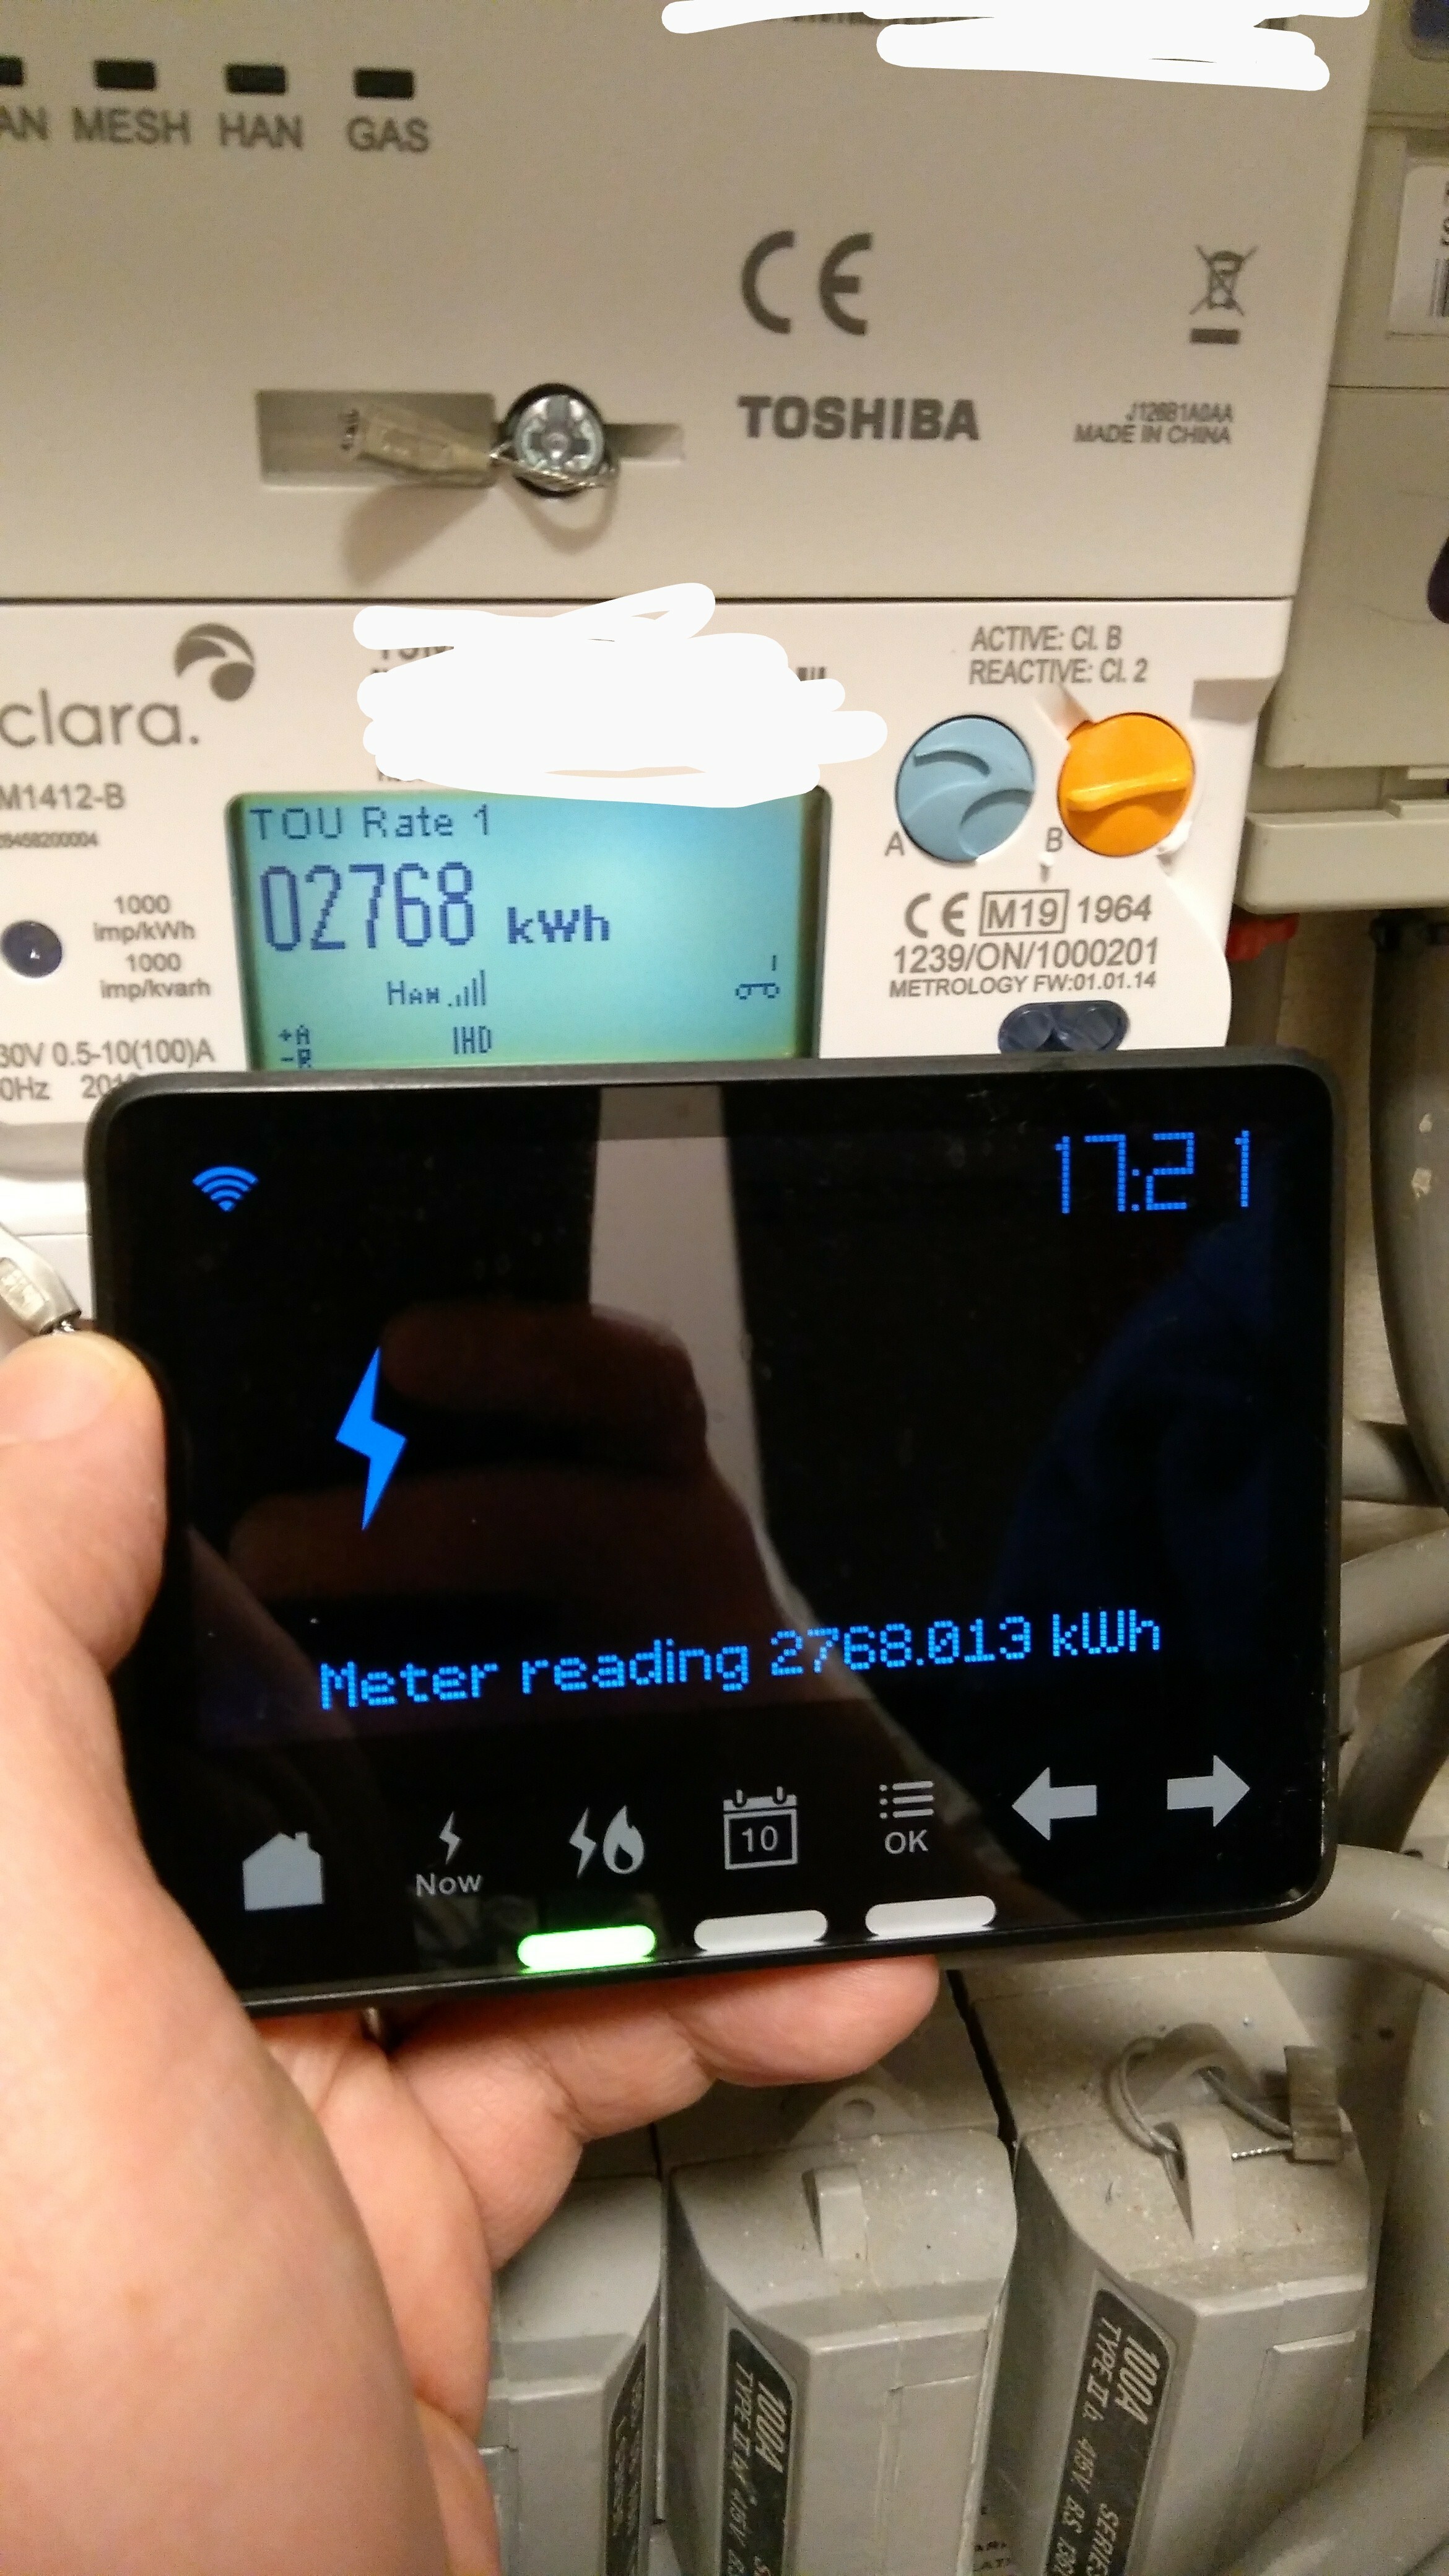
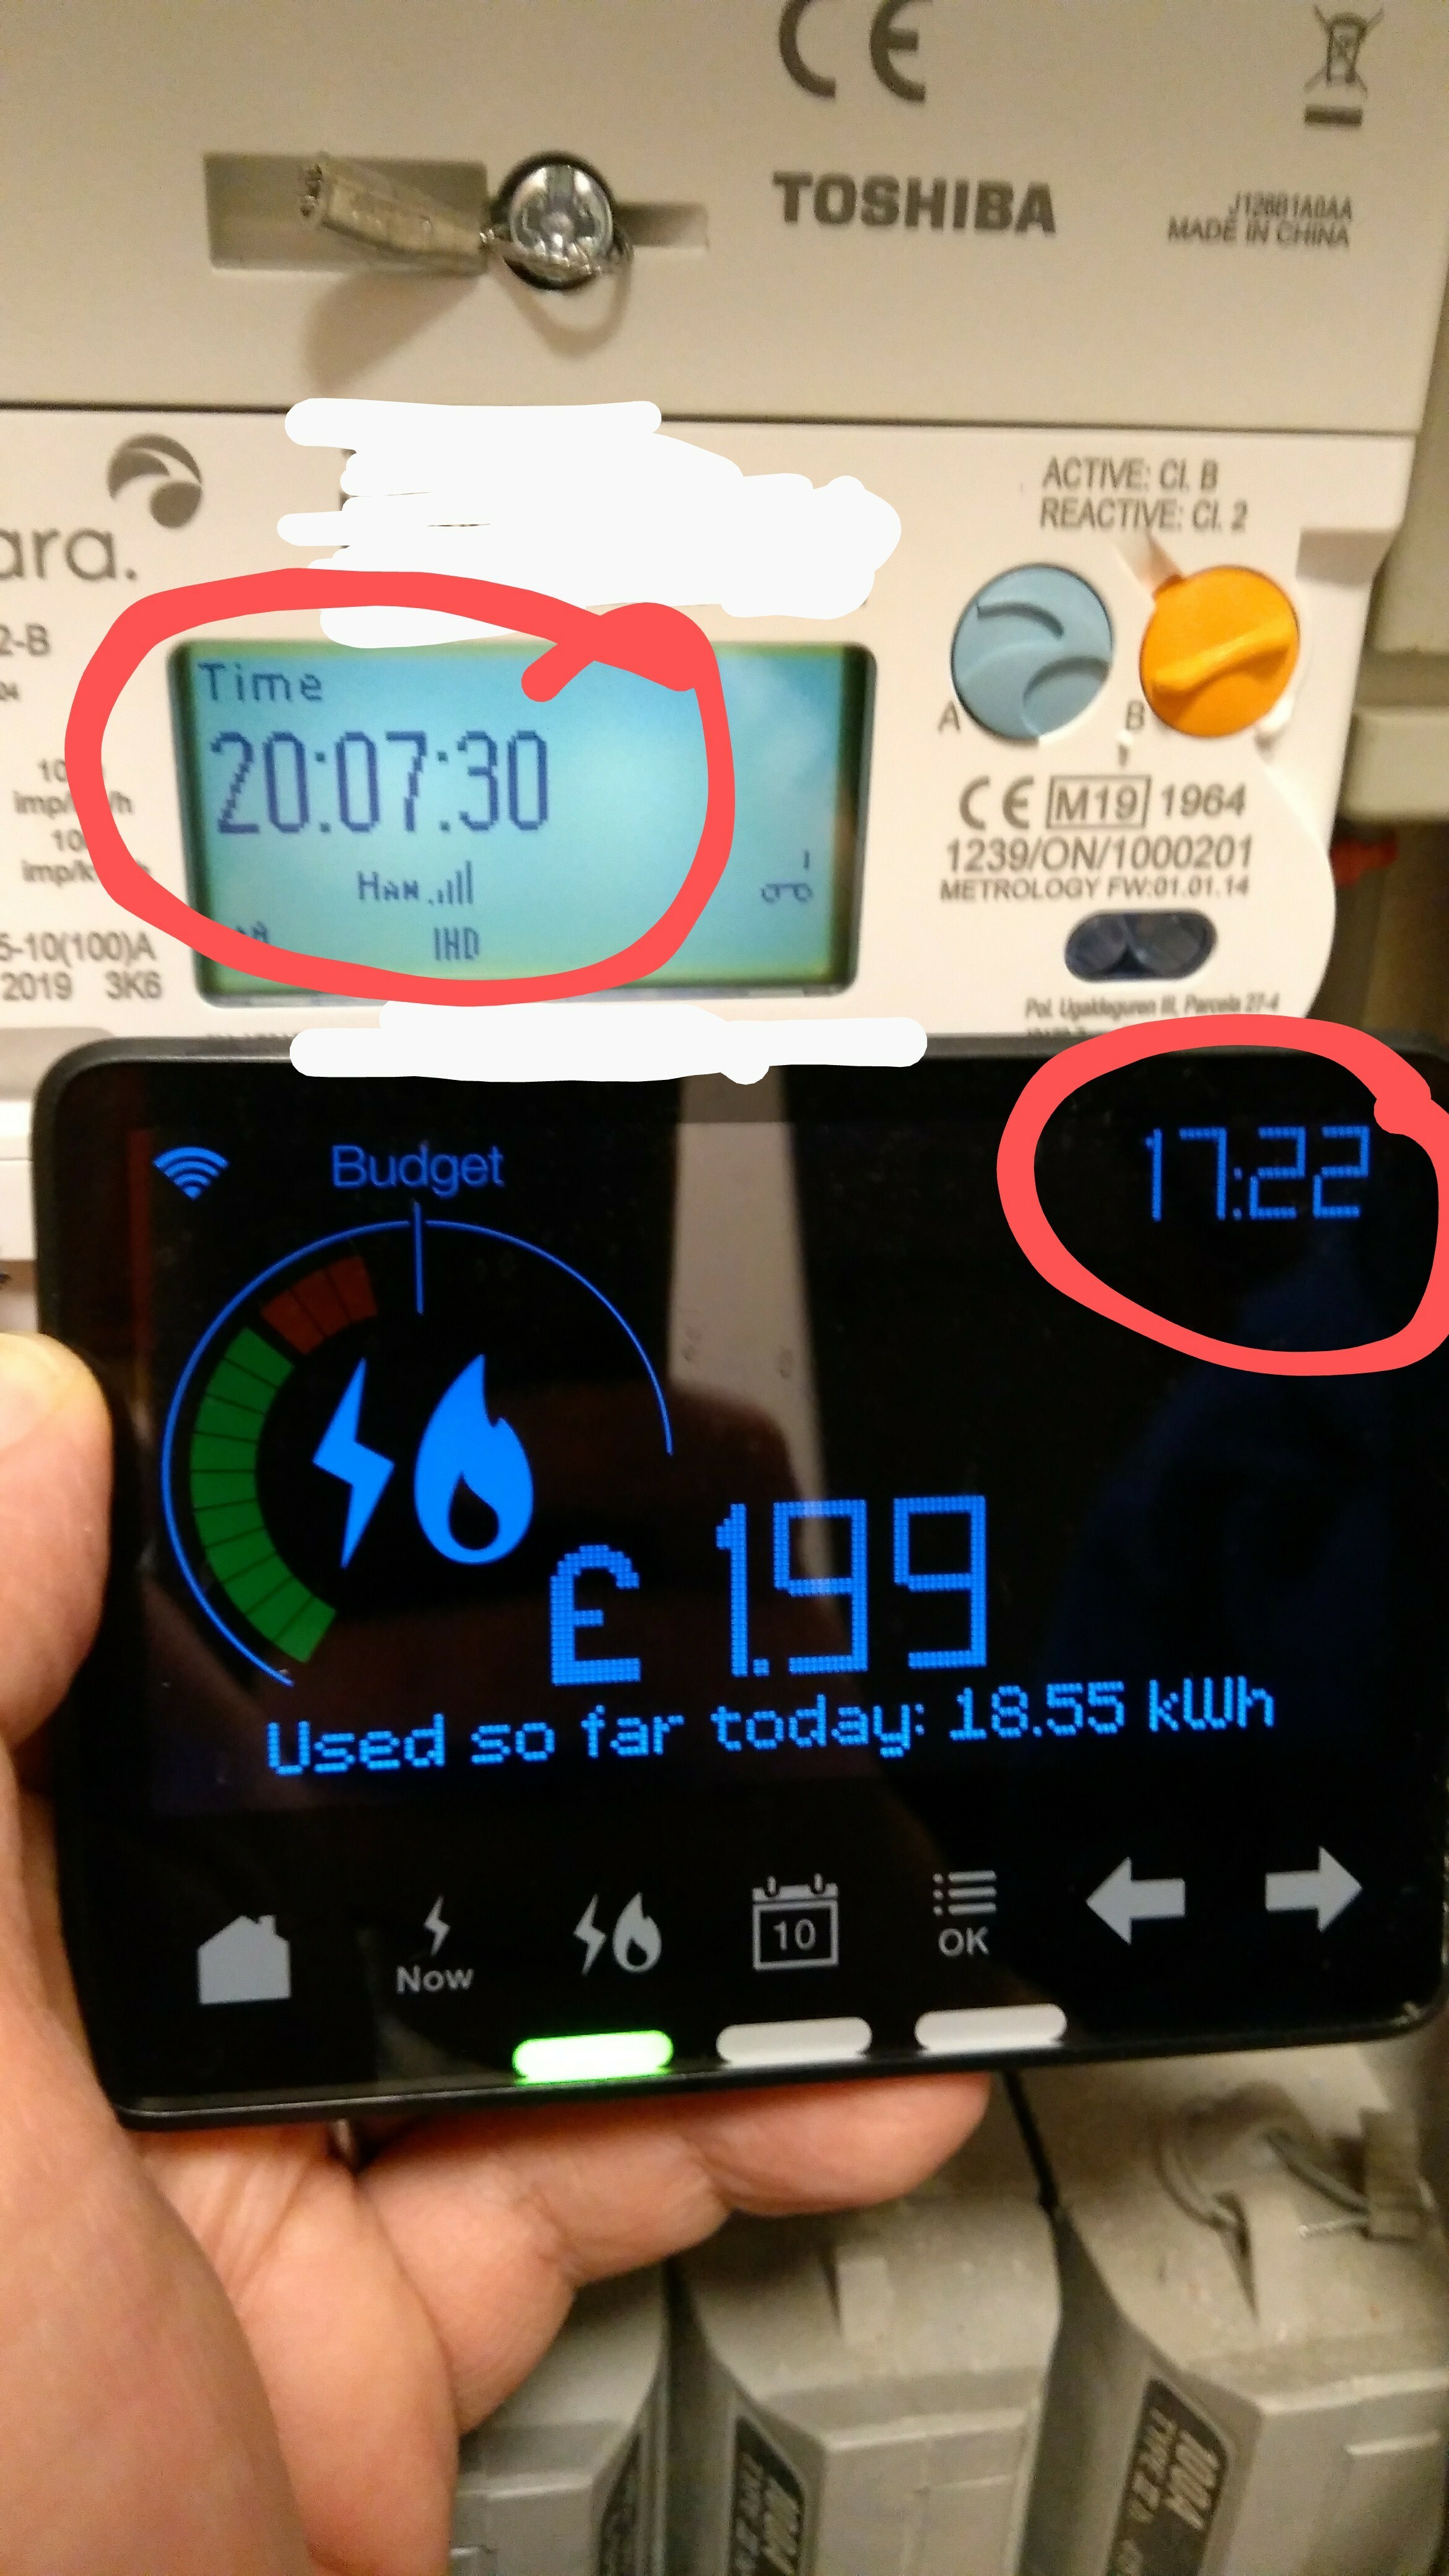
As you can see from the attached photos, the IHD is properly synchronised and paired with the meter, the right meter, and it gets the meter readings, and the meter has the right time on it; however, the IHD doesn't have the right time.  No amount of resetting the IHD seems to cure this.  This means it messes up the night mode timings (and also confuses me, I keep thinking it's earlier than it is, lol!)

The IHD model is Chameleon IHD3-PPMID / CA30111.

The meter is an Aclara SGM1413-B.

The communications hub is a Toshiba SKU-1 Cellular.

(I have another photo I've not posted demonstrating that the MPANs match on both meter and IHD too.)

I know it's not a high priority issue but I thought I'd best feed it back to you.


Julie

x
 

Best answer by BenS_OVO

Updated on 30/10/25 by Ben_OVO


Sorry to hear your smart meter In-Home Display (IHD) isn’t showing you the correct time. This normally indicates that the IHD isn’t paired properly to the smart meter.


In order to get this sorted it’s worth contacting our Support Team, who should be able to send a remote message to your meter and IHD to get them re-paired. 


There’s more info in getting the best out of your IHD on our device guides below - 


SMETS1 Pipit In Home Display (IHD) guide

SMETS1 Chameleon In Home Display (IHD) guide

SMETS2 In Home Display (IHD) guide


Don’t forget you can also check out your smart meter usage data on your online account or OVO app (download for Android or iOS).


OVO member but not got a smart meter yet? - Book today!

Interested but not yet an OVO member? - Check out our plans!

58 replies

Newcomer
March 28, 2020

@BenS_OVO I have some fairly unbelievable readings too. My usage remains constant but on two days I seem to have used twice a much electricity as normal.

Jon
Transparent
Rank 20
Rank 20
March 28, 2020

Thanks @Jon Langford 

And do your Usage graphs and data format look to be a similar  to mine?

Or are you on the earlier User Interface?

Save energy... recycle electrons!
jewelie
Rank 4
jewelieAuthor
Rank 4
March 28, 2020


@jewelieand @Jon Langford do you have the same version of the Usage graphs as I’m seeing online? Or are you both on the earlier software?


I’ve replied, with screenshots of graphs, but it’s awaiting moderation for some reason (too many pictures?)  Julie x

Transparent
Rank 20
Rank 20
March 28, 2020

Thanks @jewelie - so let’s tag @Tim_OVO in the hope that he can retrieve your message from the anti-Spam bin asap.

I know the bug you’re referring to in the Forum software (Insided). I used to get messages rejected almost daily. Darran and I spent months trying to isolate what was the likely cause, but failed to do so.

I don’t think it’s related to the number or size of screenshots, but in the process of investigation I decided that I would try to make my graphics as friendly as possible to the software. Thus I edit them in advance to be no more than 800pixels wide, and preferably below 630 (which is currently the default for graphics display).

As I use so many advanced features in my Forum responses (colors, graphics, internal links and external URLs) I’m currently using a different permissions to others. But that’s not a long-term solution. The bug needs to be isolated and fixed by Insided’s staff.

Try editing your graphics as I’ve suggested and then re-post. If you succeed, then send a PM to Tim asking him to delete the earlier copy in the Spam-bin.

Save energy... recycle electrons!
Newcomer
March 28, 2020

@Tim_OVO @BenS_OVO @jewelie @Transparent 

When I add my daily electricity readings up manually for March 20th  I get a different total??? 

manual total 33.62 kWh
ovo total 32.72 kWh
difference 0.90 kWh
% difference 2.67  

Also having trouble believing this dip at 12:00 midday

Jon
Transparent
Rank 20
Rank 20
March 28, 2020

Hi @Jon Langford - That, to me, looks like a different/earlier User Interface to what I have.

You’re also showing electricity readings on that graph, aren’t you?

I’m looking at gas because I was noticing electricity readings being picked up by OVO overnight, whilst the gas wasn’t. That would indicate a break in data transfer between the actual gas meter and the “gas proxy”, which is within the Comms Hub. But such a ZigBee communication failure wasn’t indicated in the places I would expect to find it.

There’s no such issue with a SMETS2 electricity meter because it directly transfers data to/fro the Comms Hub via the Intimate Connector.

I think we’d need to know a great deal more about your electricity usage before we could draw any conclusions about the graph you’ve posted above. I can think of a number of reasons why a sudden drop at Noon would be valid.

Could you start by:

a: completing your Forum Profile so that us fellow customers can at least see the basic information about you and your usage :slight_smile:

b: giving us an idea of what technical background/interest you have?

As you will have noticed, @BenS_OVO isn’t afraid of throwing technical terms in our direction; and last week @jewelie posted here:

  Monkeying about with tech is my idea of relaxation and fun, so absolutely yes!  :)

  (tbh It’s the main reason we got a smart meter…  gadget-lust!)

So our “techie” background enables us to quickly evaluate whether the data we’re seeing is derived from a “fair test” or not!

Moreover, we aren’t going to be too worried if Ben throws new software into our Comms Hubs which totally messes things up, because we’d still be able to work out if our Billing was correct or not. (And yes, Ben has crashed my Comms Hub before!). Being a test-site comes with attached risks.

Save energy... recycle electrons!
Newcomer
March 28, 2020

Yes Electricity readings. KWh

Later interface, graph I posted is from the excel sheet I used to check the total KWh for the day.

There was no reason for the graph to dip at 12:00, no solar panels or heating turning off, nothing different from previous days.

I am still concerned about the mismatch between the manually summed daily total and the total reported the smart meter.

Have completed profile data, I am a retired medical research scientist.


Jon
Transparent
Rank 20
Rank 20
March 29, 2020

Thanks @Jon Langford - and you live in a beautiful area of the country! :slight_smile:

And with your professional background you will have the level of technical knowledge to keep up with @BenS_OVO ‘s techie-shorthand. And, unlike the majority of the UK population, you will at least know the difference between a kW and a kWh. :face_palm_tone2:

So as it was from Excel, I’m unsurprised I didn’t recognise the style of graph.

Can you grab a screenshot of the Usage Graph from your MyOVO page from a day either side of the above? That will enable us to compare against another typical day under similar weather conditions.

How long have you had SMETS2 meters?

When you look at the gas usage, are you seeing any half-hour (HH) data missing from the table?

What about consecutive HH slots with identical readings, such as I’m seeing?

Save energy... recycle electrons!
jewelie
Rank 4
jewelieAuthor
Rank 4
April 4, 2020

Thanks @jewelie - so let’s tag @Tim_OVO in the hope that he can retrieve your message from the anti-Spam bin asap.


No worries, I’ll do it again now I’ve got some time on my hands!


Note these are graphs from the gas, as that’s the only one with any clear, timed usage patterns (gas hot water cylinder heating.)  But it still looks there’s odd things happening on the gas readings.


Here’s a fairly typical normal gas usage graph; note the 6am-8am and 8:30pm-10:30pm peaks for heating the hot water cylinder (which also gets enough use during the night, because Crohns disease, that there should always be more work heating the water again in the mornings.)  Any other usage, from heating and cooking, are much less consistent or helpful.  

Typical Gas Usage Pattern (note timed morning and evening water heating peaks)


Now we have some odd looking examples.  Note the odd “delayed” morning peaks, and in some cases completely missing peaks.  I have on occasionally wondered why my IHD wasn’t reflecting that there had been gas usage some mornings even when I knew that some had been used but had put this down to IHD oddities. 


Then we have some fairly broken examples.  Delayed or missing peaks and periods of entirely missing readings.  (Nobody else nearby with smart meters, gas meter within about 6m of the electric meter, gas meter still registering huge battery life.)  Electricity readings recorded on the usage graphs on these days continued in full like other days.


And finally, the entertainingly crackers ones.


I’m pretty sure that if I had a device that ran at >=377MW I would know about it, as would probably the UN and many foreign intelligence agencies. :rofl: These two examples are suggestive of bugs 


Now, the total usage pattern of the gas and electricity over the year is, if I recall correctly, adding up to be about typical for us compared to before we moved to smart meters, so I strongly suspect at least some of the issues I’m seeing are just to do with the how these hourly usage patterns are being recorded and/or displayed. 


I’m not sure this helps, and might not be the same as what others are seeing, but it’s more information suggestive of more issues.  Certainly doesn’t instill much confidence in the graphs at first glance though.


Julie
x


Transparent
Rank 20
Rank 20
April 7, 2020

Are you still reading this Topic @BenS_OVO ?

I’m eager to get these readings sorted because it’s impossible for OVO to make progress towards any Time Of Use tariff unless you can rely on the half-hourly usage being reported correctly.

Save energy... recycle electrons!