


Updated on 17/06/26 by Ben_OVO
Recently had a smart meter installed and want to see how much energy you’ve been using? Your In-Home Display will give you an idea of your live usage, but the online account and OVO app (download for Android or iOS) give a more detailed view of previous usage.
Here’s a guide to getting the most out of your smart meter usage information:
From the app home screen, select the ‘Usage’ section at the bottom of the page
You should see tabs at the top of the usage page, where you can choose to view usage graphs in Year, Month, Week or Day view.
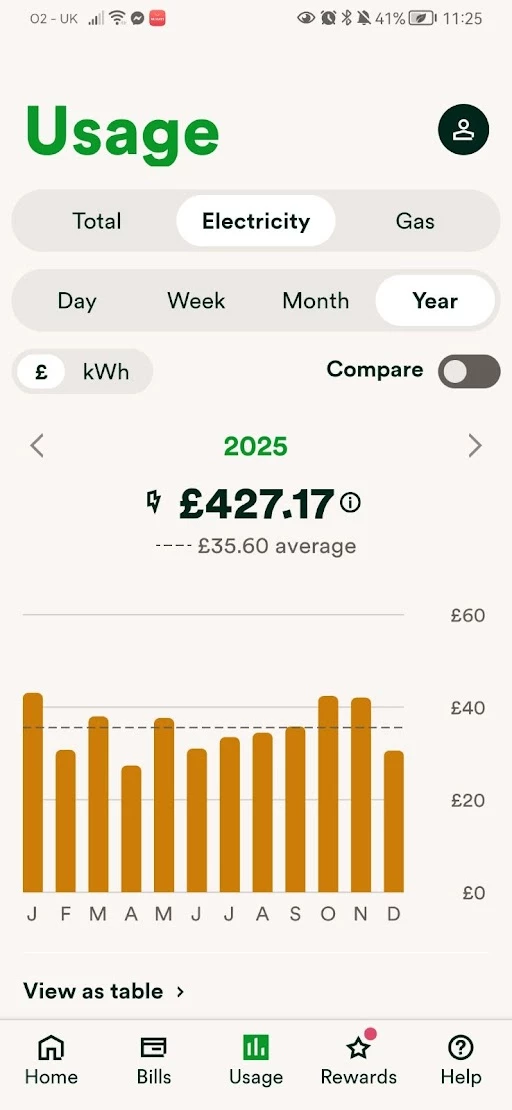
Year view
Here you’ll be greeted with a graph displaying how much has been used this year, separated in to months,
Month view
Similar to the yearly usage, this option shows you a graph with every day of the month, and how much you’ve used on each. Your smart meter must be set to provide half-hourly readings for this to be available.
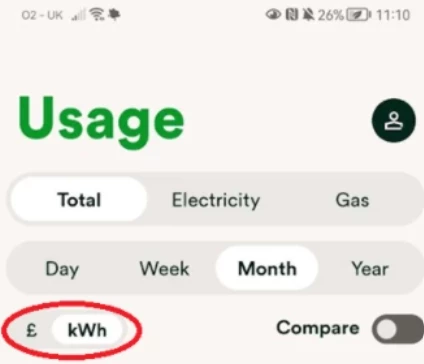
You can also choose to view your usage as either kWh or £s by using the slider as highlighted in the below picture. £ usage is not available in the ‘Day’ usage view.
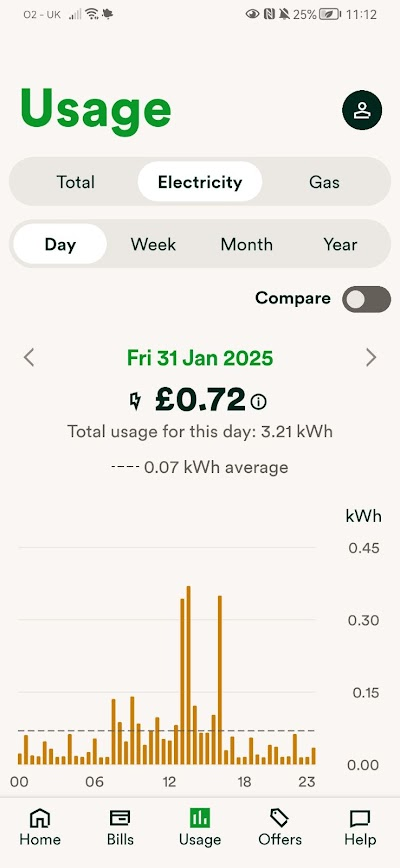
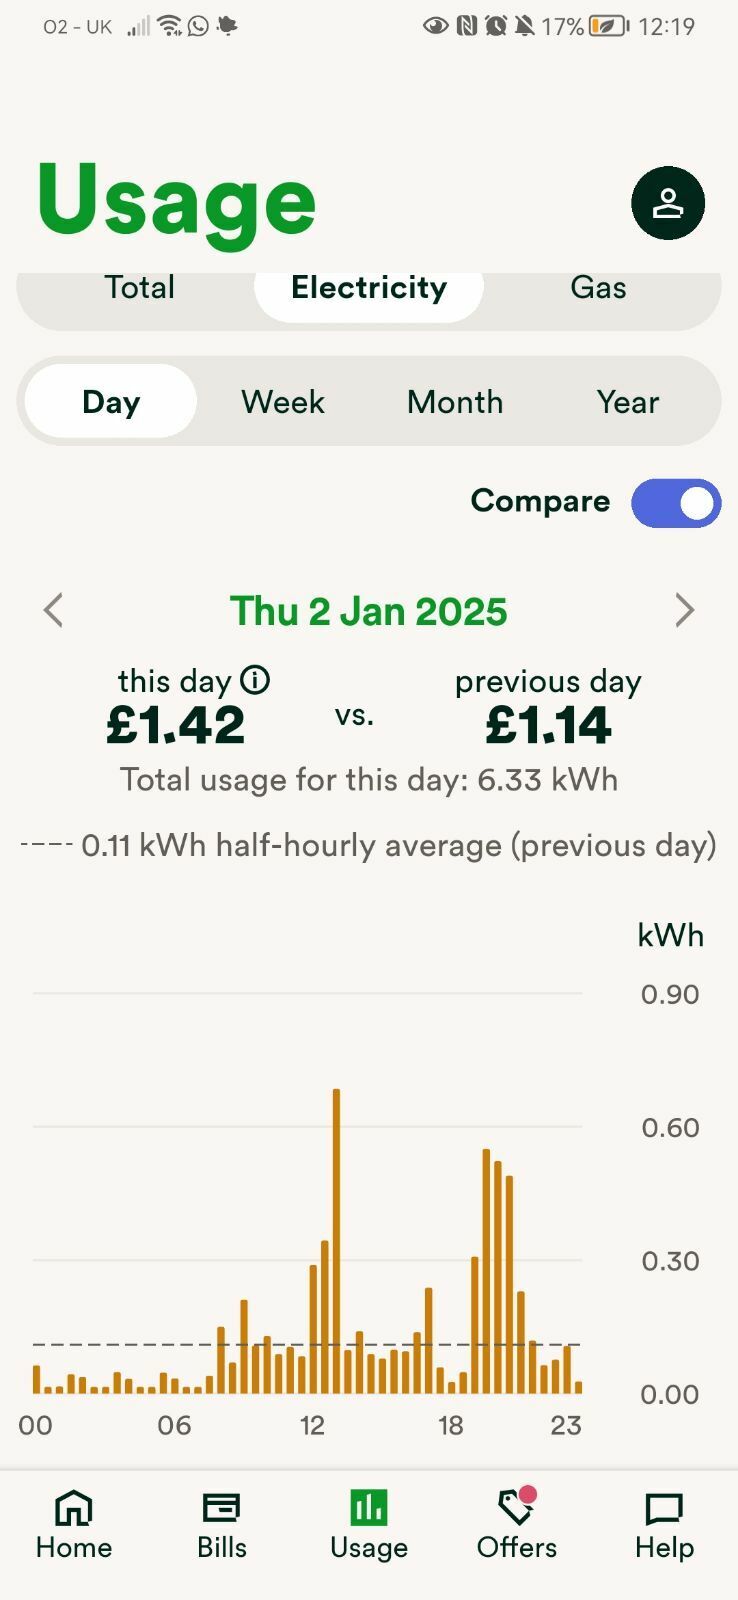
Day view
You can also view daily usage, which will show how much you’ve used each half-hour if you’ve got half-hourly meter readings scheduled.
You also have the option to use the ‘Compare’ function on the right of the screen to compare usage to previous days, weeks and months etc (please note, if you’re an OVO Beyond customer the ‘Compare’ function will appear as a drop-down):
For the purposes of this tutorial, I’ve only shown the totals for electricity. It all functions exactly the same, so if you want to view the breakdown per fuel, just select from the top which one you’d like to access.
Need more help?
This topic is now closed, so you won’t be able to reply here. If your question hasn’t been answered or you need more advice, feel free to ask the community — we’re here to help!
Give us your feedback!
Was this article helpful? Is our Library missing content? Share your anonymous feedback here and help us improve!

