Rank 1
April 25, 2023
Solved

Spike in energy usage during vacation

  • April 25, 2023
  • 21 replies
  • 1869 views

Hi Forum,

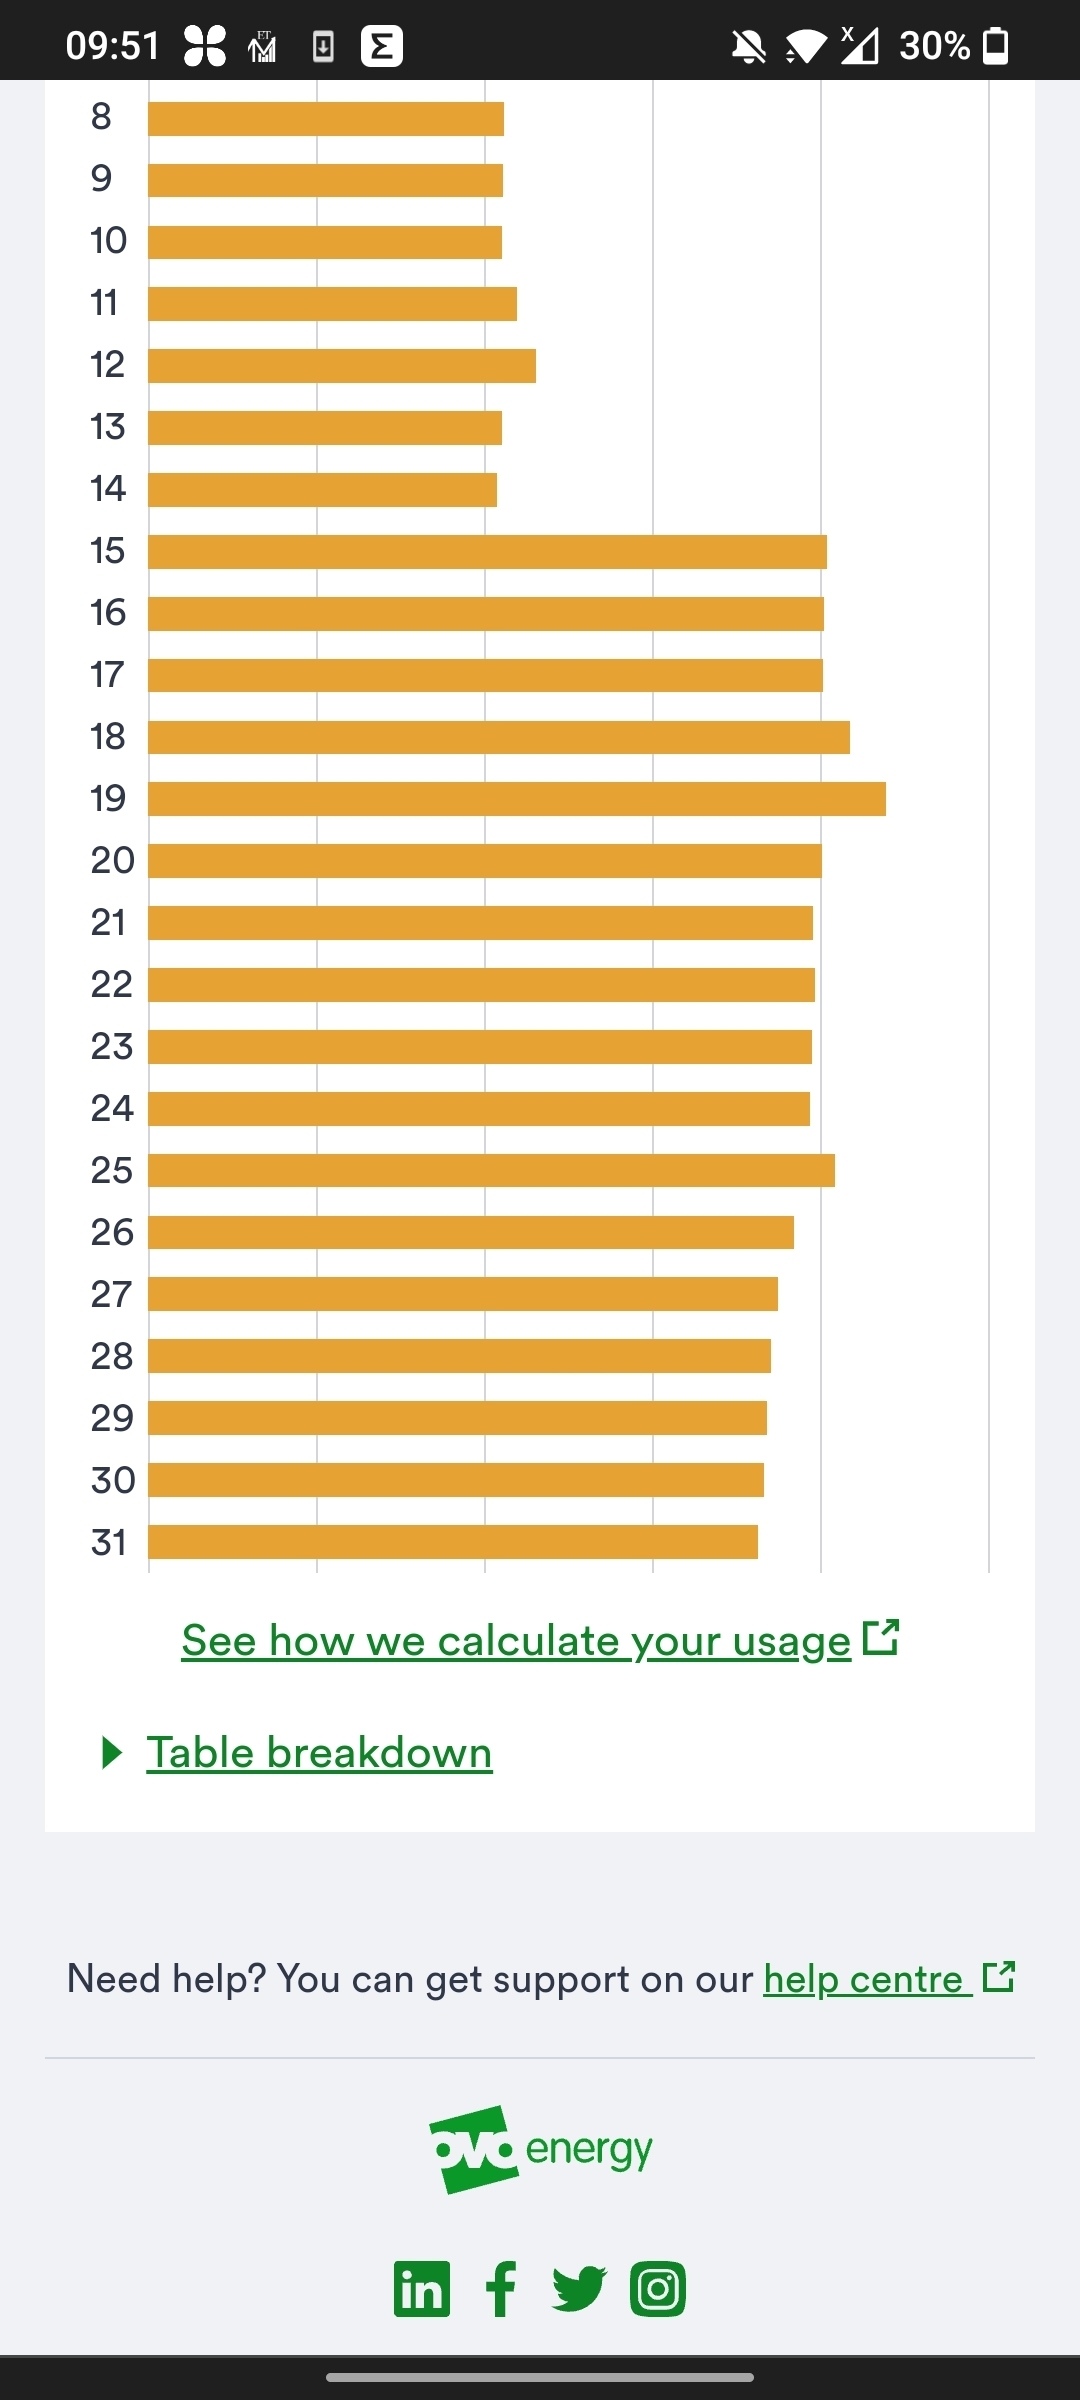
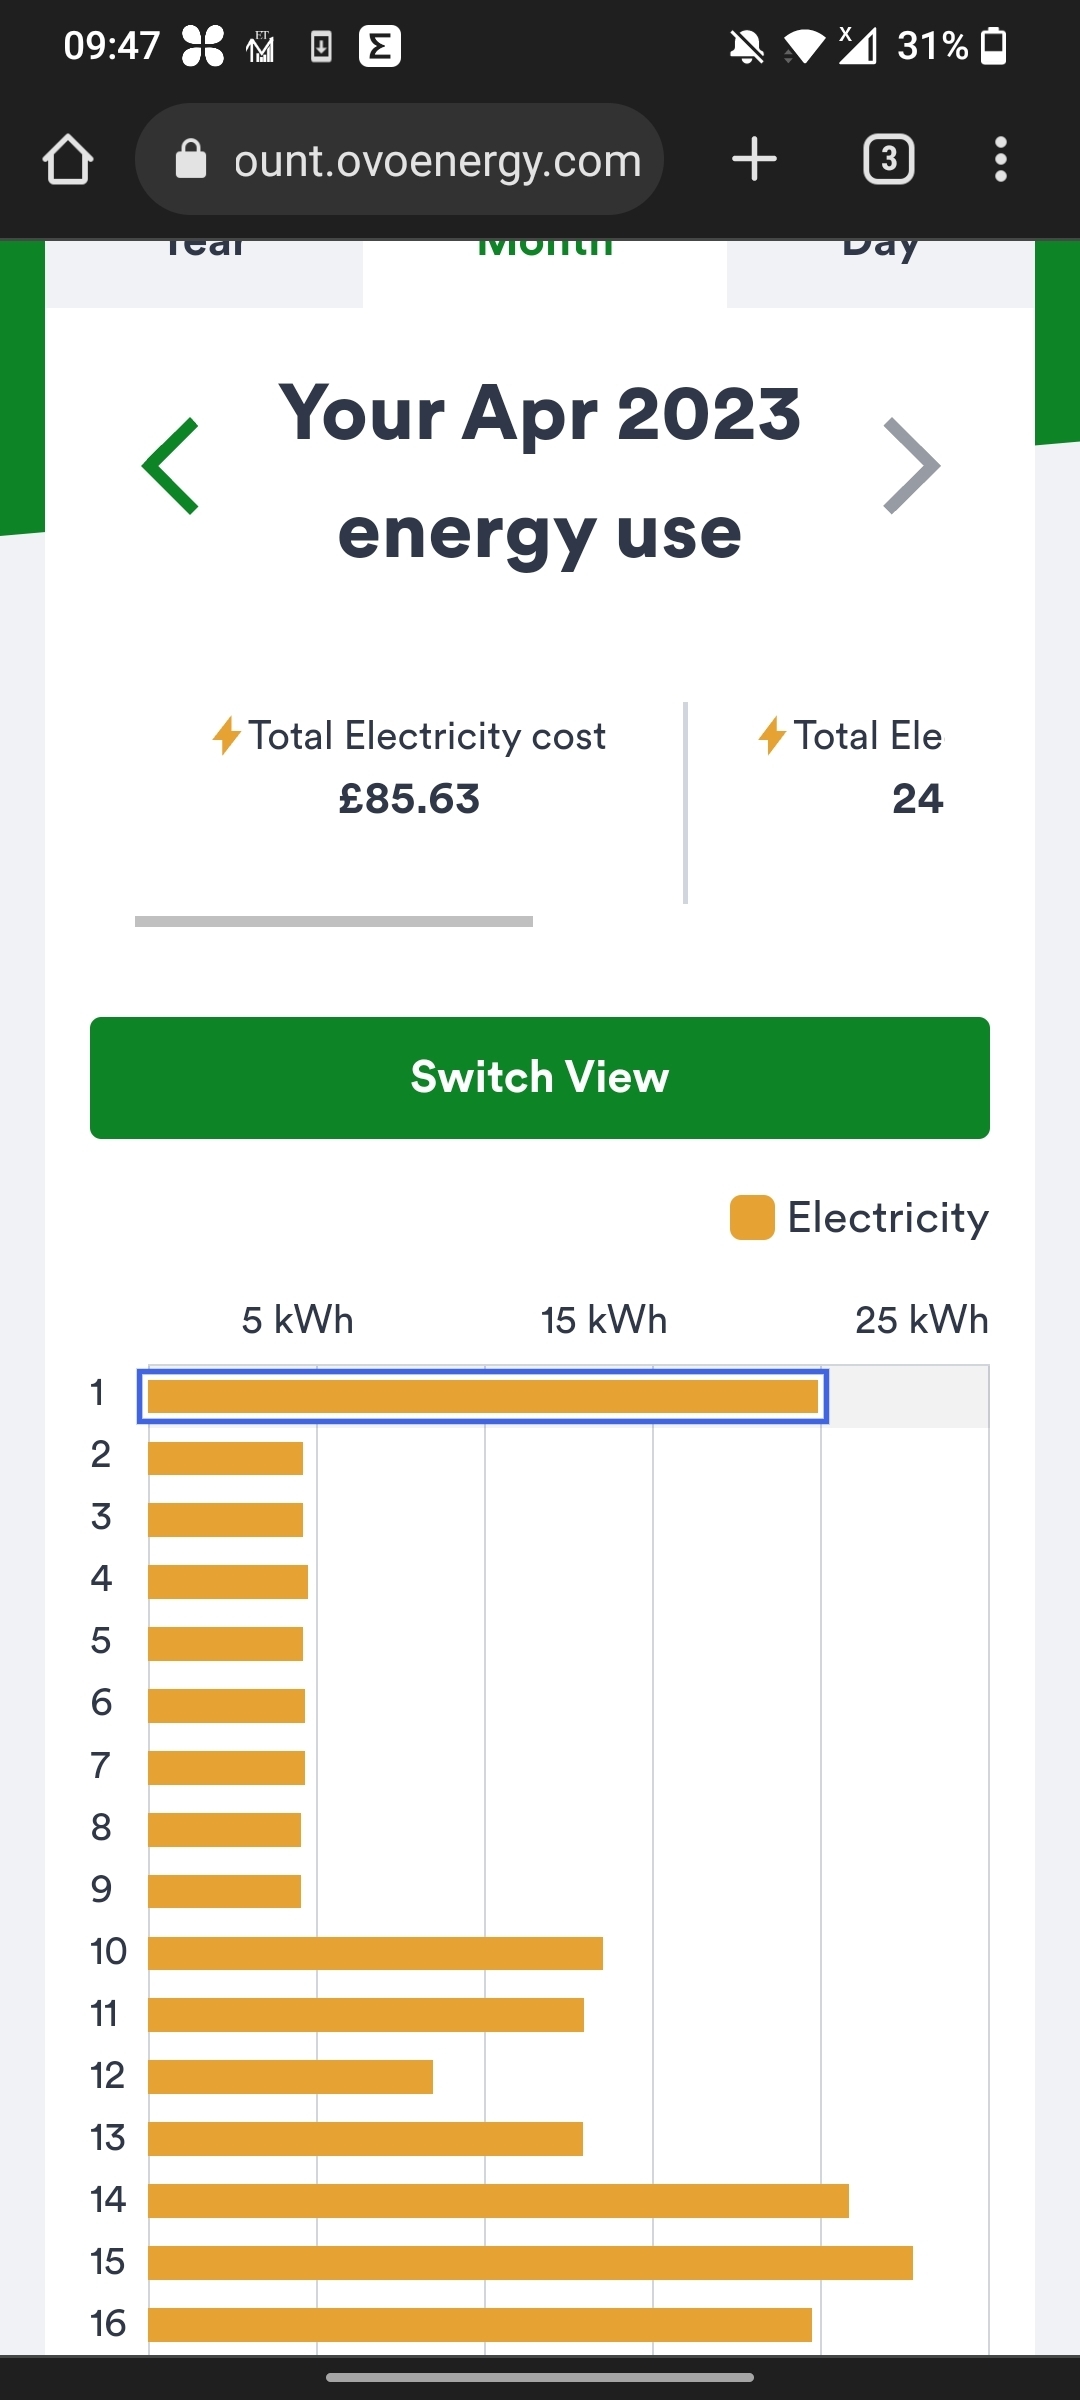
We were on a vacation from Mar 29th - Apr 9th with only the fridge and boiler turned on. However our energy usage shown for days from 29th - Apr 1 is pretty high. For the remaining days i.e from Apr 2 - Apr 9 the per day usage reported is the same each day and as expected since we were out on vacation. 

But why would the 29th - Apr 1 usage is not the same and very high compared to the rest of days we were out on vacation. 


Best answer by Jeffus

Updated on 14/03/25 by Ben_OVO

If there is a period where your smart meter doesn’t send us daily or half-hourly reads then your online ‘Usage’ section will not display correct data for this period, and never will. The ‘Usage’ graphs only update when we are getting regular readings. 


Hi @Jeffus @BPLightlog ,

Thanks for your response. However, I don't see any readings recorded from Mar 7 - Apr 2. Please note that I moved to this apartment on Mar 7th. 

OK as you only moved in on the 7th  March it can take up to 6 weeks for the smart meter readings to completely settle down.

During this period in particular unfortunately the Usage page and the Reading page can show the data on different days. 

You are definitely only charged what you see on the Reading page, never what you see on the usage page. 

The data on the usage page on those days with missing smart reading data on  the reading page are just estimates as OVO had no readings on those days so is simply estimating the split of data over those days. In your case the estimated split wasn't easy due to holidays.

However just to reiterate that doesn't matter.

It can be confusing as you can't quickly see what are estimated data on the usage page.

The good news is you are now seeing daily smart readings on the readings page. 

The following topics may also be helpful:

21 replies

Jeffus
Rank 20
Rank 20
April 26, 2023

@Jeffus Got it. Thanks. The bill was £190 and usage around 420kw, which I feel is quite high provided we were out for 10 days that month. But that is something I should work with the OVO support. Thanks for all your inputs


You should get a better idea in the next bill or looking at the usage page but only from 3rd April onwards. 

The Day usage tab is useful as it will show to the nearest 30min when you are using electricity. You should be able to see any spikes or any large continuous electricity usage for things like fridge freezers or anything left on by mistake etc.

Feel free to post any queries in the future. 

https://account.ovoenergy.com/usage?datePeriod=daily&unit=kwh&fuel=electricity

If you have any concerns about the meter itself you can run a creep test yourself

Hope all goes well in your new property. 

Broken2
Newcomer
Newcomer
October 30, 2023

Hi all

New forum member 1st time poster. So apologies if this is a post that has been previously addressed.

We have noticed that we are having one hour spikes in electricity usage showing up on our data from the smart meter. Usually one appears around 01:00 to 02:00 and a second one around 06:00 to 07:00 (approximate times).  Occasionally we get one around 17:30 as well.  I work shifts so have been up and about ensuring that all electrical appliances are off. Fridge and Freezer not running as well as heating, lap tops etc. We have even tried to switch off the random items such as the Sky box in case of a it being a random download etc (don’t think they would consume a kilowatt in an hour in any case?).


Immersion heater is also definitely off overnight. No house alarm, external sensor lights are energy saving bulbs on a PIR and usually rarely activated.


We have solar panels fitted with an independent energy meter that confirms this load alongside the OVO app.


Currently we are seeing usage of around 2kw before the main part of the day has even began.   
 

I have looked around for answers - one

possible explanation is that this is the standing charge being added? 
 

Would just like to get some clarification and or to see if other users have noticed this phenomenon?


Broken2
Newcomer
Newcomer
October 30, 2023

Oh btw it’s the KWH usage, I’ve attached an image from our solar usage app that mirrors the OVO data. At the time of the reading I was home from work and checked all appliances were off.


BPLightlog
Super User
Super User
October 30, 2023

Can I ask where this consumption data comes from @Broken2 ?

Many of the ancillary measurement systems (including solar) are not completely accurate and so the answer may depend on that. 
Do you have a smart meter?

Bring me Sunshine ~ E&E {Solar PV, Battery Storage, Hybrid EV, ASHP and Home Assistant automation}
Broken2
Newcomer
Newcomer
October 31, 2023

Good morning 

Thanks for your  reply ⬆️ 

Came home from work this morning and checked both OVO and solar apps to find that we were apparently using 1kw again. Checked all over and  no apparent appliances  which would use that level of electricity on. 
 

Decision was to throw hands up in the air and put the kettle on and damn the meters.  Took off work boots and walked to the sink to fill up the kettle, noticed that the normally cold floor tiles seemed warm underfoot….  Yes, we have electric under floor heating fitted, eureka moment. 

Checked the digital switch for the heating mounted in the utility closet which was supposed to be, off.  Blank screen found -indicating it was  off or so I thought.  Switched  it on to see a ‘flame’ signal and a temp indicating it was drawing power and reading a temp of 19 degrees. I dug out the manuals for the system to discover that even when it’s in the ‘off position’ there is an automatic min temp  setting option which in this case was set to 20 degrees by the installers. That’s now reset to a more conservative 12 degrees. 
 

It may seem trivial but 2kw a night soon adds up and, for no real benefit in this situation. 

The moral of this story is trust the meters and keep searching room by room - it’s there to find even by accident as it turned out!

Case closed I’m relieved to say. 
 

Thanks for reading. 

BPLightlog
Super User
Super User
October 31, 2023

Good that you found out @Broken2 . So if all else fails,  ‘take shoes off to check for heat’ 😂

Bring me Sunshine ~ E&E {Solar PV, Battery Storage, Hybrid EV, ASHP and Home Assistant automation}
Newcomer
October 14, 2024

All week my meter usage is a normally the same , approx £1.36 a day , and that’s me at home cooking , washing etc, so how come on a Saturday when we were away all weekend , nobody at home , that my usage doubled !!!!

Abby_OVO
Community Manager
Community Manager
October 15, 2024

Hi @winkvyner 


Sorry to hear this.


Where is it you’re viewing this data? If you’re looking at the IHD it could be estimated and may not be accurate.


Have you checked the meter readings themselves on your online account? It could be that those have been estimated?  


Let us know if you’ve there are meter readings for the weekend or if the usage has been estimated. 

Currently Playing: She's Electric
Newcomer
October 15, 2024

It’s on my ovo energy user app , now this is puzzling , because when I last looked at Saturday 12th reading it was £2.83 for Saturday but it now miraculously seems to have come down to £1.63 🤷🏼‍♀️, which considering there was nobody in the house from 8.30 am on 12/10/24 until 1pm on 13/10/24, it’s still more than days in the week when washing,  oozing , heating etc was in use 


juliamc
Rank 20
Rank 20
October 15, 2024

If you check the actual meter readings on your app you should see what data OVO uses to produce this graph. Unless you have a smart meter with half hour data I think the usage graph is a ‘best guess’ of your usage.