Solved

How can I compare my peak and off-peak energy usage costs?


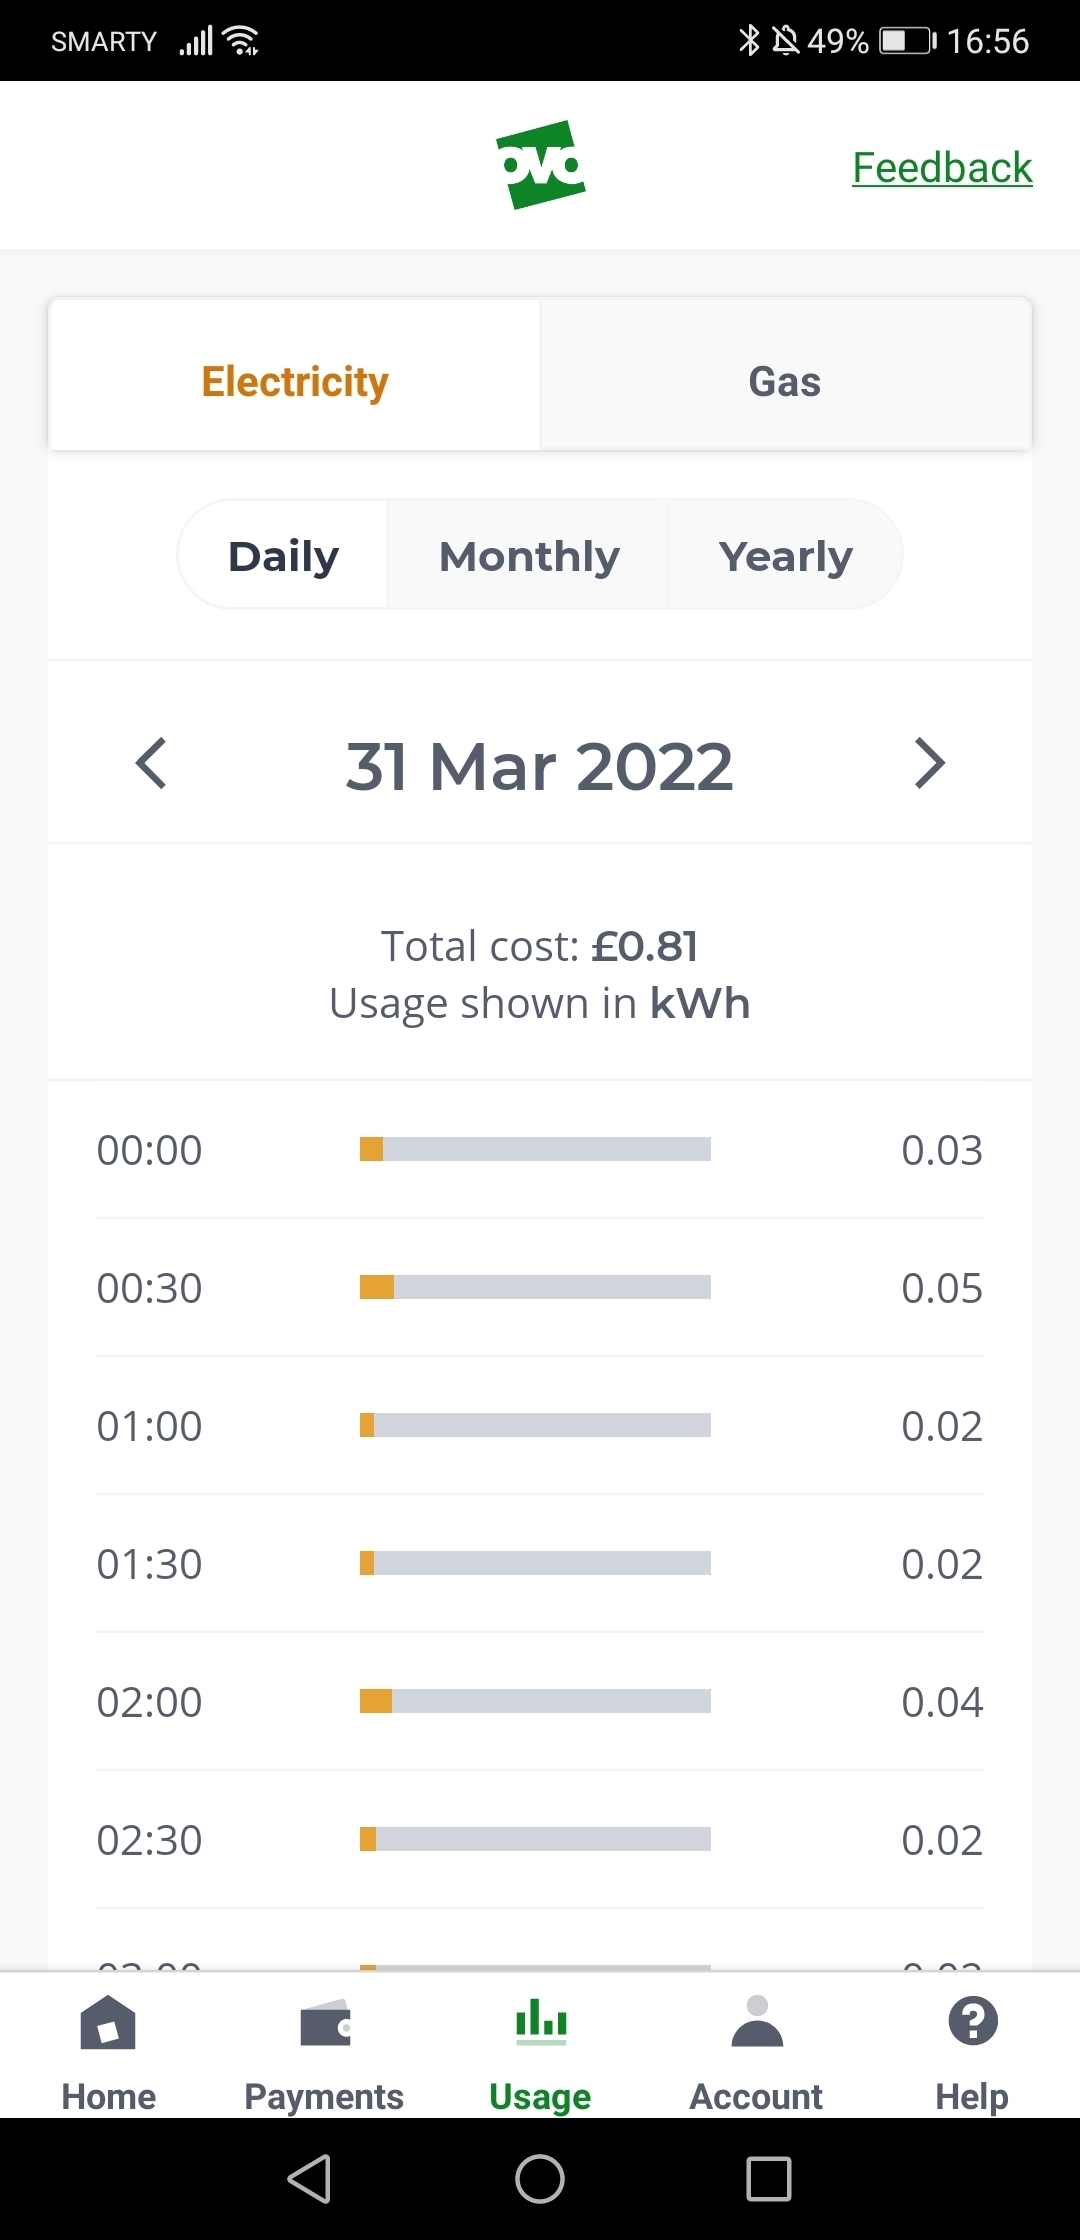
Hi, I had the new SMETS3 meter and In-Home Display (IHD7) installed and just been told by OVO that you can only see the night rate and usage on either of the devices if you look at them when the rate changes which is midnight or 1am depending on where you live.

That isnt a useful feature if you want to track previous days/weeks usage during waking hours to improve usage efficiency!!

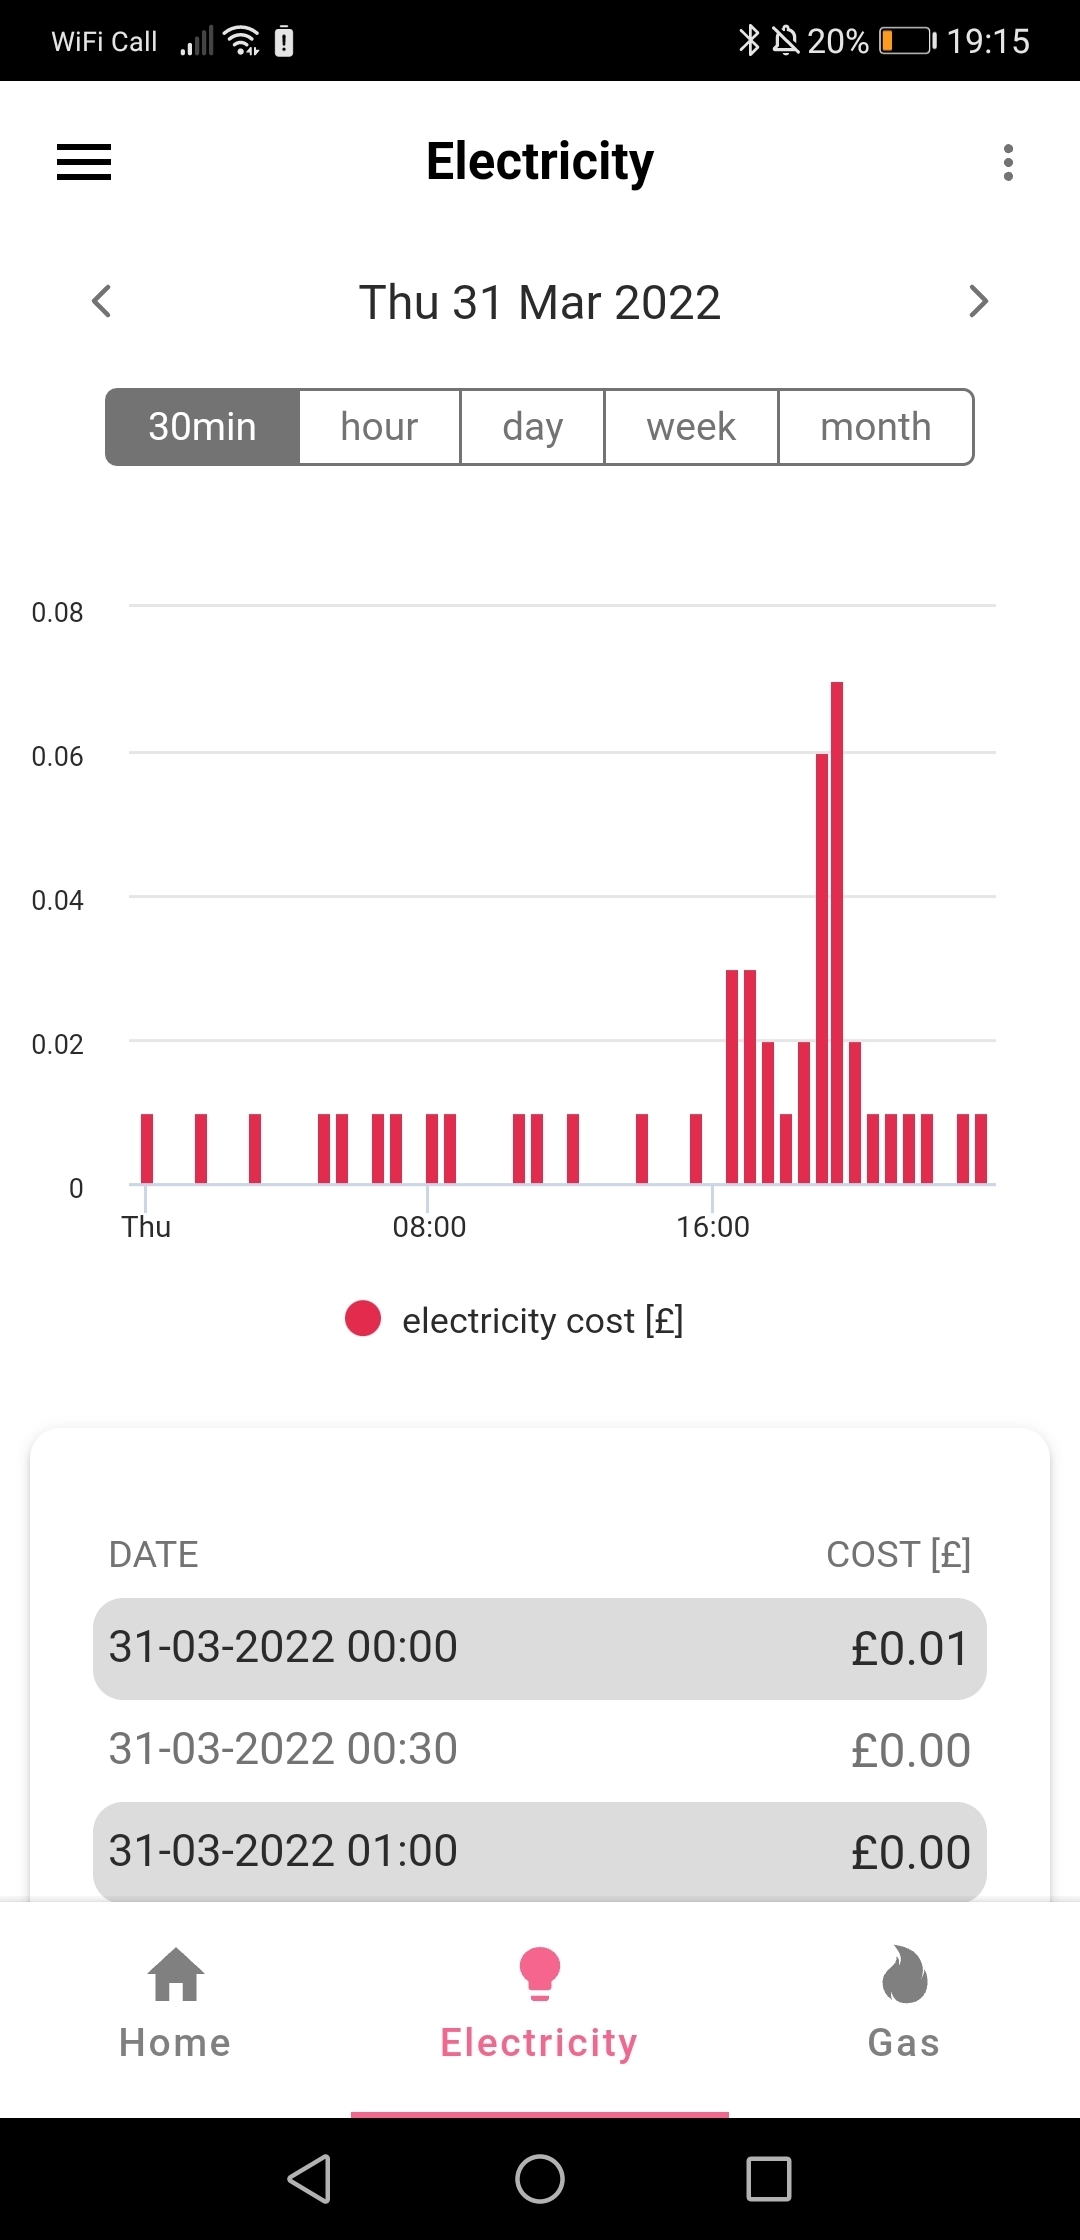
Does anyone know if there's a way around this please.

Cheers. Karl


icon

Best answer by Jess_OVO 6 April 2022, 11:51

View original

16 replies

Userlevel 7
Badge +1

Hi @Karl_L ,

SMETS3 doesn’t exist, did you mean SMETS2 by any chance?

As far as I’m aware, this is correct in terms of most IHDs. However, it is possible to check your meter readings for both rates at anytime. If you could show me photos of your meter and IHD, I can help you with that.

If you have your meters set up for Half-Hourly readings, you’ll also be able to check MyOVO for the previous days usage. The Support Team can set your meter up for you to do this if it’s not already active.

Hi Blastoise186


You're right its a SMETS2 Aclara SGM1411-B meter with the circular blue (A) and orange (B) buttons side by side.

It's is set up for half hourly readings.

I understand that it can take up to 6 weeks for the meter to be updated with correct economy 7 rates.

The only rate that's shown is the peak rate so I thinking that it might not show both until sometime within the 6 weeks.

I now have the OVO app but this is only showing a single usage figure with no ability to view daily, monthly or yearly so I assume the app will also take up to 6 weeks to reflect correct and more detailed data.

That leafs me to believe that it's also then why my IHD isn't correct either.

This seems like a long way of saying that I should review again in 6 weeks and see what I've got.

Don't understand why it would take that long for the meter to reflect actual rates and usage across both tarrifs.

Cheers


Userlevel 7

Great to see @Blastoise186 has managed to narrow down your meter model there, @Karl_L.


Sounds like you’re still in that 6 week initialising phase which might explain why the rates on your meter and In-Home Display are yet to be updated. Another of our forum users has written this great guide which really helps explain what happens behind-the-scenes to get things up and running.


Worth mentioning that your smart meter would be installed to match the meter mode of your previous meter, so in your case a dual rate or Economy 7 mode. You can check this by taking a manual reading from the meter. To do this press the ‘A’ button on the meter until you see TOU rate 1 (your first reading) and then TOU rate 2 (your second reading).


Hopefully this helps put your mind at ease before those rates are updated! 

Hi @Jess_OVO


Thanks very much for the update. The practical guide was very useful and clarified a lot, particularly why it takes up to 6 weeks for the correct data to be displayed on the electricity smart meter.


The one thing I'm still unclear about is whether what the OVO customer service agent told me (after she'd checked with an engineer) about being able to see the night rate and usage on the smart meter.

I was told that the meter only displays these during 12am to 7am by replacing the day time readings and then reverts back to the day time rate and usage so you can never scroll between the two.

She said the same applies to the IHD.

This seems odd but I can't check this until after the 6 weeks.

@Blastoise186 touched on this earlier but wonder if there's and firm statement on this?

Cheers


Userlevel 7

Great question this one, @Karl_L.


I’ve had a quick check on our Aclara S2 guide and looks like you’ll only be able to check the unit rate of the active register via the meter, as you mention.


What I’m not sure of yet is whether both rates would be available to check via your IHD. What information is shown when you click on the ‘Menu’, then ‘Account’ option and scroll through by using the arrows? According to the guide I have access to your tariff information should be available here but I’m not sure if this applies to both rates for an Economy 7 plan. It would be really helpful if you were able to check this and report back so can update our IHD guide to help others 😊

Hi @Jess_OVO 


My meters and IHD have completely caught up now.

The IHD doesn't show the economy 7 night time rate or usage.

The OVO app shows a bar graph of kWh usage in 30 minute slots but not what the cost is for each slot.

This means that I can't see a way of understanding what it costs to use equipment during the night rate.

Cheers

Karl

Userlevel 7

Glad to hear the unit rates have now updated, @Karl_L.


A really valid point to raise, about the options our online usage graphs provide for comparing your usage costs during your peak/off peak times. Whilst the half-hourly usage cost option isn’t currently available here, I’m wondering if you might be able to check your ongoing usage costs for each time-period via the ‘Billing’ page. If your smart meters are sending us daily meter readings your energy costs will update here daily.


Let us know if this helps. 🙂

Hi @Jess_OVO 


I've checked the app and the website and both have the same issue where you aren't offered the cost/kWh slide button when looking at the daily view. All I can get is the half hourly kWh usage so something is wrong.

The cost option is available for monthly and yearly.

Cheers

Karl

@Jess_OVO 


I've found on the forum that there are many other customers with the same issue and from what I can make out it looks like a bug that the OVO tech guys were working on back in January.

What's the resolution please?

Thanks

Karl

Userlevel 7

Updated on 04/07/23 by Emmanuelle_OVO

Sorry for the confusion there, @Karl_L.


Sounds like you may be referring to this topic on missing daily cost usage data (which you can access by clicking on the ‘month view’), which is a slightly different issue than the one you describe (and should now be resolved). Our ‘Usage’ pages aren’t programmed to offer half-hourly cost data currently but this is valuable feedback which I’ll be passing on to the team.


As an alternative source for this peak/off-peak usage comparison, I’m wondering whether the information shown on your ‘current billing period’ which you can find by heading to the ‘Billing History’ menu option might be another place to keep an eye on this. 


Hope this helps. 🙂

Hi @Jess_OVO 


The key outstanding issue that I've been trying to resolve now is the fact that there's nowhere you can go to see what you've spent in any given half hour in order to see what it costs to use various white goods during the day vs economy 7 night rate.

I can't find it in the app or on the website (including billing history).

This issue is what I've noticed many people are complaining about for some months.

If you think I can see this somewhere can you send me a screen shot of what you're thinking of?

Cheers

Karl

Userlevel 7
Badge +2

Hi @Jess_OVO 


The key outstanding issue that I've been trying to resolve now is the fact that there's nowhere you can go to see what you've spent in any given half hour in order to see what it costs to use various white goods during the day vs economy 7 night rate.

I can't find it in the app or on the website (including billing history).

This issue is what I've noticed many people are complaining about for some months.

If you think I can see this somewhere can you send me a screen shot of what you're thinking of?

Cheers

Karl

On the Usage page there is a Day tab. It is on the app and the website. 

If you can't see 30min readings on this, ask customer services to change the settings on your smart meter for 30min readings. 


Hi @Jeffus 


I am seeing the 30 minute readings on the app and website but its not showing the option to see what the cost is within each 30 minute slot. You only see kWh.

The image you've attached above demonstrates this as there's no Price/kWh option above the table!!

I want to see the Price info within the day table

Cheers

Karl

Userlevel 7
Badge +2

Hi @Jeffus 


I am seeing the 30 minute readings on the app and website but its not showing the option to see what the cost is within each 30 minute slot. You only see kWh.

The image you've attached above demonstrates this as there's no Price/kWh option above the table!!

I want to see the Price info within the day table

Cheers

Karl

You could use the third party Bright app. 


Thanks @Jeffus 


I can see from the image that its the data that we'd expect OVO to be able to provide via their app or on the website so its clearly possible but not being provided.

I'd like to get some feedback from @Jess_OVO about what the tech support team / developers say about it's planned availability.

Cheers

Karl

Userlevel 7
Badge +2

Thanks @Jeffus 


I can see from the image that its the data that we'd expect OVO to be able to provide via their app or on the website so its clearly possible but not being provided.

I'd like to get some feedback from @Jess_OVO about what the tech support team / developers say about it's planned availability.

Cheers

Karl


If you decide to use the Bright app, the same company also have a separate beta website where you can download a spreadsheet of 30 min watt usage.

This might be useful if you want to compare usage and hence cost over a long period. 

https://smarttariffsmartcomparison.org/home

I suspect Jess won't be given anything on potential availability of 30min cost data. 

Reply