
How is the FAC calculated?

  • March 1, 2025
  • 12 replies
  • 178 views

Firedog
Plan Zero Hero
Forum|alt.badge.img

Updated 27/08/25 by Emmanuelle_OVO:

[FAC = Future Annual Consumption. It has other names, but it’s a figure used by the Direct Debit calculator to determine a predicted cost for the period it covers. It’s akin to the EAC, a figure determined by the energy industry and made available to comparison sites, so they can all calculate annual costs on the same basis. OVO publish the FAC for an account on the Plan page in a browser, but it doesn’t seem to appear anywhere in the app.


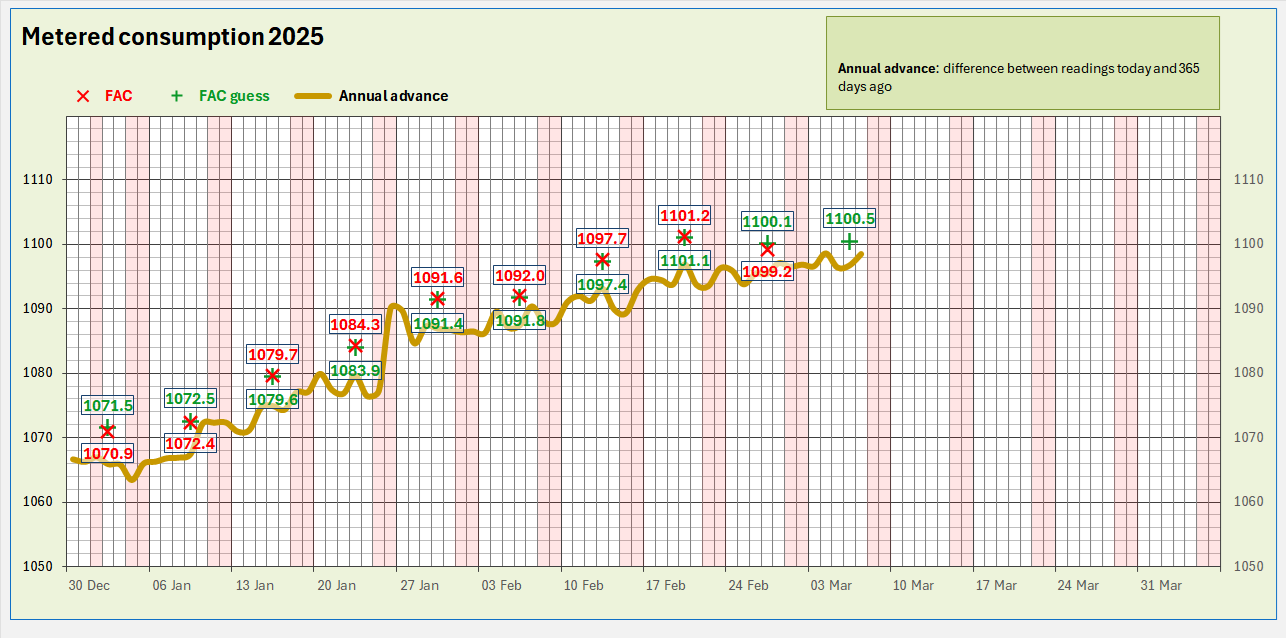
This question has been exercising me ever since my SMETS1 meter was exchanged for a SMETS2 model in 2023. Nothing I read anywhere could explain the odd FACs I was seeing. I eventually discovered that, despite what the documentation says, all historic data preceding a meter exchange (MEX) are discarded. The FAC is then calculated on the basis of actual consumption and a notional figure (the EAC) provided by 'industry'. That notional figure is also allegedly based on a nominal starting value, adjusted periodically for actual consumption. This just didn't happen for my account for a number of reasons, so it wasn't until a year after MEX that my FAC reached parity with actual consumption for the preceding year. Since then, my FAC has been quite reasonable, but it's not the same as the actual metered consumption. I think I've found a way to predict the FAC that tallies pretty well (but not precisely) with the published figure. These are the results so far this year:
 

Note the distorted scale. Any variations would be barely distinguishable if the ‘Y’ axis started at zero.
Major wobbles (e.g. 26 January) result from Power Move Flex Power Up events.

  
Points to note:

  • This is an electricity-only household.
      
  • The meter is configured for Economy 7 and the MPAN shows PC02, i.e. this is a domestic multi-rate metering point.
    This is a bit trickier to handle, so the FAC is only updated weekly. I understand that single-rate (PC01) MPs may have their FAC updated more frequently. Even though I'm nominally on E7, I opted some time ago to pay the same rate for peak and offpeak usage.
      
  • My new FAC appears in whole kWh on the Plan page like clockwork every Sunday morning.
    I have to sneak round the back to find out what the precise figure is, so that I can do my own Direct Debit calculations. I get it from the DD API, which tells me what the yearly predicted energy cost is in £p. It's then a quick calculation to remove the VAT and the standing charge; what's left divided by the unit rate gives me the FAC, which I round to one place of decimals. This is the figure used to calculate DDs.
      
  • It used to be quite simple to get the FAC for peak and offpeak usage, but that ability went away when my tariff was fixed last year, so I'm stuck with a single overall figure.
    That may be the reason why there is a tiny (±0.05%) difference between my guesses and the actual outcome.
      
  • Why is the published FAC consistently higher than the annual consumption?
    I think it's because the calculation also looks at older data, in my case from MEX in September 2023. At the moment, these include two winters but only one summer, so of course the annualized consumption over the whole period is marginally higher (~0.8%) than the actual consumption over the past twelve months alone. I won't be able to see whether this hypothesis is true until we reach the meter's second birthday in September 2025. I don’t know how far back the calculation goes for older meters, but ISTR reading five years somewhere.
      
  • While the newest FAC is published on Sunday morning, I had to experiment a bit to find which readings were actually being used. It seems to be the preceding Thursday's. I don't know whether the figure is the midnight snapshot or one polled specially for this purpose. If it is a one-off reading, this could also add to the 0.05% discrepancy.
      

I've chosen to publish these findings now, because the latest guess is for the first time this year lower than the preceding one. I can hardly wait to see whether Sunday's FAC will also be lower than last week's. Any betting people among you?


12 replies

Firedog
Plan Zero Hero
Forum|alt.badge.img
  • Author
  • Plan Zero Hero
  • March 8, 2025

Don’t all shout at once!

One week on, I can reveal that my confidently-announced prediction for last Sunday’s figure was wrong. A bit. Instead of the 1100.1 I was expecting, the FAC came in at 1099.2. The difference is still completely insignificant (-0.08%), but it’s bigger than usual.  Let’s see what tomorrow (Sunday) brings. 
  

Note the distorted scale. Any variations would be barely distinguishable if the ‘Y’ axis started at zero.
Major wobbles (e.g. 26 January) result from Power Move Flex Power Up events.


Nukecad
Plan Zero Hero
  • Plan Zero Hero
  • March 9, 2025
  • My new FAC appears in whole kWh on the Plan page like clockwork every Sunday morning.
      
  • While the newest FAC is published on Sunday morning,


That’s interesting because mine, for both electricity and gas, change daily on the plan page.

I’m also on a fixed tariff, but it’s single rate not E7.

I’ve been keeping a daily record of their ups and downs on a spreadsheet, particularly since my new gas meter started sending half hour readings daily.
(but I haven’t bothered puting them into a graph/chart).
 

This is for January:

As you can see my electricity FAC is fairly stable, and my gas FAC was coming down nicely (as it should).
My gas FAC is continuing to reduce to where it should be, and is now down to 9719 as of the 7th March.
Which TBH is lower than where I calculate it should be now, (I’ve used more gas than usual this winter) so I’m expecting it to rise again.


Firedog
Plan Zero Hero
Forum|alt.badge.img
  • Author
  • Plan Zero Hero
  • March 9, 2025

Yep, I learnt long ago that multi-rate supplies - PC02 - (e.g. E7) only have their EAC, and thus FAC, updated weekly. Didn’t I mention this earlier? Yes, I did: “I understand that single-rate (PC01) MPs may have their FAC updated more frequently.” 

You have two newish meters, right? Do you have a full gamut of meter readings* from when they were installed? If so, you could test my hypothesis. This only works if you have at least one year’s readings. Anything less than that is subject to interference from the EAC/AQ.

  • Calculate A the meter advance over the past year by finding the difference between today’s reading and the reading 365 days ago.
  • Calculate B the annualized advance ab ovo by dividing today’s reading by the number of days since it was installed and multiplying by 365.
  • Take the average of A and B
      

*  My latest 400 readings are available here:  https://smartpaymapi.ovoenergy.com/orex/api/meter-readings/nnnnnnn
where nnnnnnn is the OVO account no.


Nukecad
Plan Zero Hero
  • Plan Zero Hero
  • March 9, 2025

I have all my readings (and billing) back to June 2021 when I moved into this flat, it was SSE then with old SMETS1 meters that had gone dumb.

I got a SMETS2 electricity meter in March ‘23 and SMETS2 gas meter Nov ‘24.

The electricity FAC has always been reasonable, the gas FAC was at one time 3x what it should have been (for reasons we have covered before, including a wrong meter serial number at one point), but now the SMETS2 meter is in place it's gradually being corrected.


Firedog
Plan Zero Hero
Forum|alt.badge.img
  • Author
  • Plan Zero Hero
  • March 9, 2025

OK, so you can at least work out what your FAC for electricity should be. Do you find the same sort of agreement that I did? You’re better placed than me, having two full years of historical data, so no summer/winter skewing. I’d find your results very interesting ...  


Nukecad
Plan Zero Hero
  • Plan Zero Hero
  • March 10, 2025

TBH because of the failed gas MEX in March 2023, and then the subsequent wrong meter serial number at Exoserve, there were a lot of factors at play in my gas FAC.

Too many to analyse just OVOs influence on it until the new gas meter was fitted last November and I got it changed to half hourly readings in January.

It’s only since January that I can realy rule out external influences.

I’d find your results very interesting

For what it’s worth I will PM you a couple of spreadsheets with my recorded figures.
EDIT- No I won’t because I can’t attach anything to a PM, I’ll anonymise them and attach them on here, watch this space.


Nukecad
Plan Zero Hero
  • Plan Zero Hero
  • March 10, 2025

@Firedog  Attached are a couple of usage and FAC spreadsheets as promissed.

I think that they are fairly self-explanatory, but shout if not.


Firedog
Plan Zero Hero
Forum|alt.badge.img
  • Author
  • Plan Zero Hero
  • March 10, 2025

​Attached are a couple of usage and FAC spreadsheets as promissed.
 

Thanks. I’ve downloaded them, so you can remove them from here if you like. Off to look!


Nukecad
Plan Zero Hero
  • Plan Zero Hero
  • March 10, 2025

There is no identifying data in them, they are just dates and numbers, so I think that I’ll leave them up.

One thing that did strike me when looking at the changes to the gas FAC when I was sending manual readings is how often there would be a change then a revision the next day.
ie. How often the changes came in pairs on consecutive days.

The usage one is also interesting, I’ve noticed for a while that it shows my energy usage has been growing this past 12 months, particularly for gas.
(Although perhaps it’s just getting back to a more comfortable normal after cutting right back during the energy crisis?)


Firedog
Plan Zero Hero
Forum|alt.badge.img
  • Author
  • Plan Zero Hero
  • March 30, 2025

 It’s been a long time, Inspector …

Sorry not to have reacted sooner. Your figures aren’t much use to me, I’m afraid, because what I really need are the meter readings, because that’s what the FAC calculation is based on. You’ll notice that I’m nit-picking about tiny differences (< 0.1%), so estimates based on usage data aren’t going to be precise enough.

I think I may have stumbled on the reason why my guesses differ from OVO’s published figures. This is the current chart, with today’s published figure of 1107.4 against last Thursday’s guess of 1107.0. For a change, the guess is lower:
  

Click to see a larger image

 
This led me to compare the average usage figures for the first half of each day, i.e. 00:00 - 12:00, between 27 February and 19 March on the one hand and for the week 20 - 26 March on the other. As I suspected, the second figure was significantly higher (1.77 as opposed to 1.47 kWh). This leads me to suspect that the reading used by OVO’s FAC calculation isn’t the midnight snapshot I have to use, but an instantaneous one retrieved for the purpose, possibly sometime during the day on Thursdays. The differences between my guesses and the official figures most probably arise from this variation in the proportion of daily consumption before the reading sampling point. 

This means that I can’t ever expect to be able to match the official figure precisely, and will have to accept that there will always be an error of up to ±0.1%. Rats! Still, I’ll keep ferreting.


Nukecad
Plan Zero Hero
  • Plan Zero Hero
  • March 31, 2025

After all our investigations, for me it seems simply that the OVO FAC forecasting system has been devised to work with smart metering that has been in place for at least 12 months.

In all other circumstances then (as we have seen) whilst it may work adequately in most instances it will be prone to errors either creeping in, or suddenly jumping in, sometimes very large errors.

It also appears to prioritise the information provided by Elexon and Xoserve over the actual meter readings that OVO have collected.
Whether that’s actual data or ‘Industry Standard’ figures (ie. Estimates).

As such it falls down when:

  • There isn’t a smart meter in place.
  • A smart meter exchange takes place meaning that Elexon/Xoserve don’t have 12-months of data for the new meter.
  • If/when the smart meter is not connecting to the network as it should.
  • There are other metering issues like crossed meters, incorrectly registered meter serial numbers, etc.

TBH most of those circumstances OVO have no real control over.

However one area where the FAC forecasting could be improved is to use OVOs own collected meter readings in preference to the Elexon/Xoserve provided figures, and to only fall back on those 3rd party provided figures where OVO do not have their own customer meter readings (whether smart or manual).


Firedog
Plan Zero Hero
Forum|alt.badge.img
  • Author
  • Plan Zero Hero
  • March 31, 2025

Thanks.

… one area where the FAC forecasting could be improved is to use OVOs own collected meter readings in preference to the Elexon/Xoserve provided figures, and to only fall back on those provided figures where OVO do not have their own customer meter readings (whether smart or manual).


I agree. However, the industry figures (EAC/AQ) are supposed to make it possible for any authorized entity - e.g. approved comparison sites - to use the same data for comparison. I’ve established that they don’t, unless the EAC is firmly established, which it will only be if none of the potential faults you enumerate is present. Calculating the EAC/AQ is an unbelievably complex operation, almost bound to fail unless everything is quite straightforward. 

It would be even more confusing for the average customer if the supplier’s FAC were completely out of line with the industry figure.