Does anyone know if there has been any progress from OVO in getting electricity usage (half-hourly) data available for those of us with a Smart Meter, as a download (ideally as a .csv)? Thanks.

Does anyone know if there has been any progress from OVO in getting electricity usage (half-hourly) data available for those of us with a Smart Meter, as a download (ideally as a .csv)? Thanks.
Best answer by Ben_OVO
Hi again
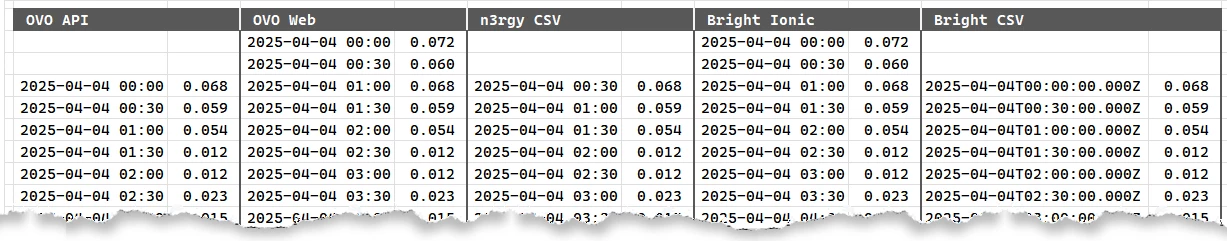
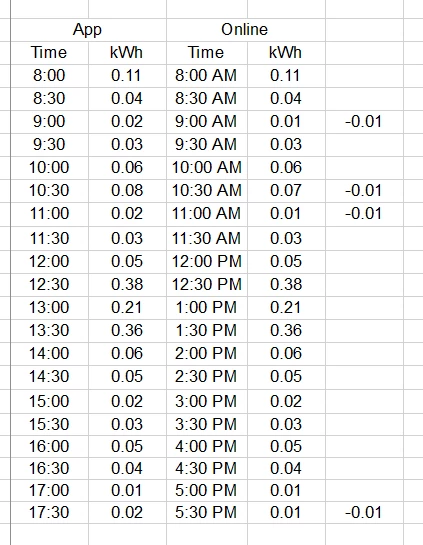
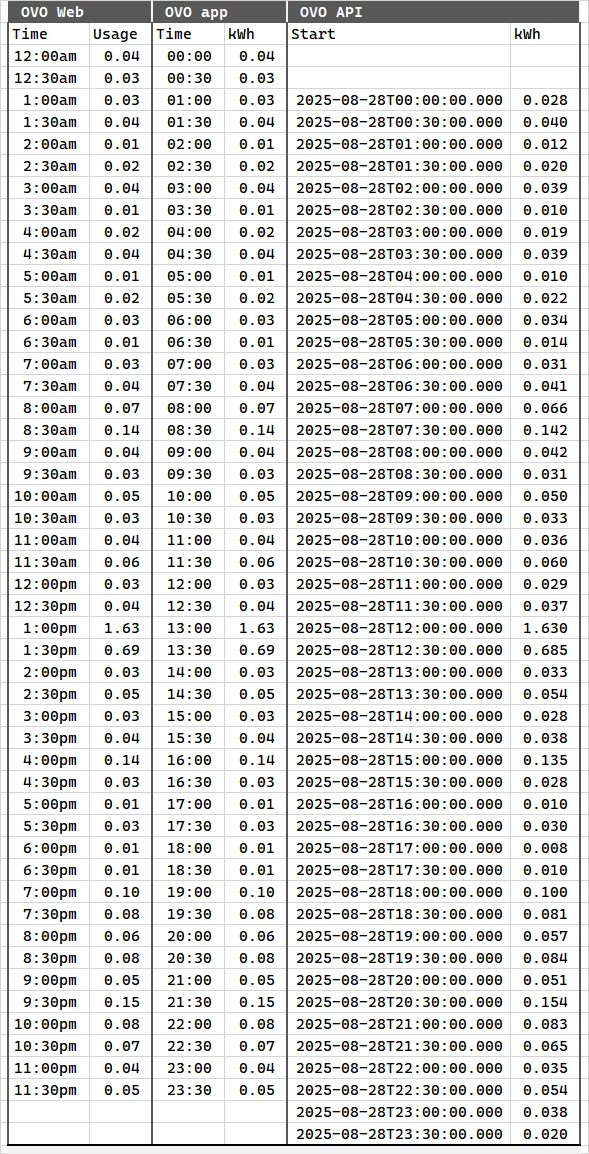
I can confirm that there are no plans to include a downloadable version of Usage on the browser version of the online account, however this feature is now available on the OVO app.
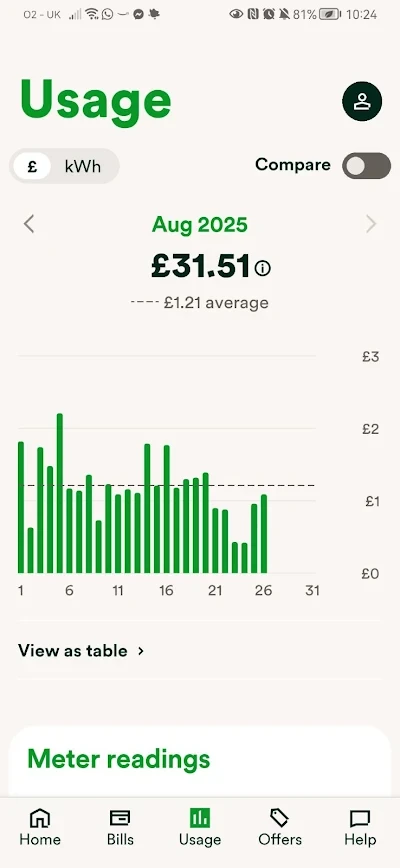
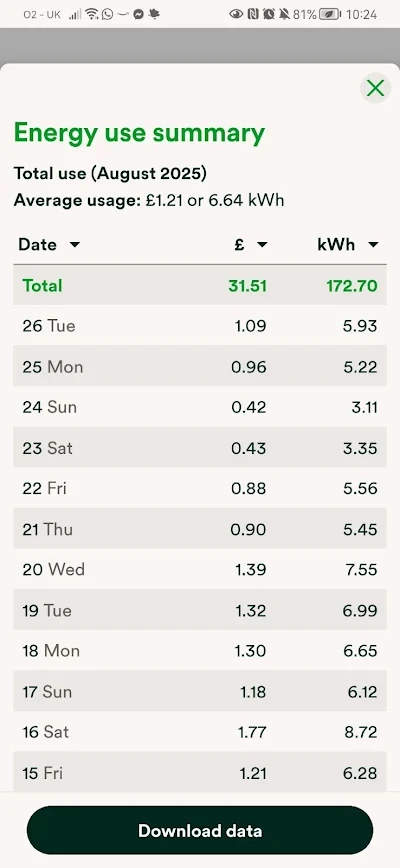
If you log into the app and select ‘Usage’, you can then select ‘View as table’ beneath the usage graph, and then select ‘Download data’. I’ve included some screenshots below:
I hope this helps!
No account yet? Create an account
Enter your E-mail address. We'll send you an e-mail with instructions to reset your password.
OVO Energy Ltd, Floor 5, Crescent, Temple Back, Redcliffe, BS1 6EZ, (Company no. 06890795) registered in England and Wales.
OVO (S) Gas Limited is registered in England and Wales (Company No. 02716495) at Floor 5, Crescent, Temple Back, Redcliffe, BS1 6EZ.
OVO (S) Gas Limited is part of OVO Group Ltd