August 27, 2025
Solved

How can I download Smart Meter Data from OVO?

  • August 27, 2025
  • 15 replies
  • 571 views

Does anyone know if there has been any progress from OVO in getting electricity usage (half-hourly) data available for those of us with a Smart Meter, as a download (ideally as a .csv)? Thanks.

 

Best answer by Ben_OVO

Hi again ​@HexhamUser,


I can confirm that there are no plans to include a downloadable version of Usage on the browser version of the online account, however this feature is now available on the OVO app.


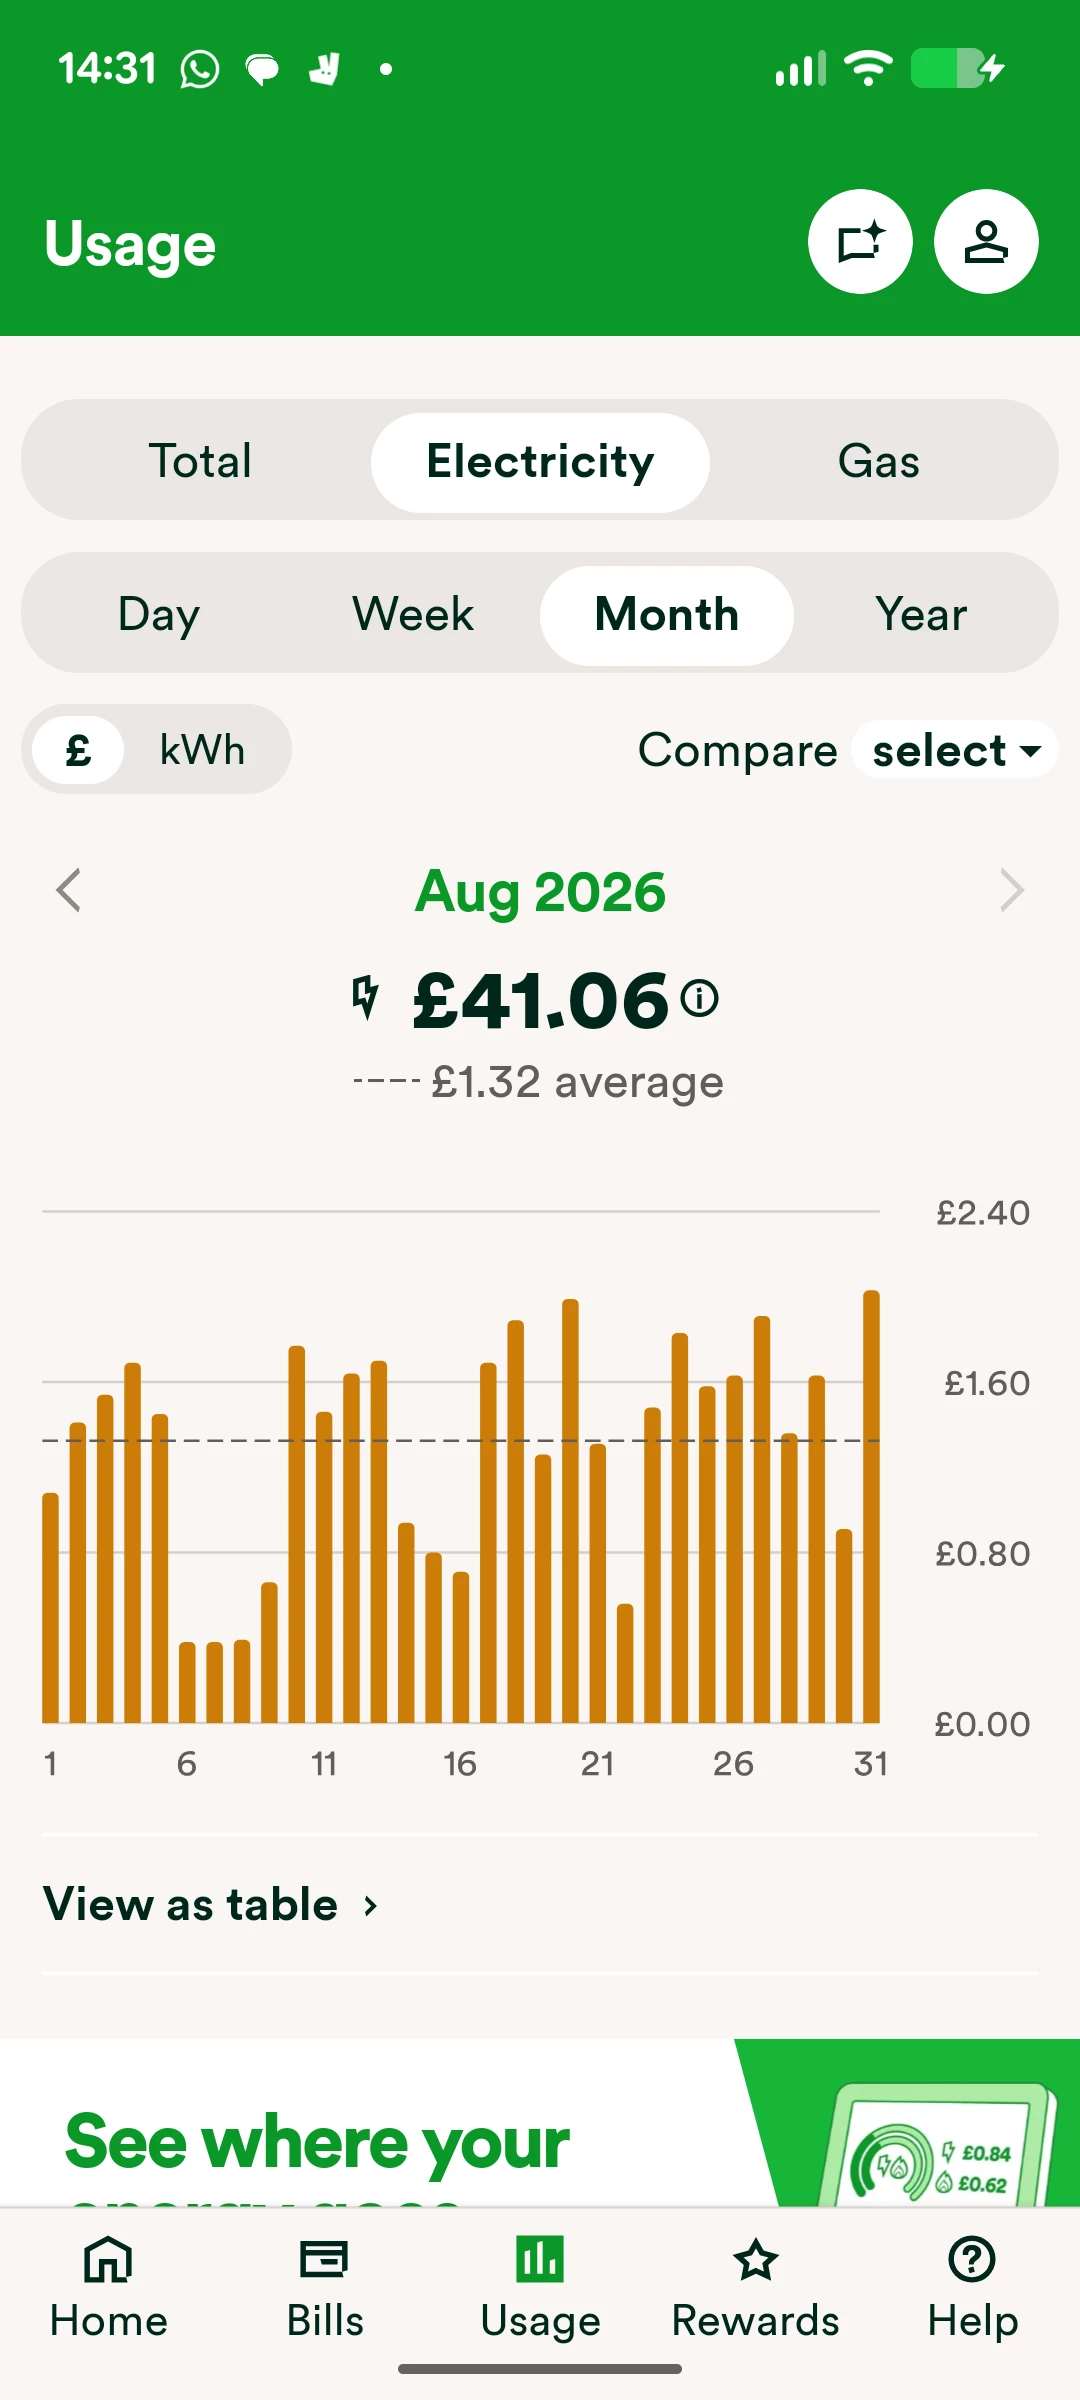
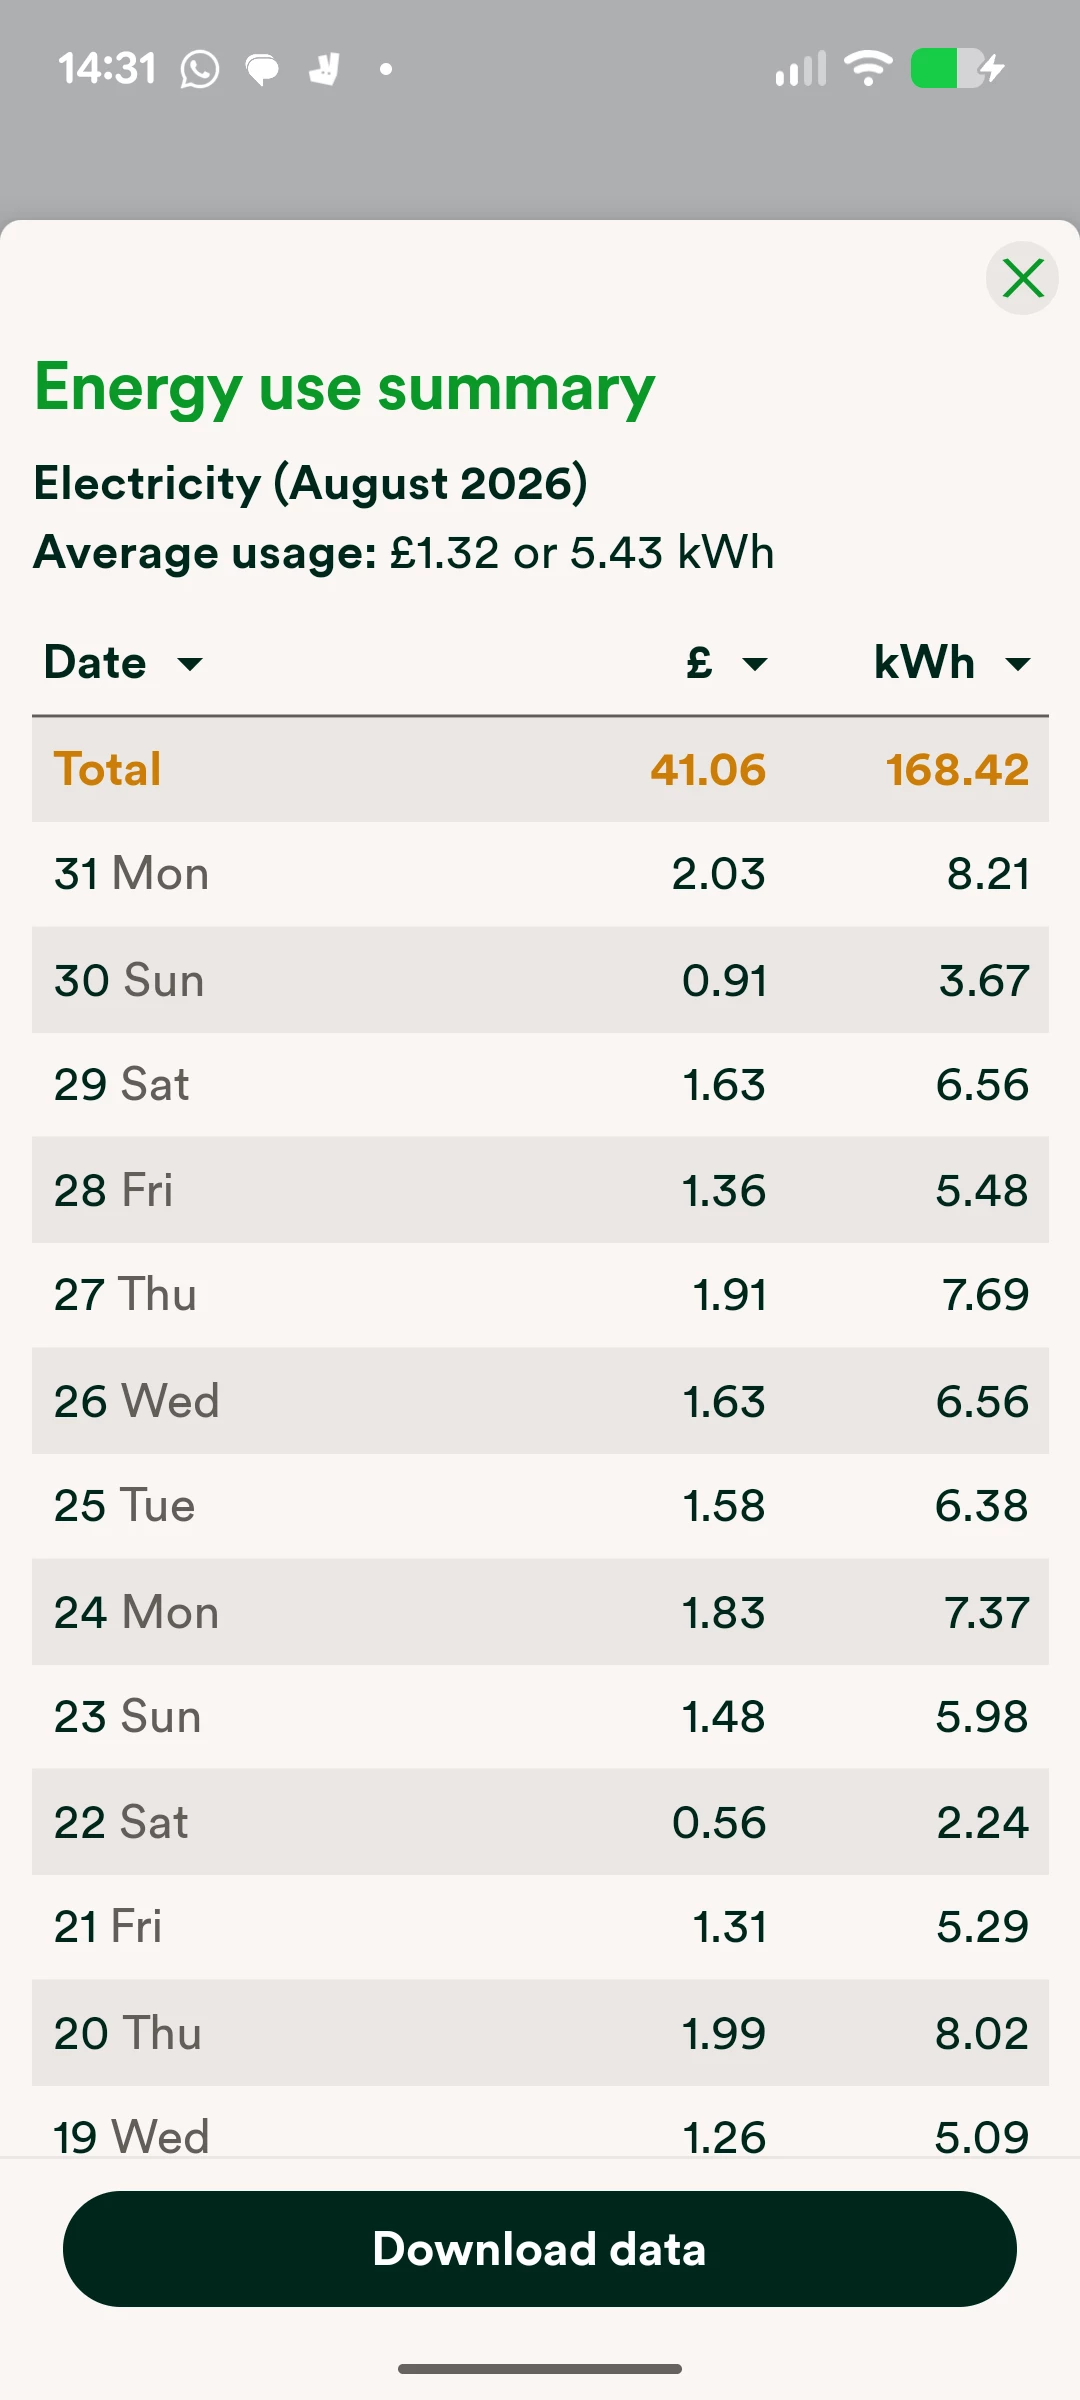
If you log into the app and select ‘Usage’, you can then select ‘View as table’ beneath the usage graph, and then select ‘Download data’. I’ve included some screenshots below:


Exact appearance may vary


I hope this helps!

15 replies

Firedog
Super User
Super User
August 28, 2025

… using CX File Explorer on the phone.
  

I never imagined that I’d have to install a new app to do something as basic as downloading a file from the Internet … Thanks for the suggestion!
  

… a download window in which CX was one of the options.
  

I got one, too, but no sign of CX File Explorer until I went hunting for it.
    

… the figures were slightly different in the app than in the online account, presumably due to rounding differences in each. Only 0.04 kWh over 24 hours so not really significant as 2-DP figures.
 

They should of course be identical to within a rounding error, and I’d say that 40Wh was too big a difference. You might check the two sets of figures side by side to make sure that the same time stamps apply in both. I can’t remember whether I’ve posted this little comparison before; it demonstrates how important it is to make sure the quantities are accurately timed. The quantities in the table are aligned, but the selection of buckets and their time stamps are different in each case. I suppose I should add the OVO app result into the mix - a job for tomorrow.


I really don’t think that the download function in the app is particularly useful in its current form.
 

Noel | I have no official status; I'm just a volunteer who comes here to help other customers. My gear: Aclara SGM 1416-B Electricity-only E7 meter; Chameleon IHD3-PPMID-AAA | It may look as if I know what I’m talking about, but don’t let that fool you. |
Nukecad
Super User
Super User
August 29, 2025

I had already put the figured from the app and from the online account side-by -side and the timestamps line up, 24hr clock from the app, AM/PM from the online.

The differences were in four half hour periods when one set said 0.01 where the other set said 0.02. (sorry can’t remember which way round it was, EDIT see the next post).

To me it looks that the 0.01 was from a 3-DP which  had simply been truncated whereas the 0.02 was a rounding up.
(eg. if the figure to 3-DP was 0.017 and to display the 2-DP equivalent one had been truncated but the other rounded).

For my purposes 2-DP is sufficent.
However I will be sticking with the 2-DP figures from one source and not mixing them.
I’ll probably keep using the online account rather than the app, because that’s what I’ve used on my spreadsheets in the past.

I said, Hey - Watts going on.
Nukecad
Super User
Super User
August 29, 2025

I’ve now done a comparison of the app vs online account 2-DP  figures for my usage yesterday.
I’ve truncated it to between 08:00 nd 17:30 to show the interesting bit.

As you can see there are again 4-hours that show a difference (a different 4-hours than the previous day).

I still believe that will simply be because the figures in the app are being rounded up or down to the nearest 0.01 whereas those in the Online account are simply being truncated with no rounding.

Which means it’s probably the case that neither of 2-DP figures from either source will be the same as the 3-DP figures.

Unless the 3rd DP was a zero - in which case then both would be the same as the 3-DP.
eg.  If the 08:00 figure shown here was actually  0.110 it would show as 0.11 whether rounded or truncated.

If the 08:00 figure was actually 0.114 then that would also show as 0.11 whether rounded (down) or truncated.

The difference between rounding and truncating will only show up if the 3rd DP was a 5 or above. (generally you round up a ‘5’)
eg If the 10:30 figure was 0.076 then rounded up it would show as 0.08 but truncated as 0.07, which is what we see happening here:


I said, Hey - Watts going on.
Firedog
Super User
Super User
August 29, 2025

I doubt that there’s any truncation going on. I just checked my own data for yesterday using the app’s Download data function and scraping the figures from the day’s online Usage table. They were identical, and the totals of both showed a difference of only .002kWh when compared to the 3dp figures retrieved via the API. partials up to .004 are rounded down, .005 and higher are rounded up.


How are you acquiring the online figures? Do you have the 3dp ones for comparison?


Noel | I have no official status; I'm just a volunteer who comes here to help other customers. My gear: Aclara SGM 1416-B Electricity-only E7 meter; Chameleon IHD3-PPMID-AAA | It may look as if I know what I’m talking about, but don’t let that fool you. |
Nukecad
Super User
Super User
August 29, 2025

As said I'm downloading from the app and copy/pasting from the online account.

I am not accessing figures to 3-DP from anywhere, I don't particularly need that level of accuracy.

If I did in future decide that I want more accuracy for some reason then I know where to get the 3-DP figures.

PS. I'm sure that on some/many days my own 2-DP numbers will be the same in both app and online charts, depending on just what the 3rd decimal was each half hour.

I said, Hey - Watts going on.