
BPLightlog
Super User
Super User
November 26, 2022
Tutorial

Energy usage data from third party Apps: Ivie, Loop and Hugo - my guide
  • November 26, 2022
  • 30 replies
  • 7943 views
Energy usage data from third party Apps: Ivie, Loop and Hugo - my guide

There are a number of third party data sets now available gathering info from smart meters so I thought I’d give a few a go to see what they offer. As has been mentioned, the OVO info screens are useful but could be enhanced but what about the others. 

Loop Homes
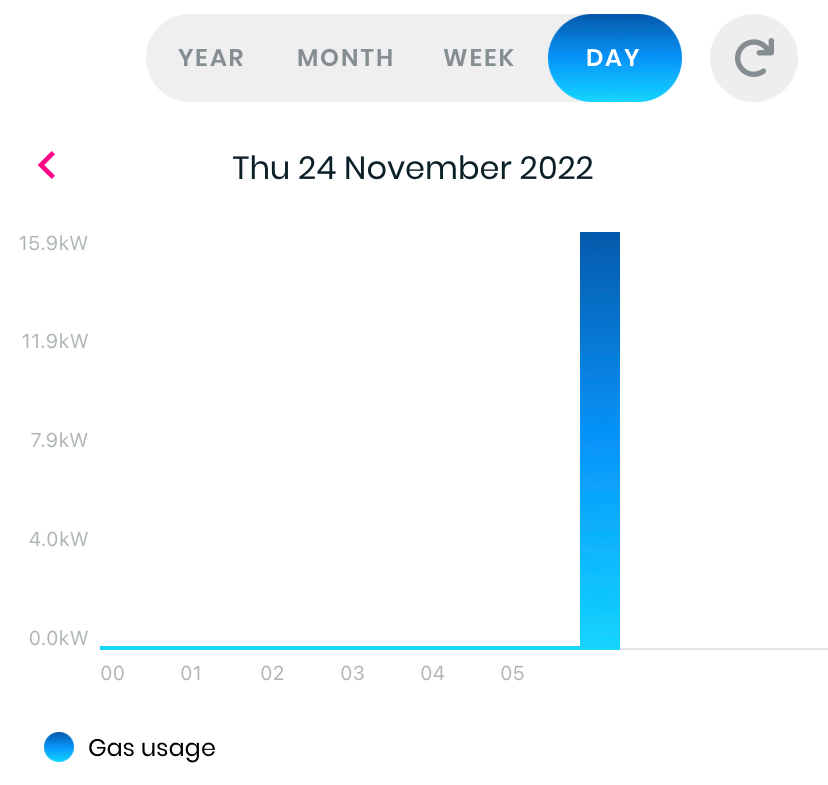
Loop - a useful and quick series of data which are updated during each day keeping track quite efficiently. This offers not much more than that apart from a solar PV and battery storage simulator but always a go-to for quick info. For some reason, gas always lags electricity by half a day or so. Loop are also running a peak hours reduction trial at present (2022-2023)  

(example screens)
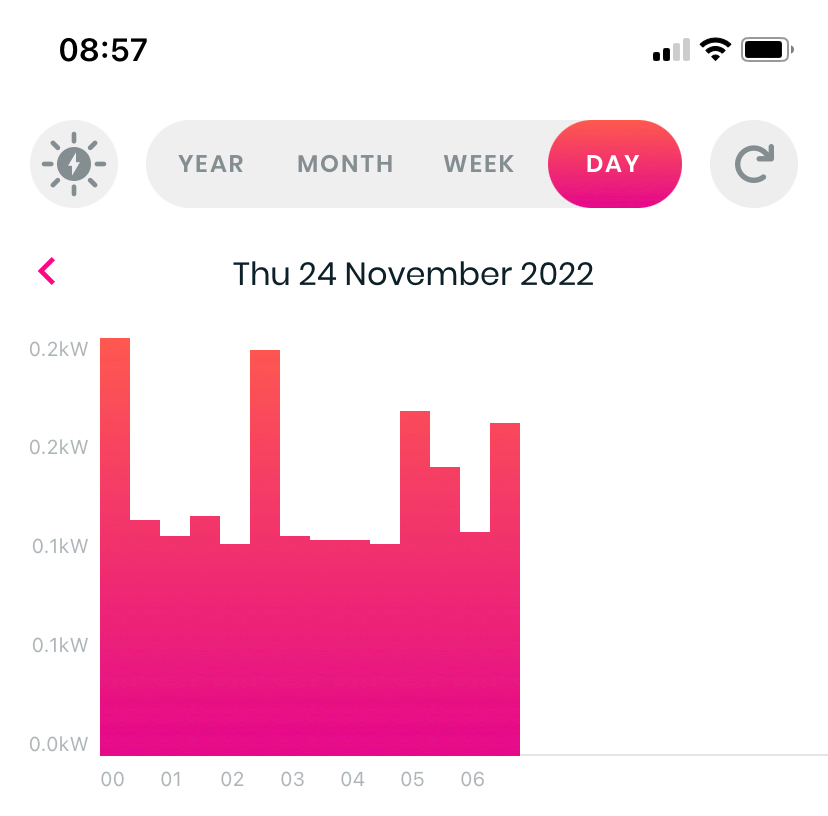
Loop does also have a solar PV and battery storage simulator which can give an idea of possible energy savings with these technologies. You can switch these on and off and also view a calculated kWh saving - however, if you already have solar panels or batteries you will get a false picture as the app doesn’t currently allow you to indicate this  
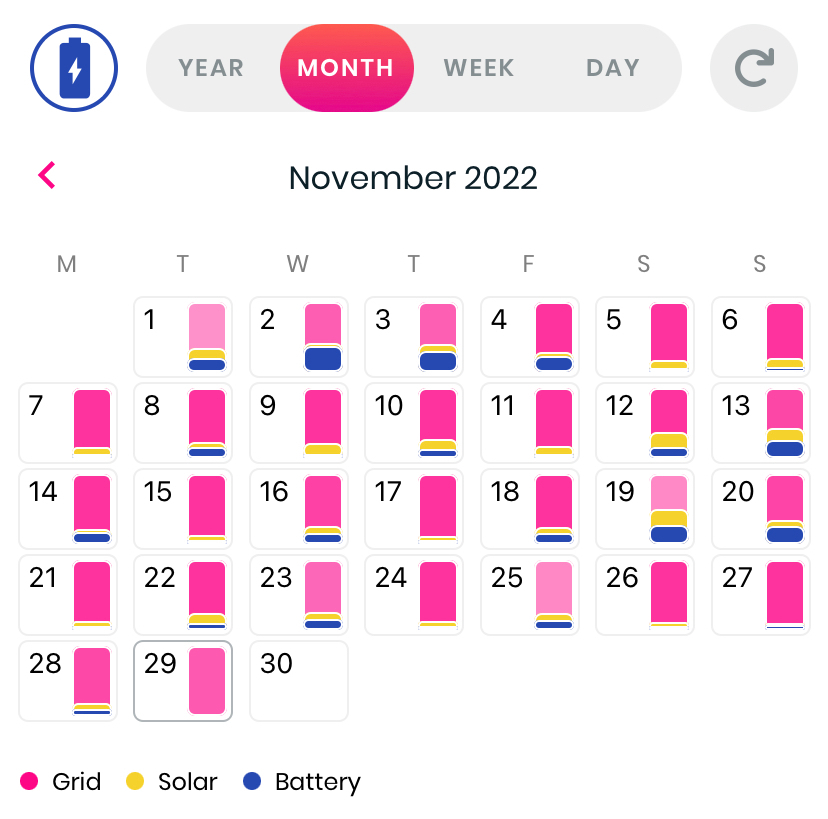
Hugo Energy

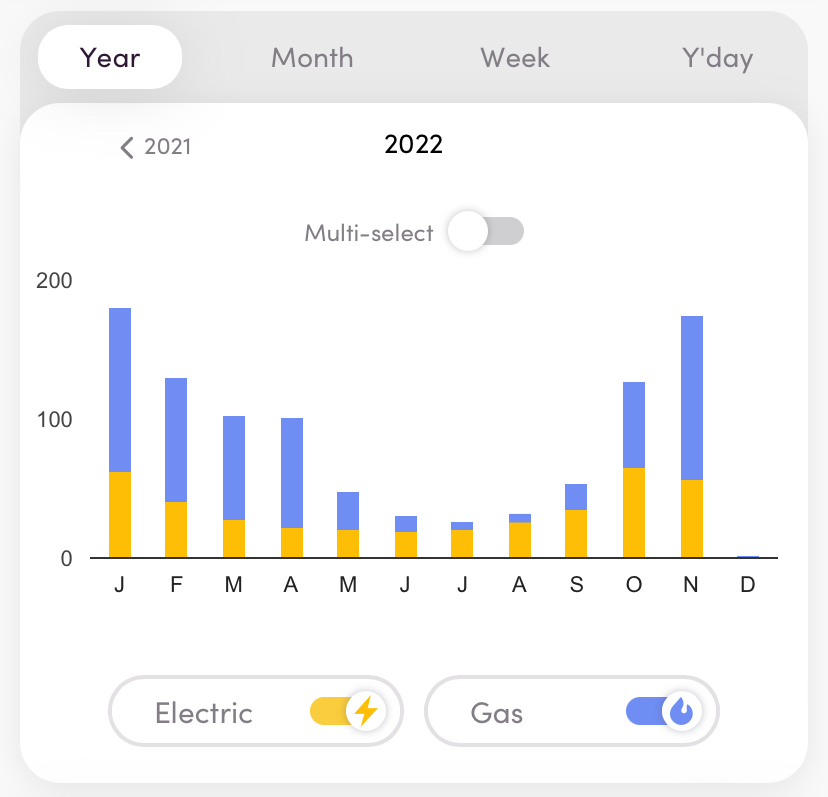
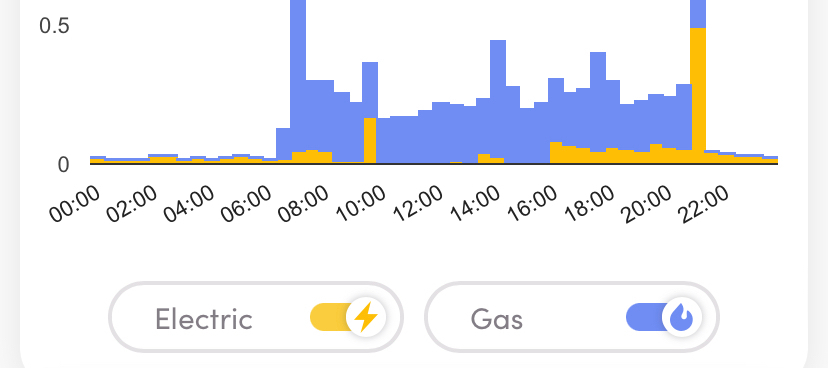
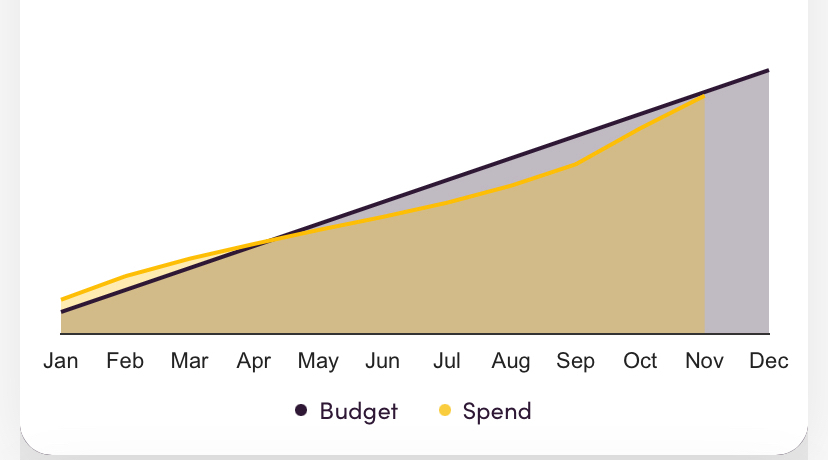
Hugo - a nice series of data screens but nothing for current day. It also has a budget tracking option to look across the year and project to year end. Good for a few different perspectives on the data. Generally always full and available the next morning 
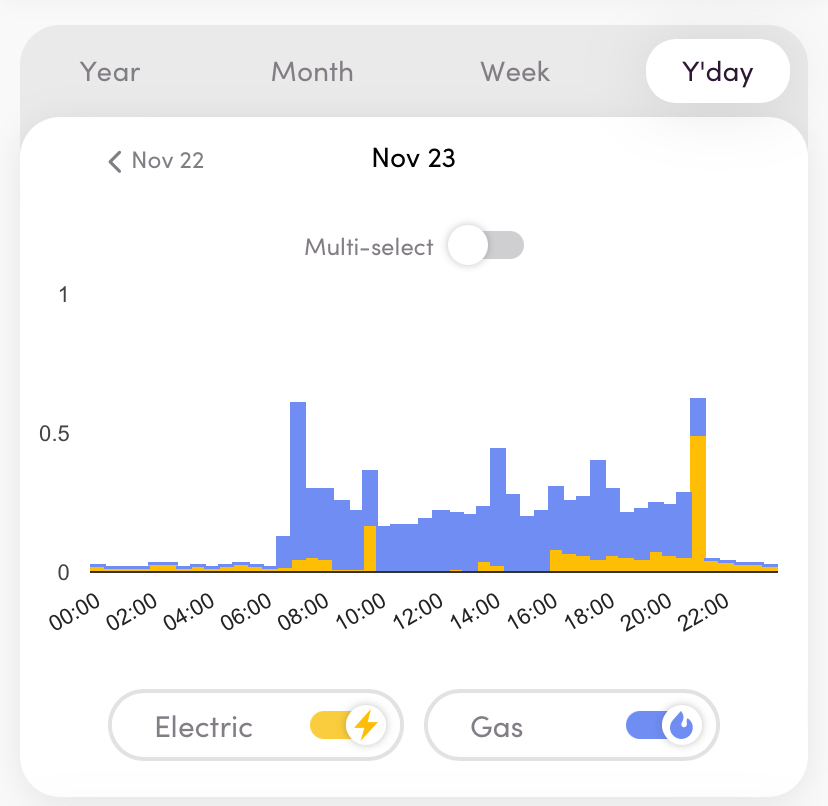
An interesting data prospect (below) looking at a track of spend to projected budget 
 

Ivie Energy

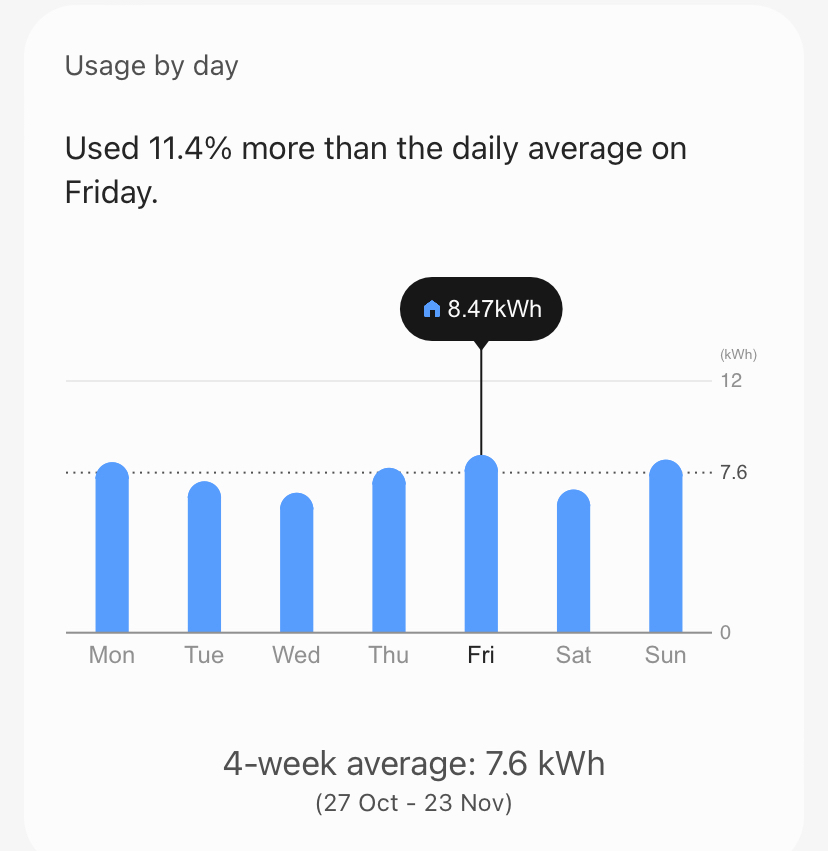
Ivie App - a newer option but currently it struggles to get data. It tends to take a day plus several hours and so it is not currently that useful although when complete, the detail on each day, week or month looks good comparing to expected use. This also has struggled to get any previous data from when initiated and so there is not much to look at currently. Hopefully this will sort itself out and also link to the ivie bud for a more complete feed. 

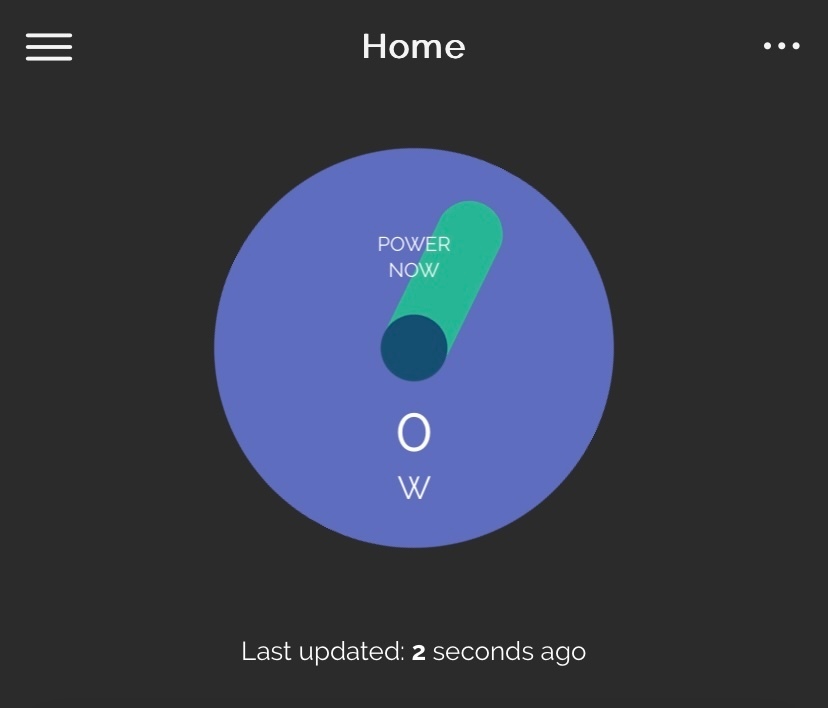
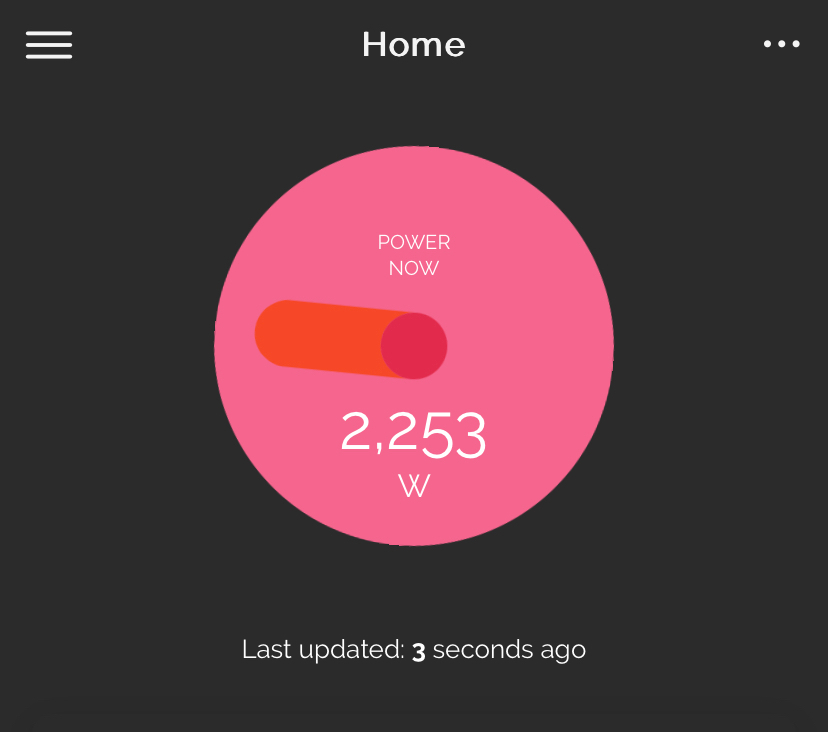
There is a live feed from the IHD to the ivie app (when working)
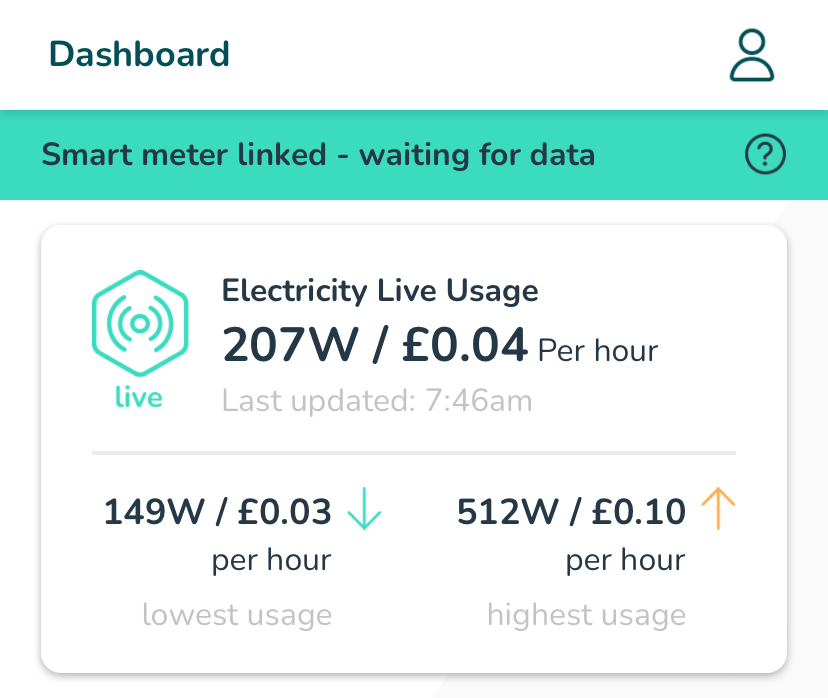
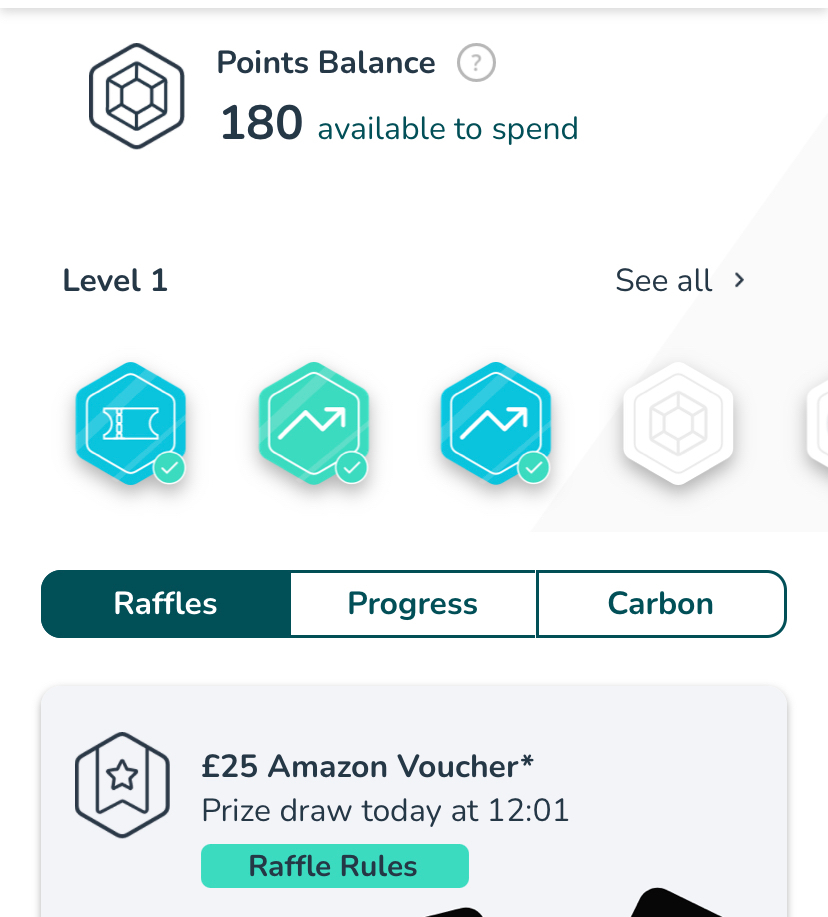
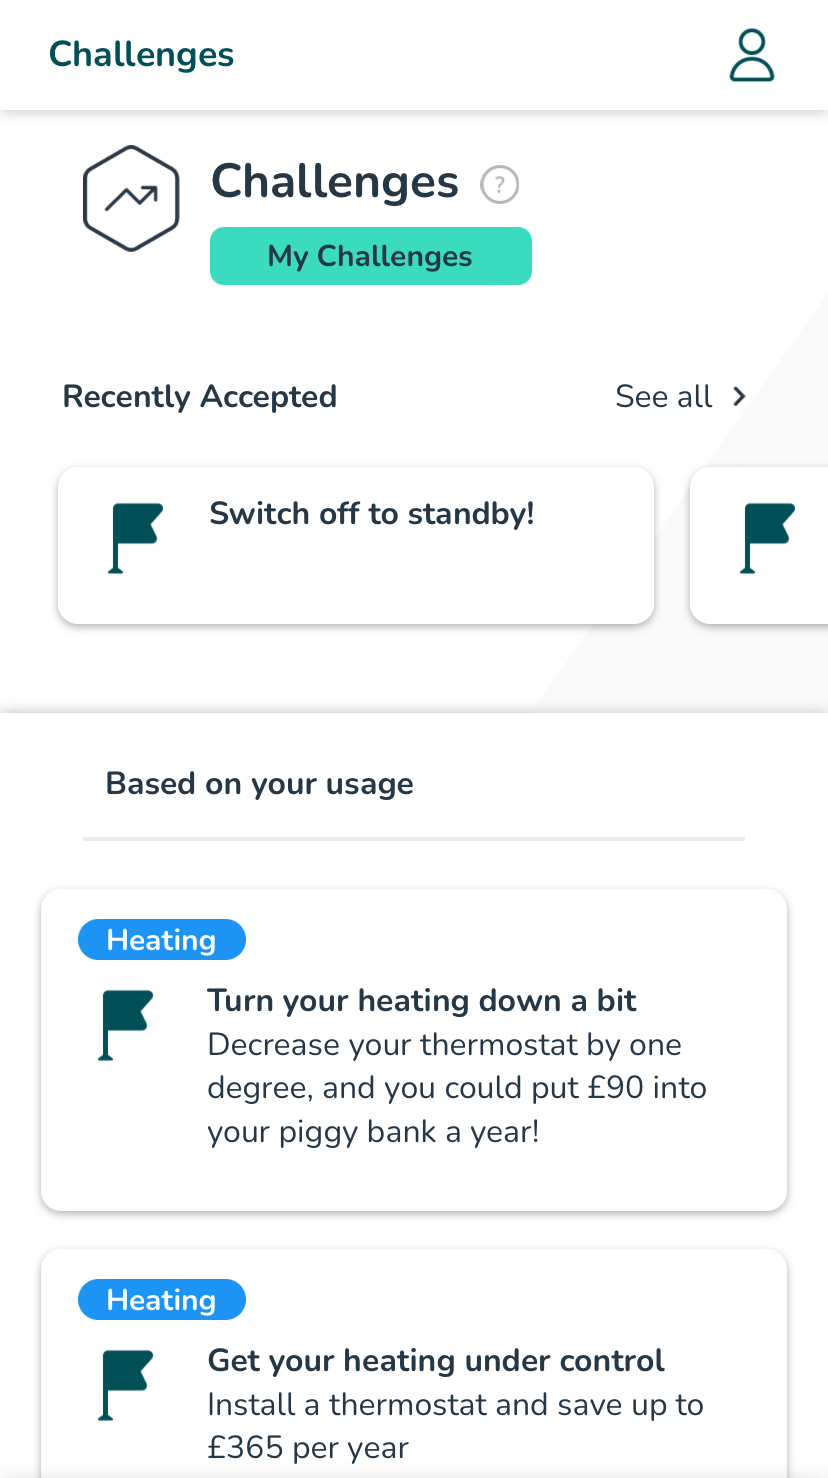
This ticks a box for something I’ve been looking for for a while. I’m still exploring but also like other parts of the dashboard with energy insights and points to be gained by accepting and completing energy saving challenges 
 

There is also a link to SmartThings which has various other options to monitor home appliances, lighting, cameras, smart plugs and other connected devices Currently this looks useful to view high usage slots within a week and even day.
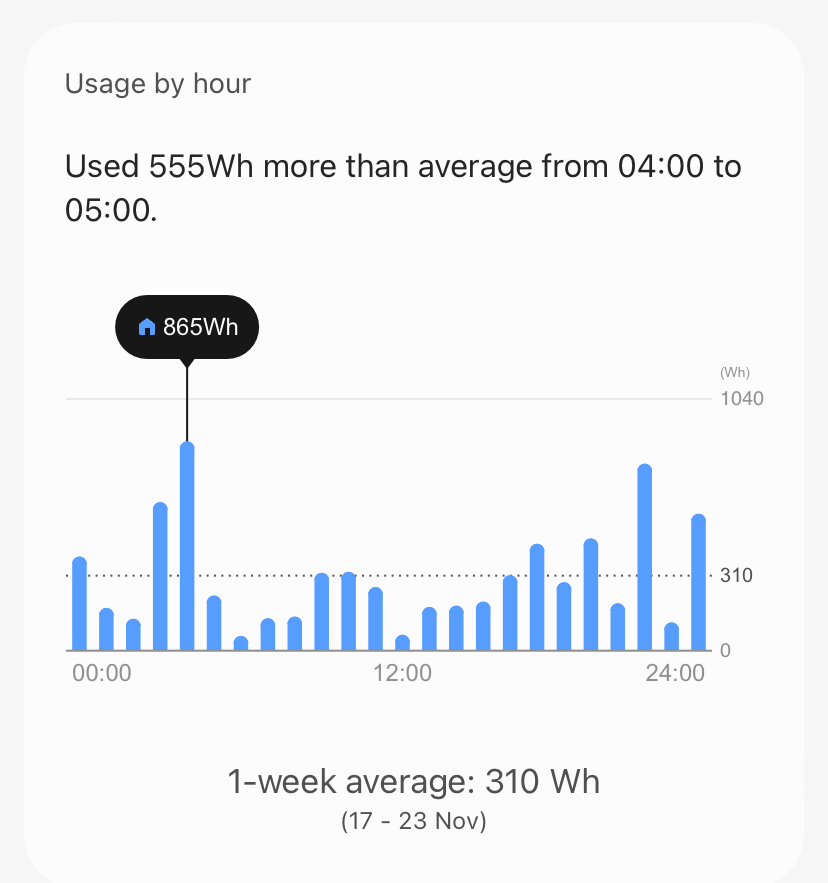
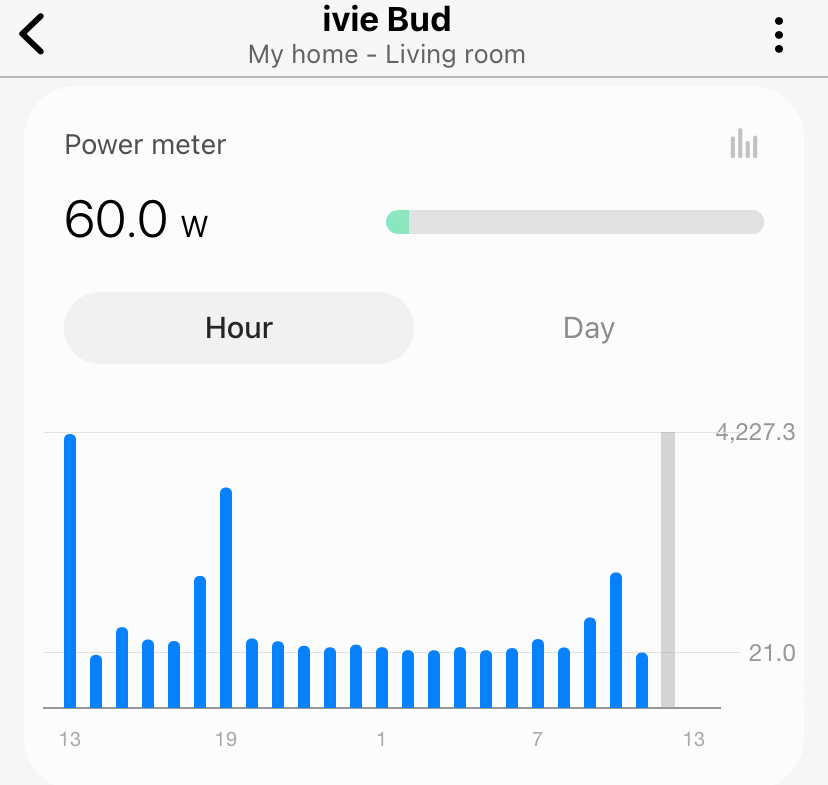
There’s also an hourly feed from the links with chameleon and ivie bud which scrolls through the hours giving an instantaneous reading and a more complete day’s view 

Bright / Hildebrand

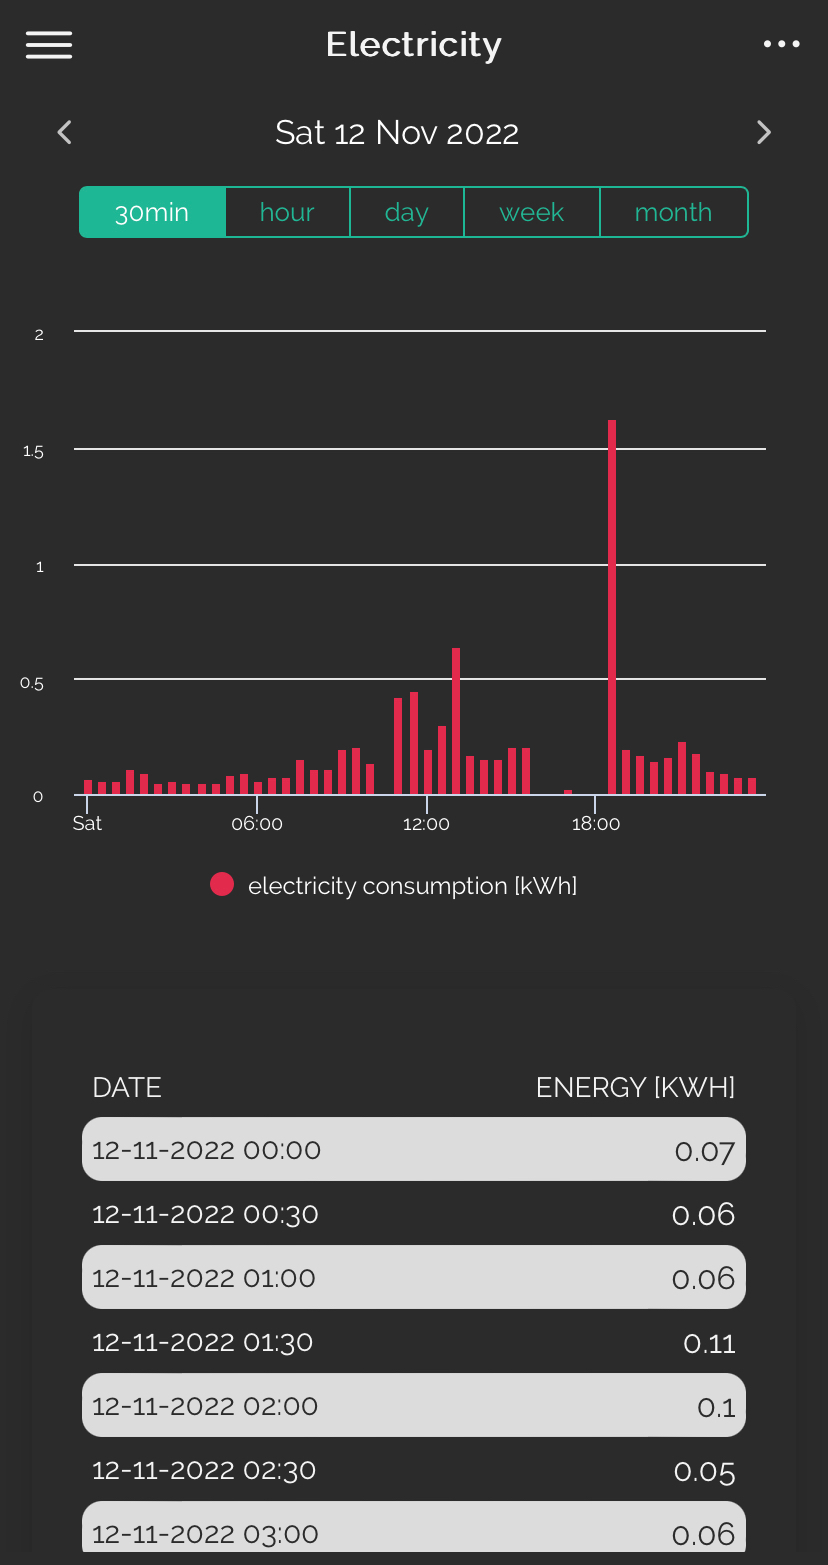
Another app which also offers its own display (to purchase) and link to some useful current data. Although the front dashboard is active for the day, it is very text heavy which in my personal view is not as easy to read.
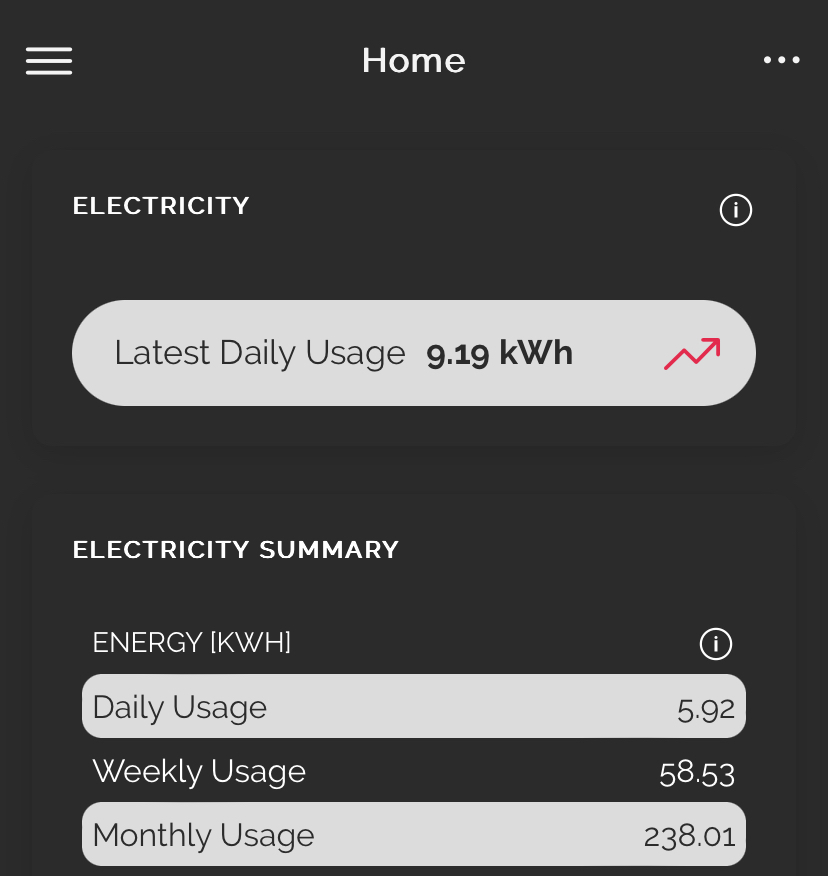
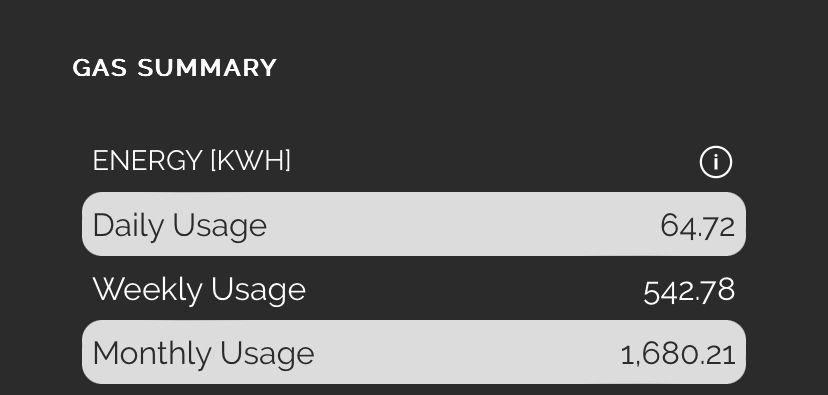
The rest of the information is very good, giving graphical representations of data daily, weekly and monthly and also available as hourly and half-hourly views. 
The most useful of these is a comparison view so that the user can judge their use from previous records
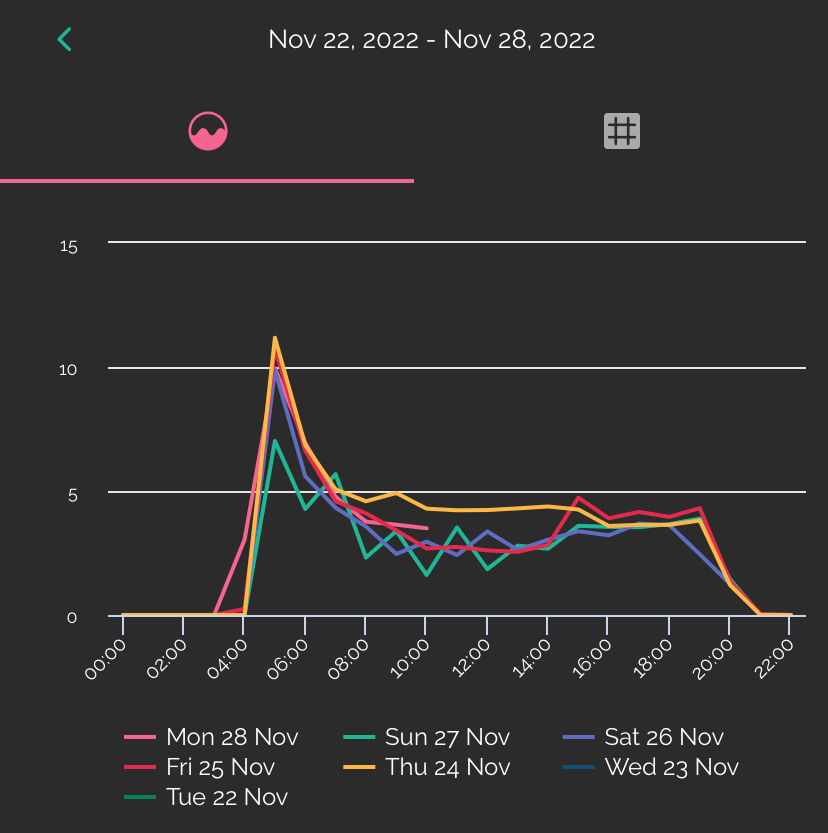
Update: not well documented but there are options on the Bright data screens to zoom in by pinching the screen on a mobile or tablet in the normal way which can help to look at specific time slots more closely. Also I have recently discovered that you can switch off a days data on the comparison screen by clicking on the key dates  - this is an extra useful feature when comparing days against each other like this 
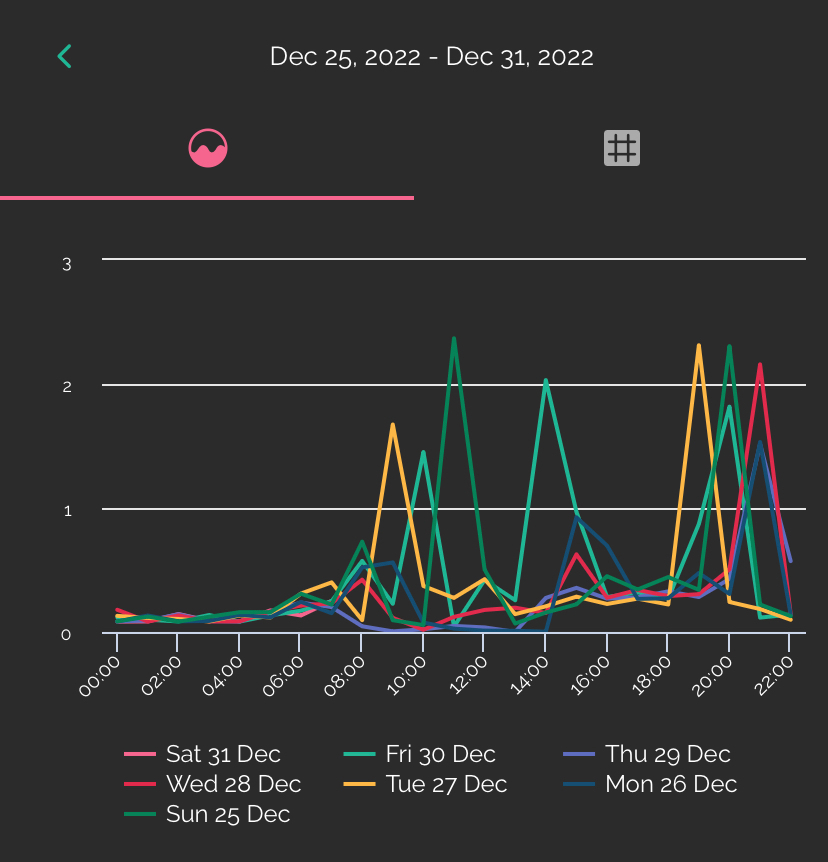
A complete week in comparison view 
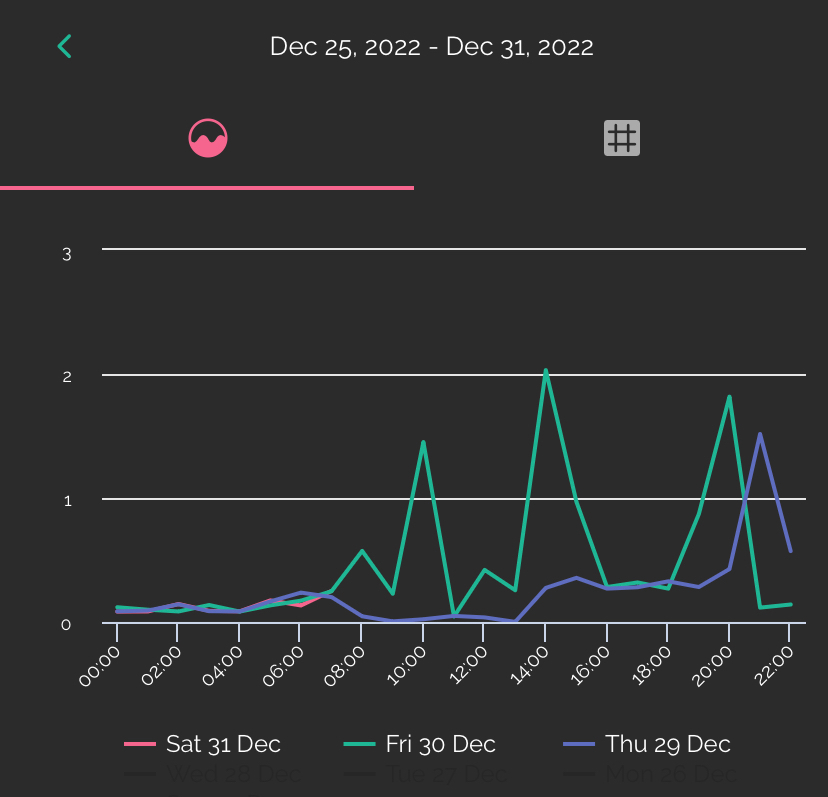
Reduced days in comparison view

Bright also have an IHD which I’ve just acquired. It looks like it gives a great deal of extra information, links to the Bright app and gives a graphic display of instantaneous use. It also feeds a minute feed to the Bright app graphics which I will report on shortly. 

Note : Using several of these at once appears to bring some sort of conflict in data acquisition but the whole area of gathering and displaying data is currently in its infancy therefore I would expect it to become a comprehensive offering in the next few years .. perhaps even integrated into the offering from your energy supplier.


30 replies

BPLightlog
Super User
Super User
July 7, 2023

Are any of the apps able to display the Export figures from a Smart Meter?

An associated question is which companies pay SEG payments by reading the Smart Meter directly? I believe Octopus does, but all the rest seem to need manual readings to be submitted, which seems rather backward to me.

Theoretically yes but this needs to be enabled from the meter via SMHAN (so I’m told).

Having said that, I’ve never seen this myself in any of the data feeds so far. There are other questions on this on the Glowmarkt forum (data from the Bright app)

https://forum.glowmarkt.com/index.php?p=/discussion/106/export-meter-reading
(you might need to create an account to view)


For the SEG data, I’m not sure which companies use a direct feed. I know that for FIT, the generation reading is needed, hence a manual reading from a separate generation meter

Bring me Sunshine ~ E&E {Solar PV, Battery Storage, Hybrid EV, ASHP and Home Assistant automation}
Rank 2
May 21, 2024

Ovo app & online, not getting daily meter readings, unable to submit manually, only getting half hourly useage.

Also third party apps (loop & Hugo) unable to read electric meter data, both third parties say it’s ovo’s responsibility to make the meter accessible, but ovo deny this or don’t realise their responsibilities ! 
 

Firedog
Super User
Super User
May 21, 2024

No-one can see your meter readings other than OVO and you (or anyone else looking at the meter). Usage data is a different matter; anyone you give permission to (e.g. Loop and Hugo) can access these data via the DCC. 

You say you’re not seeing daily readings on your account; is this a new thing, or have you never been able to see them? 

You say you’re not able to submit readings; the latest version of the app (I think v.19.2.0 CP 464) has moved the page a bit. You now have to click on the little person icon in the top corner to access what used to be the Account option on the bottom navigation bar.  

The more information you give us, the more likely it is that we’ll be able to help, or at least point you in the right direction.

Noel | I have no official status; I'm just a volunteer who comes here to help other customers. My gear: Aclara SGM 1416-B Electricity-only E7 meter; Chameleon IHD3-PPMID-AAA | It may look as if I know what I’m talking about, but don’t let that fool you. |
Rank 2
May 21, 2024

Yes I’m up to date with the new app, an error comes up when I try to submit manual readings, plus my daily meter readings are not showing in the app, ovo say they have them but the app is down ?  for the last 5 years I’ve been able to see the daily meter reads.

The third party apps both supply half hourly useage for gas and electricity, March the 19 both third parties stopped being able to prompt the electricity meter for data, I have spoken to them on various occasions and I will paste one of the replies from loop.


Hi Simon​, 


Thank you for your response and I understand your frustration especially when energy companies are meant to manage smart meters correctly as a DCC licensee. 


It is worth knowing that your energy supplier is signed up to the Smart Energy Code and its objectives so where data is not made available including for third party services, they will need to be compliant under this objective: 


"Enable the DCC to comply at all times with the objectives of the DCC licence and to discharge the other obligations imposed upon it by the DCC licence". Refer to: What are the SEC objectives?


The best course of action would be to tap on this link and to find out whether logging a complaint to the Energy Ombudsman is the best option for you: Making a complaint about your energy supplier or network operator


I hope this information helps. 


Firedog
Super User
Super User
May 21, 2024

OK. There’s clearly something amiss with your account, so a chat with Support may help to find out what’s wrong. 


Noel | I have no official status; I'm just a volunteer who comes here to help other customers. My gear: Aclara SGM 1416-B Electricity-only E7 meter; Chameleon IHD3-PPMID-AAA | It may look as if I know what I’m talking about, but don’t let that fool you. |
Rank 2
May 21, 2024

I have been asking support for help over the last month to no avail, hence this posting, I’m fed up with the lack of enthusiasm to resolve the issue! 
they can see my meter readings but I can’t, I even had one handler ask for meter readings so they could put them on, how does that work seeing they already have the readings! 

Chris_OVO
Community Manager
Community Manager
May 22, 2024

Hi @Simon.p


I’m sorry to hear you’re having issues with your readings. I would echo what @Firedog has said and advised speaking directly with our Support Team. As we don’t have access to accounts it’s hard for us to know what is directly causing this. 


If you don’t feel that the issues have been resolved to your satisfaction we also have a complaints process you can follow. You can find our Complaint Handling Statement here, https://bit.ly/3DcsZdj, along with more information on our complaints process here: https://www.ovoenergy.com/feedback.

Renewable energy jokes never get old.
Newcomer
August 27, 2024

I used Hugo but it's worth noting that the day data shows kW used in a half hour period. If you want to see the rate of use (i.e. kWh) then you need to double this. To see what I mean take the total energy used in a day and divide by 24 hrs. You'll see that the result is twice the average shown on the graph for that day.

KW per half hour is a funny measure to chart.

Also if you want to analyse energy use for a specific period  (e.g. a cold spell in February) you have to scroll back day by day.

Hugo Pro, now available for a small subscription, has more functionality but you need to have several “green” systems (e.g. ASHP, PV, battery, EV) or several properties, or want to download for analysis, to make it worth subscribing.

Otherwise good for storing and accessing data plus viewing use on regular basis.

Rank 2
September 19, 2025

Hi,

I’ve got two days recently where the half hourly data is missing (I see the first hour and the rest of the days are missing (they aren’t consecutive days) .
This data is visible in 3rd party apps - so it clearly has been collected and made available.

I suspect this relates to the data collection scheme used by OVO - eg the number of failed attempts to collect the data before it gives up.

It’s not a big issue in the grand scheme of things but it’s a bit frustrating if you are participating in Power Move type events and this isn’t recorded - 

Does anyone have any experience of this issue ?
Is it possible to get this data re-collected ?


Thanks !


Firedog
Super User
Super User
September 19, 2025

Just to say you’re not alone. My online account is missing the half-hourly usage data from 10 and 15 September, even though they’re available via third-party ‘other user’ utilities. If they’re not in the online account, I presume they’re invisible to Power Move as well.

Have you asked Support to help retrieve them? How did that go?

Noel | I have no official status; I'm just a volunteer who comes here to help other customers. My gear: Aclara SGM 1416-B Electricity-only E7 meter; Chameleon IHD3-PPMID-AAA | It may look as if I know what I’m talking about, but don’t let that fool you. |