




Tim_OVO
OVO Staff
OVO Forum Legend
March 18, 2024
News

Power Move - spring challenge

  • March 18, 2024
  • 98 replies
  • 2962 views
Power Move - spring challenge

Find out more and sign up today


The Power Move spring challenge is now open - and you can sign up today. The challenge is to use 14.00% or less of your home’s total electricity between 6pm and 9pm, Monday to Friday. Your reward? Up to £10 per month energy bill credit.
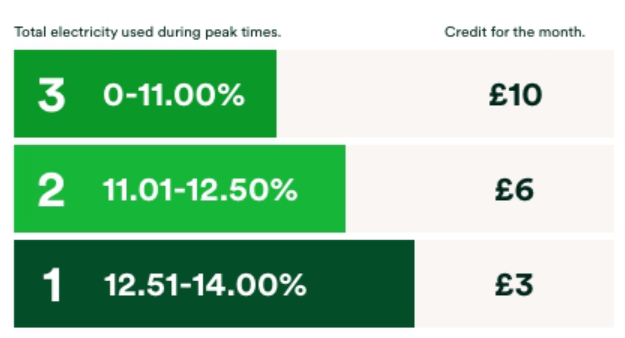


Why we’ve adjusted the peak times from 4-7pm to 6-9pm.


Peak times change throughout the year. During winter they’re between 4-7pm. In the summer months, we use energy slightly later - meaning the peak times are typically later.


Remember - If you’ve already joined a challenge we’ll now automatically add you to the next challenge and any future challenges. So you don’t need to remember to join any future challenges to enjoy the benefits of Power Move.


Join the Power Move challenge today


What are your top tips for reaching the Power Move target for people who are new to Power Move?

98 replies

Tron Burgundy
Rank 4
Rank 4
May 4, 2024
The peak time percentage calculator I wrote worked for the time change.  yay.


Newcomer
May 6, 2024

Hi

I'm trying to sign up for power move, but the website says "We're working on a new website for you". It's been like that for 24 hrs. Is it down, or is the link from the email incorrect?

Blastoise186
Super User
Super User
May 6, 2024

Hi

I'm trying to sign up for power move, but the website says "We're working on a new website for you". It's been like that for 24 hrs. Is it down, or is the link from the email incorrect?

Sorry, but that means you’re not eligible at this time.

Securing energy by zapping security bugs... For that is The Blastoise Way! Remember, I'm just like you - AI Powered Evil Geniuses aren't Staff!
Newcomer
May 6, 2024

Hmm, bit weird that I got sent the email then if I'm not eligible.

Newcomer
May 11, 2024

Did I miss the time change being mentioned clearly in an email before now? I will have to be very careful now to get back on track!

Newcomer
May 13, 2024

Hi All,


Since I got my smartmeter I signed up for the ½ hrly readings from n3rgy and I’ve put them on a Google sheet here.

https://docs.google.com/spreadsheets/d/1YOmmK5rd48bd6jzCjHSdziB46o_AdBiByOZqAzX1GmM/edit?usp=sharing

Got a £0.48 credit for the last bit of April, so far I make the readings

Total Powermove (From April 30th)

     
Total Electricity 45.928    
Weekday 34.381    
Powermove 3.475   10.11%
       
April (Eligible)      
Total Electricity 4.398    
Weekday 4.398    
Powermove 0.108   2.46%
       
May      
Total Electricity 41.53    
Weekday 29.808    
Powermove 3.367   11.30%


The e-mail for Powermove was dated the 30th, so I presume that’s when I signed up, Ovo makes the April usage 2.52%.


Our electricity usage is fairly normal year round (3k kilowatt hours or so) but my other half works overnight from home and we have solar panels and a battery, which has charged up every day so far during the challenge. So we’re VERY seasonal.

A few questions - Does 27/04/2024 00:00 count as a weekday or weekend timestamp ? (Saturday midnight).

Also am I right in recording 


29/04/2024 18:30
29/04/2024 19:00
29/04/2024 19:30
29/04/2024 20:00
29/04/2024 20:30
29/04/2024 21:00


as “Powermove” eligible or should it be 18:00 to 20:30 ?

Also is the challenge monthly or overall ? I presume monthly seeing as I already received the April credit.


Comically I might have to stick the tumble dryer on overnight in June to get the non powermove usage up to get below 11% if we have sunny weather  xD


Nukecad
Super User
Super User
May 13, 2024

Hi @Pulpstar 

The figures given for the half-hourly time slots are the start of the slot.
So the current Power Move slots are the ones that start 18:00 to 20:30.

Each Power Move ‘reward period’ lasts for a calendar month, then you start at zeros again on the 1st of the next month.

eg. I copy/paste my half hourly figures from my online account into my own spreadsheet, and have the relevant rows highlighted as below.
You can see that on these days I cooked my evening meal in the 17:00 and 17:30 timeslots, so just before the Power Move hours..
 

Note that if you copy/paste from the account like that then the usage figures are only to 2-DP and not the 3-DP you get with an app.
That 2-DP is still close enough, unless you are right on a target borderline.
The usage figures also copy in in the form of '0.2 kWh', after copying them in I simply do a replace-all of 'kWh' with blank so that my spreadsheet then recognises them as numbers not text and calculates the totals and percentage.

I do totals and percent for each day - and then running totals/percent for the month so far, like this:


PS. An off peak idea/tip that I'm already using myself -
Late evenings and early mornings can still be chilly in summer, instead of putting the heating on for the whole house a 1-kW fan heater can provide a quick/focused boost of heat for half an hour or so, which can be cheaper than heating the whole house, and also contibutes 0.5 kWh to your off peak Power Move for each half hour that you use it.

I said, Hey - Watts going on.
Newcomer
May 13, 2024

Thanks,


Weirdly those times correspond to for instance 

30/04/2024 17:30
30/04/2024 18:00
30/04/2024 18:30
30/04/2024 19:00
30/04/2024 19:30
30/04/2024 20:00


on the n3rgy timestamps - but I think you’re right as the 2.52% as calculated for April 30th does match OVO exactly now.


The good news is I’m at 8.74% for the month, will be able to check my worksheet further when the halfway email rolls in from Ovo.

Firedog
Super User
Super User
May 13, 2024

… the n3rgy timestamps -


Beware of timestamps when dealing with energy! The entire industry works on UTC (AKA GMT) all year round. I just downloaded some data (for 1 May) from n3rgy to see what it looks like, and compared with what I usually get from Guy Lipman’s site:


You’ll notice several differences:

  • n3rgy set the timestamp at the end of the period it refers to, while Lipman (and OVO and most others handling this sort of data) stamp with the time at the start of the period.
  • To get a full day’s data for Power Move and similar purposes, you have to take the 48 n3rgy figures starting at 00:30. Lipman stamps them appropriately, but there are two figures at the top of the column that belong to the previous day when using UTC. 
  • If you ask for a single calendar day’s figures (like I did for this exercise), n3rgy return nothing at all, while Lipman is missing the last hour’s data. To get all the data you need, select the day itself and the following one, then be careful when selecting the figures you want.
  • The current Power Move target period is, as you worked out, is the block labelled 17:30 - 20:00 by n3rgy.
  • OVO’s own usage data on the Day tab don’t match either of these variants. They use an ugly fudge to fit a day’s UTC data into a BST calendar day, so the figures (and the bar in the chart) you see for 12:00am and 12:30am in fact show the usage for the last hour of the day. The ones that should be there are the ones at the end of the previous day’s chart. This makes little difference for most customers - consumption is usually light and pretty consistent from day to day. A few will be surprised, though.
  • If all you need to know is how well you’re doing in the Power Move challenge, you could try Tron Burgundy’s excellent little bookmarklet in a browser that will allow it to run. This is what it showed me just now:
      
     
    The results match my own precisely, with one exception: in April, there was one day when my usage data didn’t turn up until in the evening, so this day’s data were disregarded. This in fact worked in my favour.


Noel | I have no official status; I'm just a volunteer who comes here to help other customers. My gear: Aclara SGM 1416-B Electricity-only E7 meter; Chameleon IHD3-PPMID-AAA | It may look as if I know what I’m talking about, but don’t let that fool you. |
Newcomer
May 30, 2024

Thanks, the calculator is extremely useful. Using it in combination with the NRG data and my solar app to “look ahead” and see how likely it is I can make the challenge (The sun coming out tends to help :D)
Also going to use the NRG data and a certain other errm…. ‘tentacled’ competitor to see how their movable feast of tariffs compares against Octopus for a year whilst I’m on this tariff overall.
