

Peter E
Super User
Super User
October 24, 2023
Solved

Partially scrambled half hour data- Got an EV

  • October 24, 2023
  • 12 replies
  • 357 views

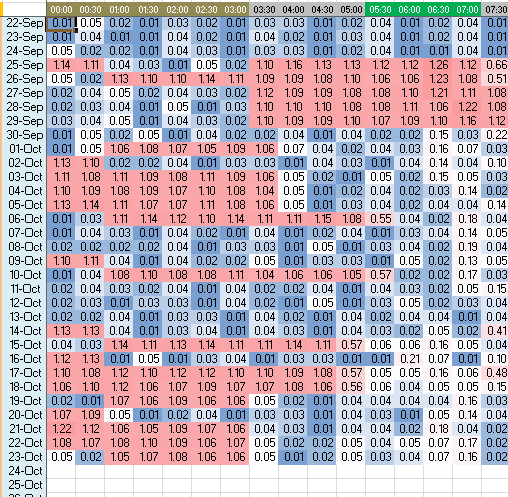
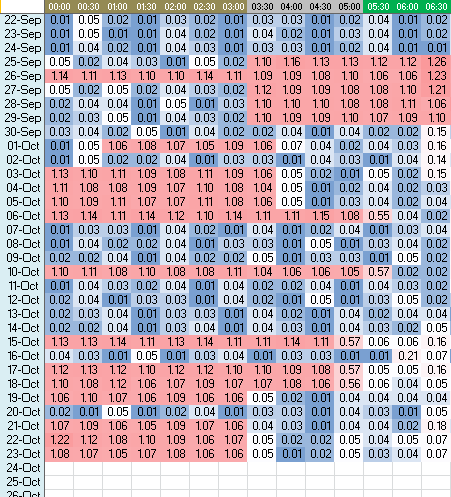
I have an EV and I monitor the energy that the car uses. I created a spreadsheet with the date down the side and half hour periods across the top and colour coded the energy usage with conditional formatting to show high energy usage at red and low as blue. I then noticed that  the data for the first two half hour periods is displaced one day earlier than it should be.

The two screenshots show the data as supplied and then how it should look. None of the timers on the car start or finish at 01:00. Generally the timers are set for 22:00 to 03:30 which is 5.5 hours of charging. The text messages I get from Renault do not show charging stopping or starting at 1am (02:00 CET). They show continuous charging from 23:00 (CET) to 04:30 (CET).

There is also at least one example where even the displaced charging data (1 hour) is completely missing.  If the billing accurately reflects the data then I’m also not being charged for that.

I didn’t set out to check the accuracy of the data. I did it to monitor how I was progressing on the Power Move Challenge which is going quite well and then I noticed this.


Has anyone else noticed this behaviour?


Peter


PS If you are wondering how the data can be displaced 1 day earlier (which seems to imply time travel is possible) then I’ve noticed sometimes that when I look at the data I get the first two half hour values from today before the rest of the data from yesterday appears. To say this in more detail: If it is the 21st, in the afternoon, I get the first two HH period data (from the 21st) and then a bit later on I get the other 46 HH data from the 20th which is appended to the data from the 21st.


PPS I’m now wondering if this is due to Daylight saving Time and it will magically unscramble itself when the clocks change shortly.
 

Best answer by Firedog

You’re not alone in struggling with the timings of half-hourly (Hh) data. The problem is that the electricity industry works always on UTC (GMT), while people in real life work on local time, currently BST (GMT+1). Depending on where the data come from, they may or may not have been adjusted for the difference. 

The OVO ‘Day’ Usage page is adjusted, so the times shown are local (BST). This leads to strange things at the start and end of BST, as you’ll probably see if you look up the page for  26 March 2023 (I say ‘probably,’ because I’m not certain that every smart meter is configured in the same way as far as this is concerned). 

I too try to track my Hh figures, but I find it easier to piggyback on one of the third-party data aggregators to get them. I use n3rgy, by way of Guy Lipman’s excellent utilities. Here’s what the CSV for the same timezone change look like, C&P from Excel:

Period
UTC
Date
local
StartTime
local
Timezone
Adj
Quantity
(kwh)
25/03/2023 23:00 25/03/2023 23:00 0 0.091
25/03/2023 23:30 25/03/2023 23:30 0 0.080
26/03/2023 00:00 26/03/2023 00:00 0 0.087
26/03/2023 00:30 26/03/2023 00:30 0 0.130
26/03/2023 01:00 26/03/2023 02:00 1 0.094
26/03/2023 01:30 26/03/2023 02:30 1 0.088
26/03/2023 02:00 26/03/2023 03:00 1 0.073
26/03/2023 02:30 26/03/2023 03:30 1 0.046


It’s probably best to be consistent by sticking to UTC everywhere. If there are any gaps in the DCC data (e.g. during a power cut), these are flagged on Lipman’s Admin page.

I can’t explain why you’re seeing displacements by a whole day, and can only suspect that something went wrong when transferring figures from your source to the worksheet. There is, of course, the confusion at the OVO account site where meter readings are variously timed at the midnight (UTC) at the start or the end of the day they’re labelled with.


As regards @Jeffus’ remark about whether there’s a difference between a day’s consumption as measured by differencing meter readings on the one hand and summing Hh data on the other, I can only say that the last couple of weeks’ data for my new meter differ at most by 1Wh on any day, and by 1Wh for all the days. This is clearly not significant. There is, however, a tiny but significant difference between the peak and offpeak totals for each day, with the peak totals over-reported (and offpeak under-reported) by an average of about 3Wh each day. I give the supplier the benefit of the doubt here, guessing that the difference arises from the difference in reporting times of the Hh data on the one hand and the register readings on the other. If I’ve done my sums properly, 3Wh corresponds to about 4 minutes by which the offpeak period is under-reported, i.e. about 0.9%. It’s neither here nor there for a customer like me, but it all adds up - in OVO’s favour - if this scenario is repeated for every E7 customer. I wonder if settlement depends on the same data timings. 


12 replies

Peter E
Super User
Peter ESuper UserAuthor
Super User
October 28, 2023

Rather than waiting for Sunday I went and retrieved some data from earlier in the year and it is definitely a UTC/BST issue. You can see the anomaly appears after the 26th March. The blank lines are missing data. At least I can work out where the data is now.


Reducing my yearly fossil fuel usage with an EV (-900 litres petrol), A2AHP (-8,700 kWh gas) and Timed Immersion heater (-1,500 kWh gas)
Firedog
Super User
Super User
October 28, 2023

Nice! 

The missing data for the end of the quarter was a long-term known issue, which has now been resolved, we’re told. It’s anyone’s guess why you’re missing data for 15 April, though. But your displaced pink cells appear to illustrate the problem very effectively. Thanks!

Noel | I have no official status; I'm just a volunteer who comes here to help other customers. My gear: Aclara SGM 1416-B Electricity-only E7 meter; Chameleon IHD3-PPMID-AAA | It may look as if I know what I’m talking about, but don’t let that fool you. |