
Unexplained half hourly usage pattern

  • April 29, 2026
  • 63 replies
  • 456 views

My 88 year old Mother, lives alone and spends most of the night awake watching TV, drinking tea, etc.

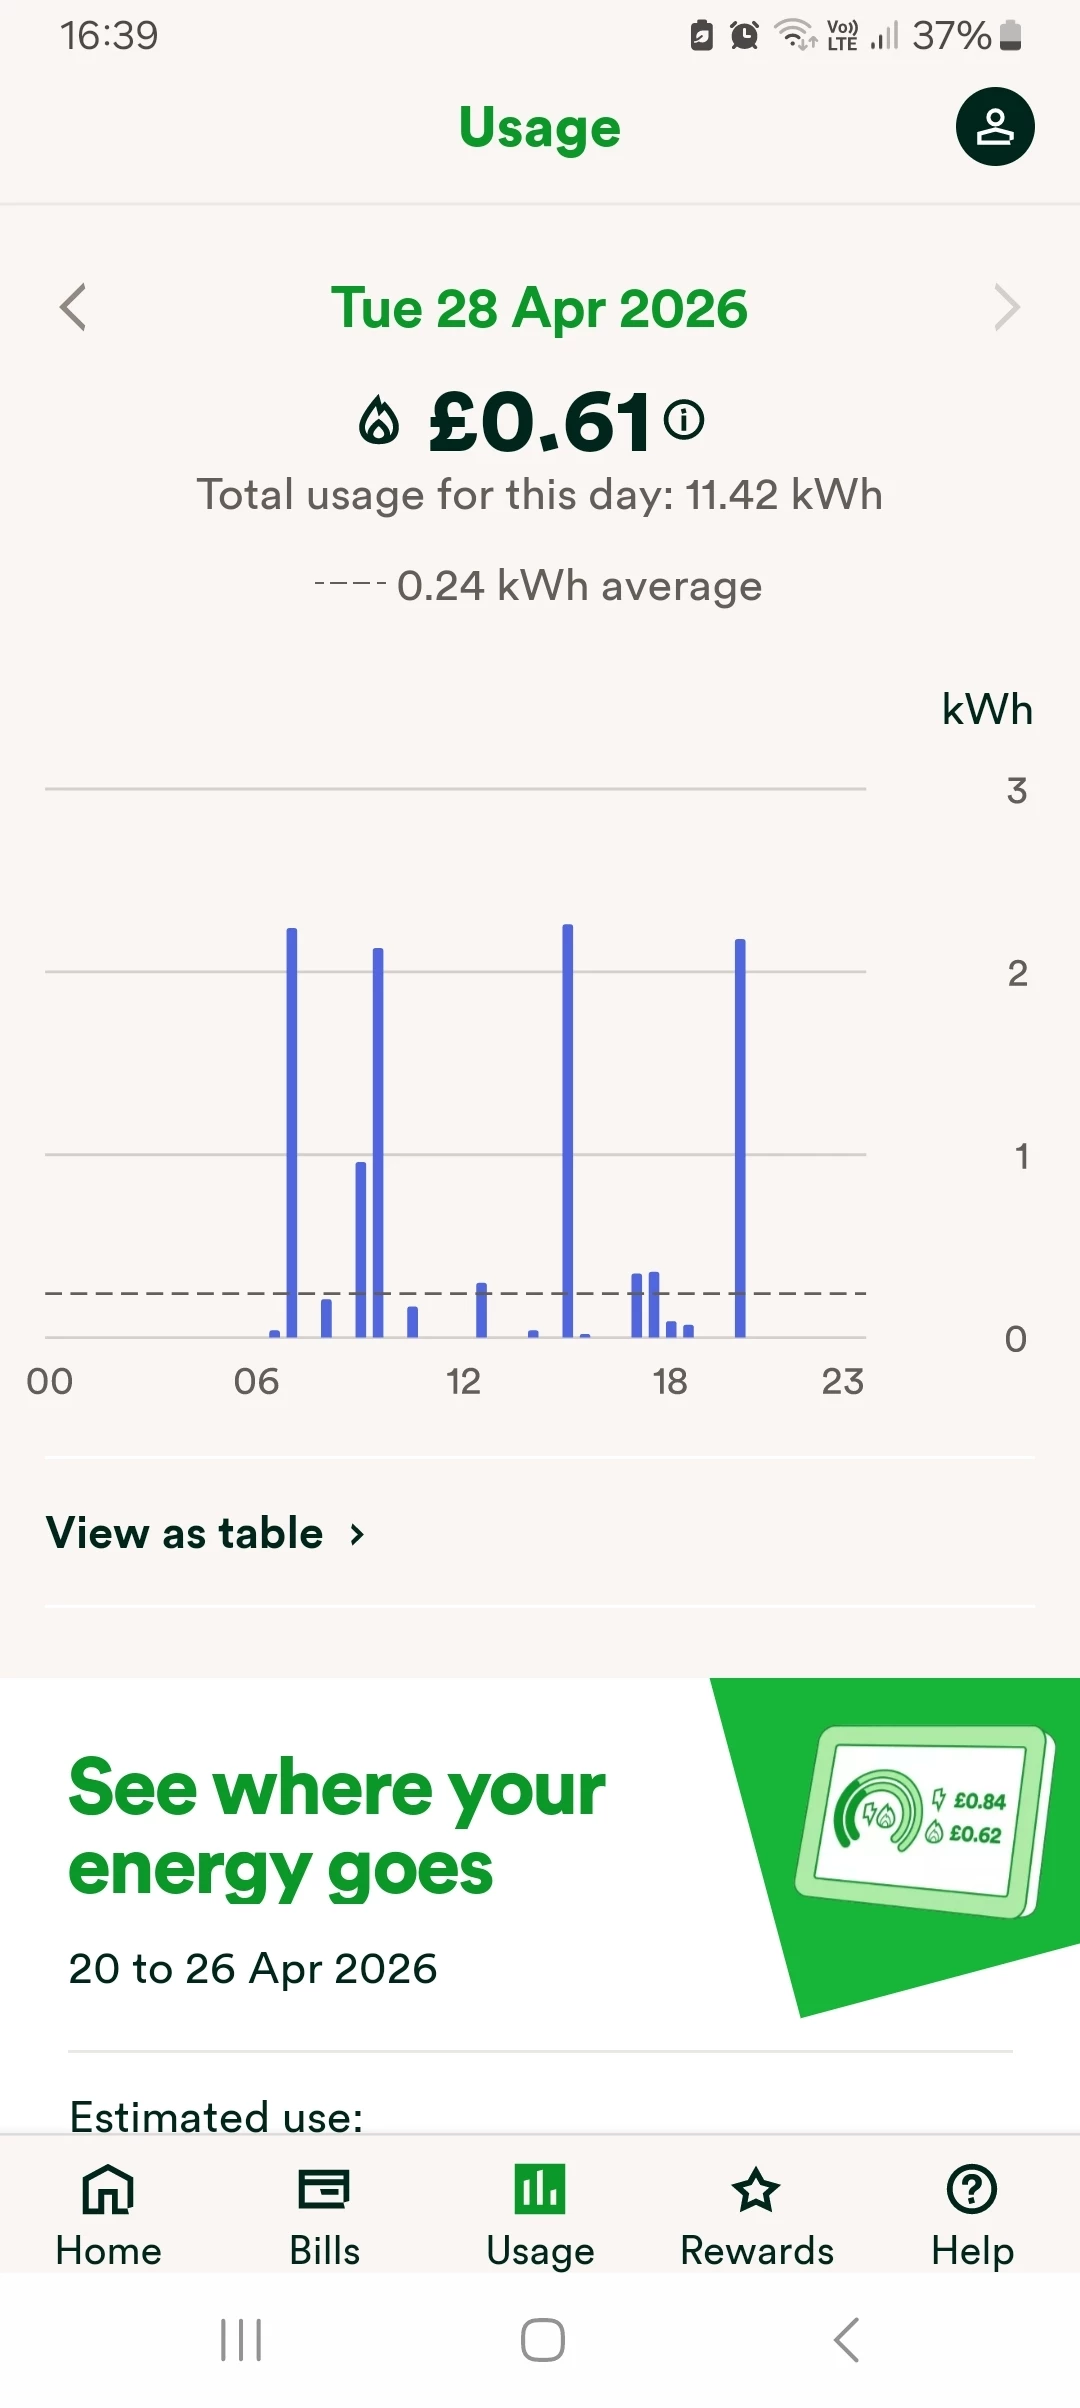
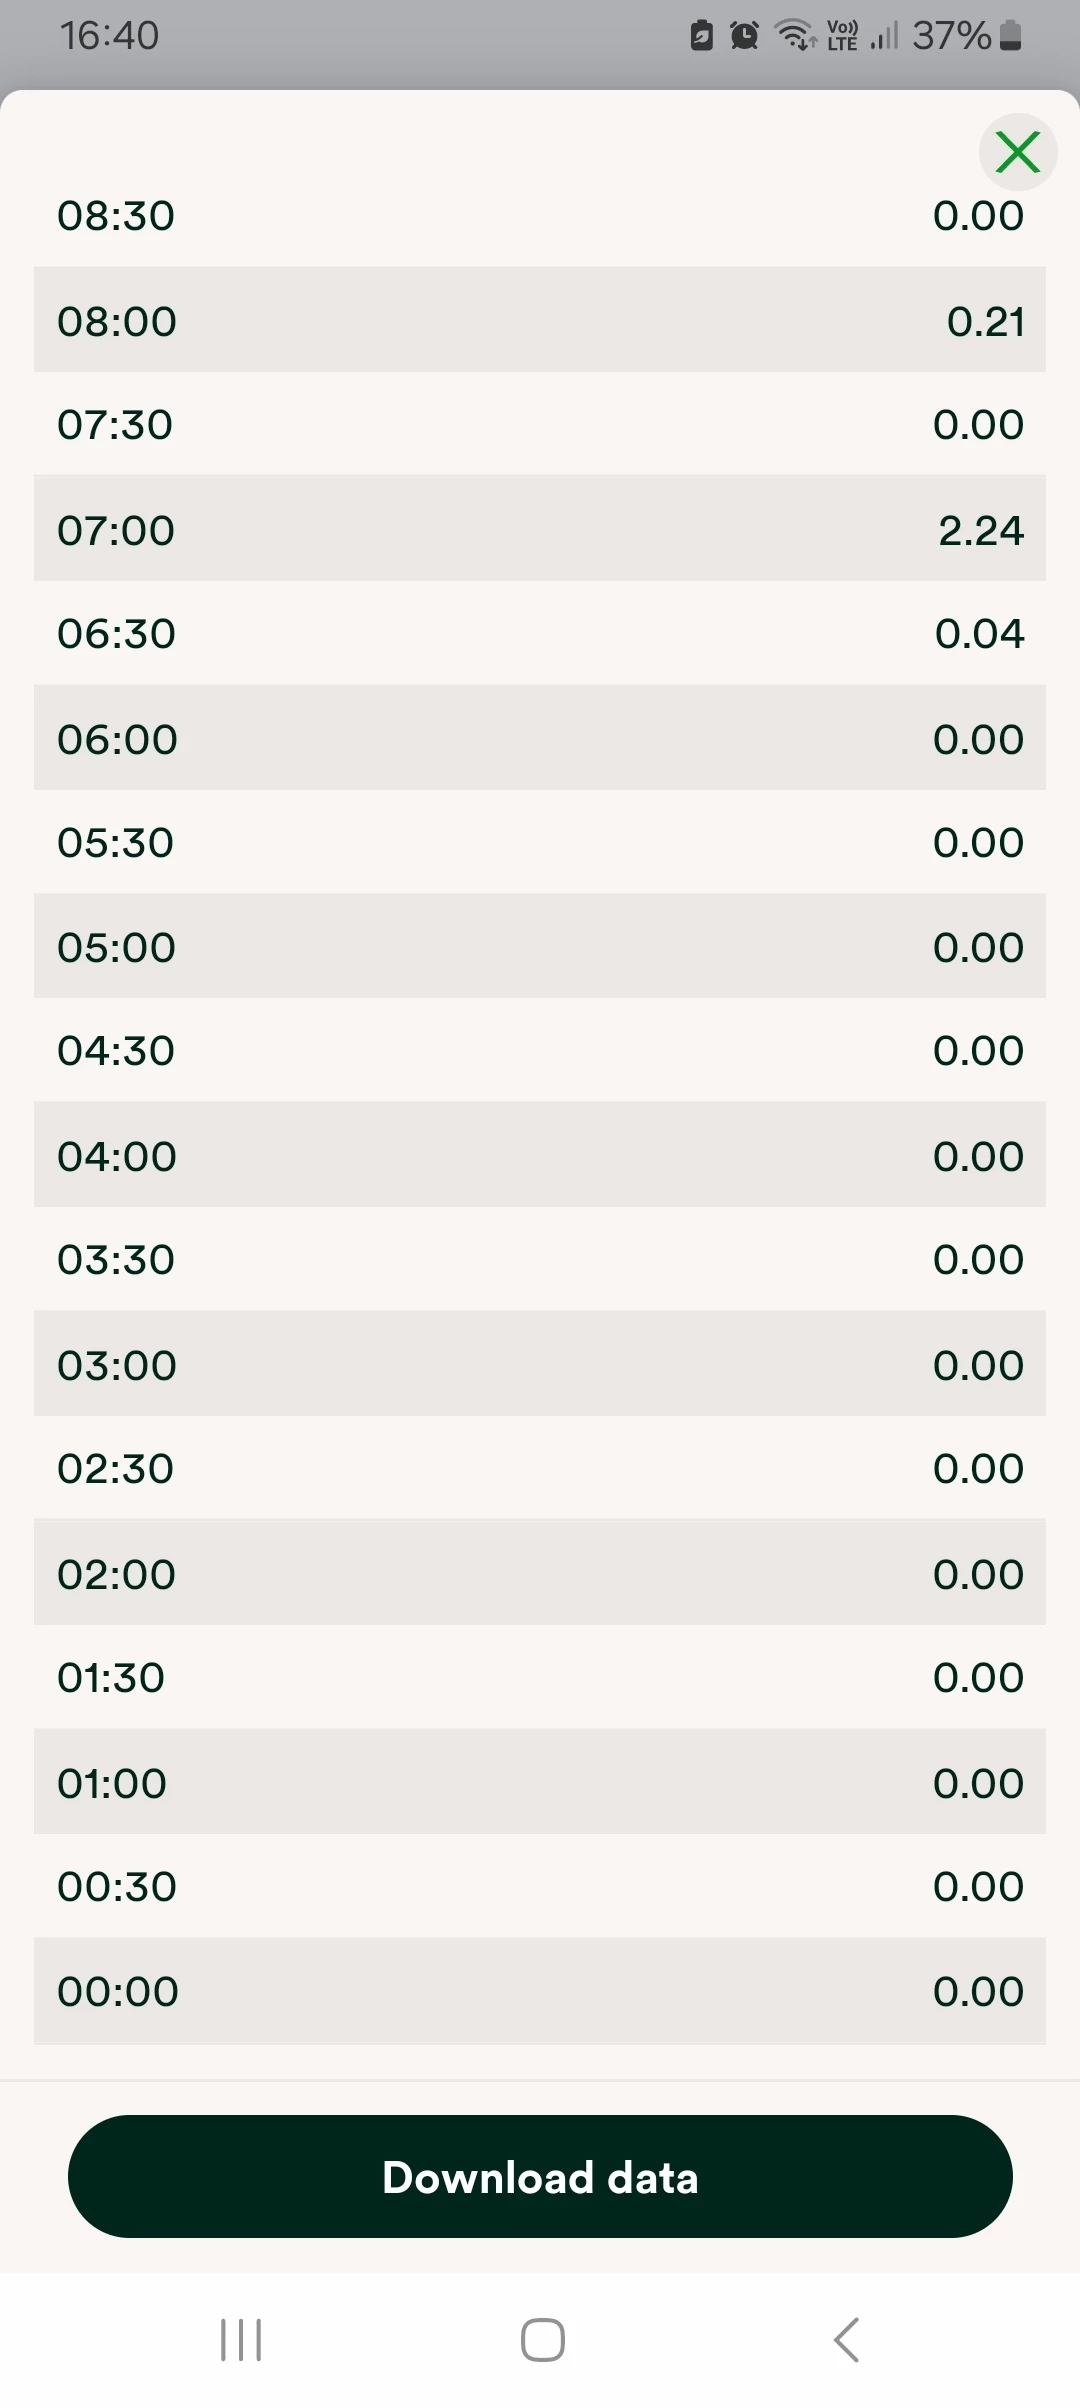
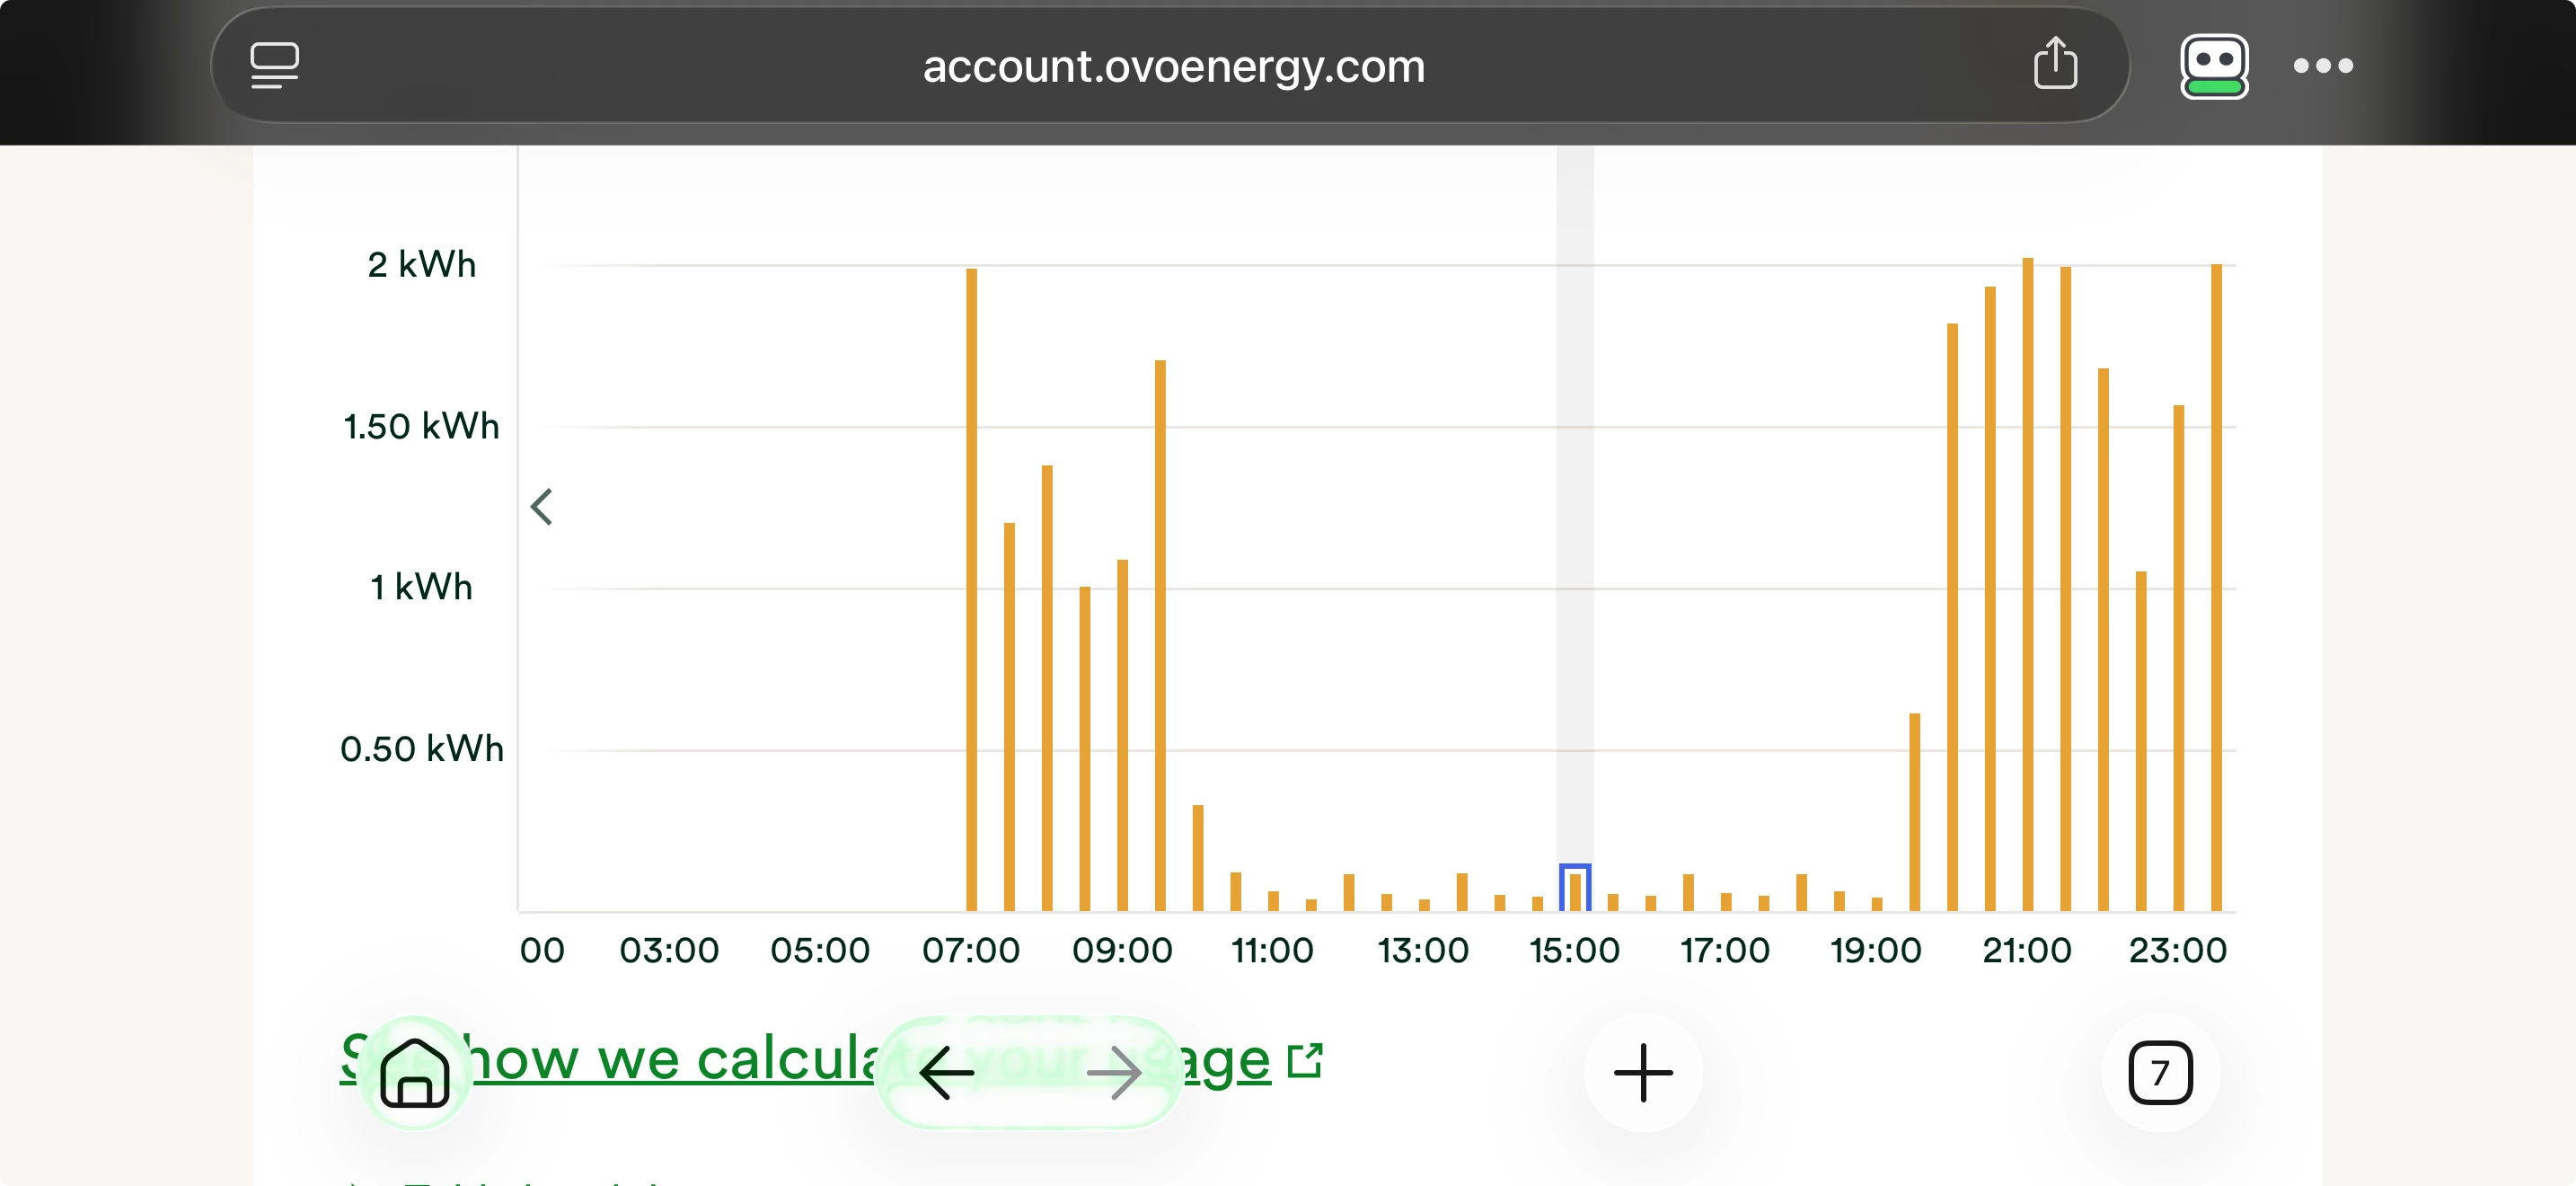
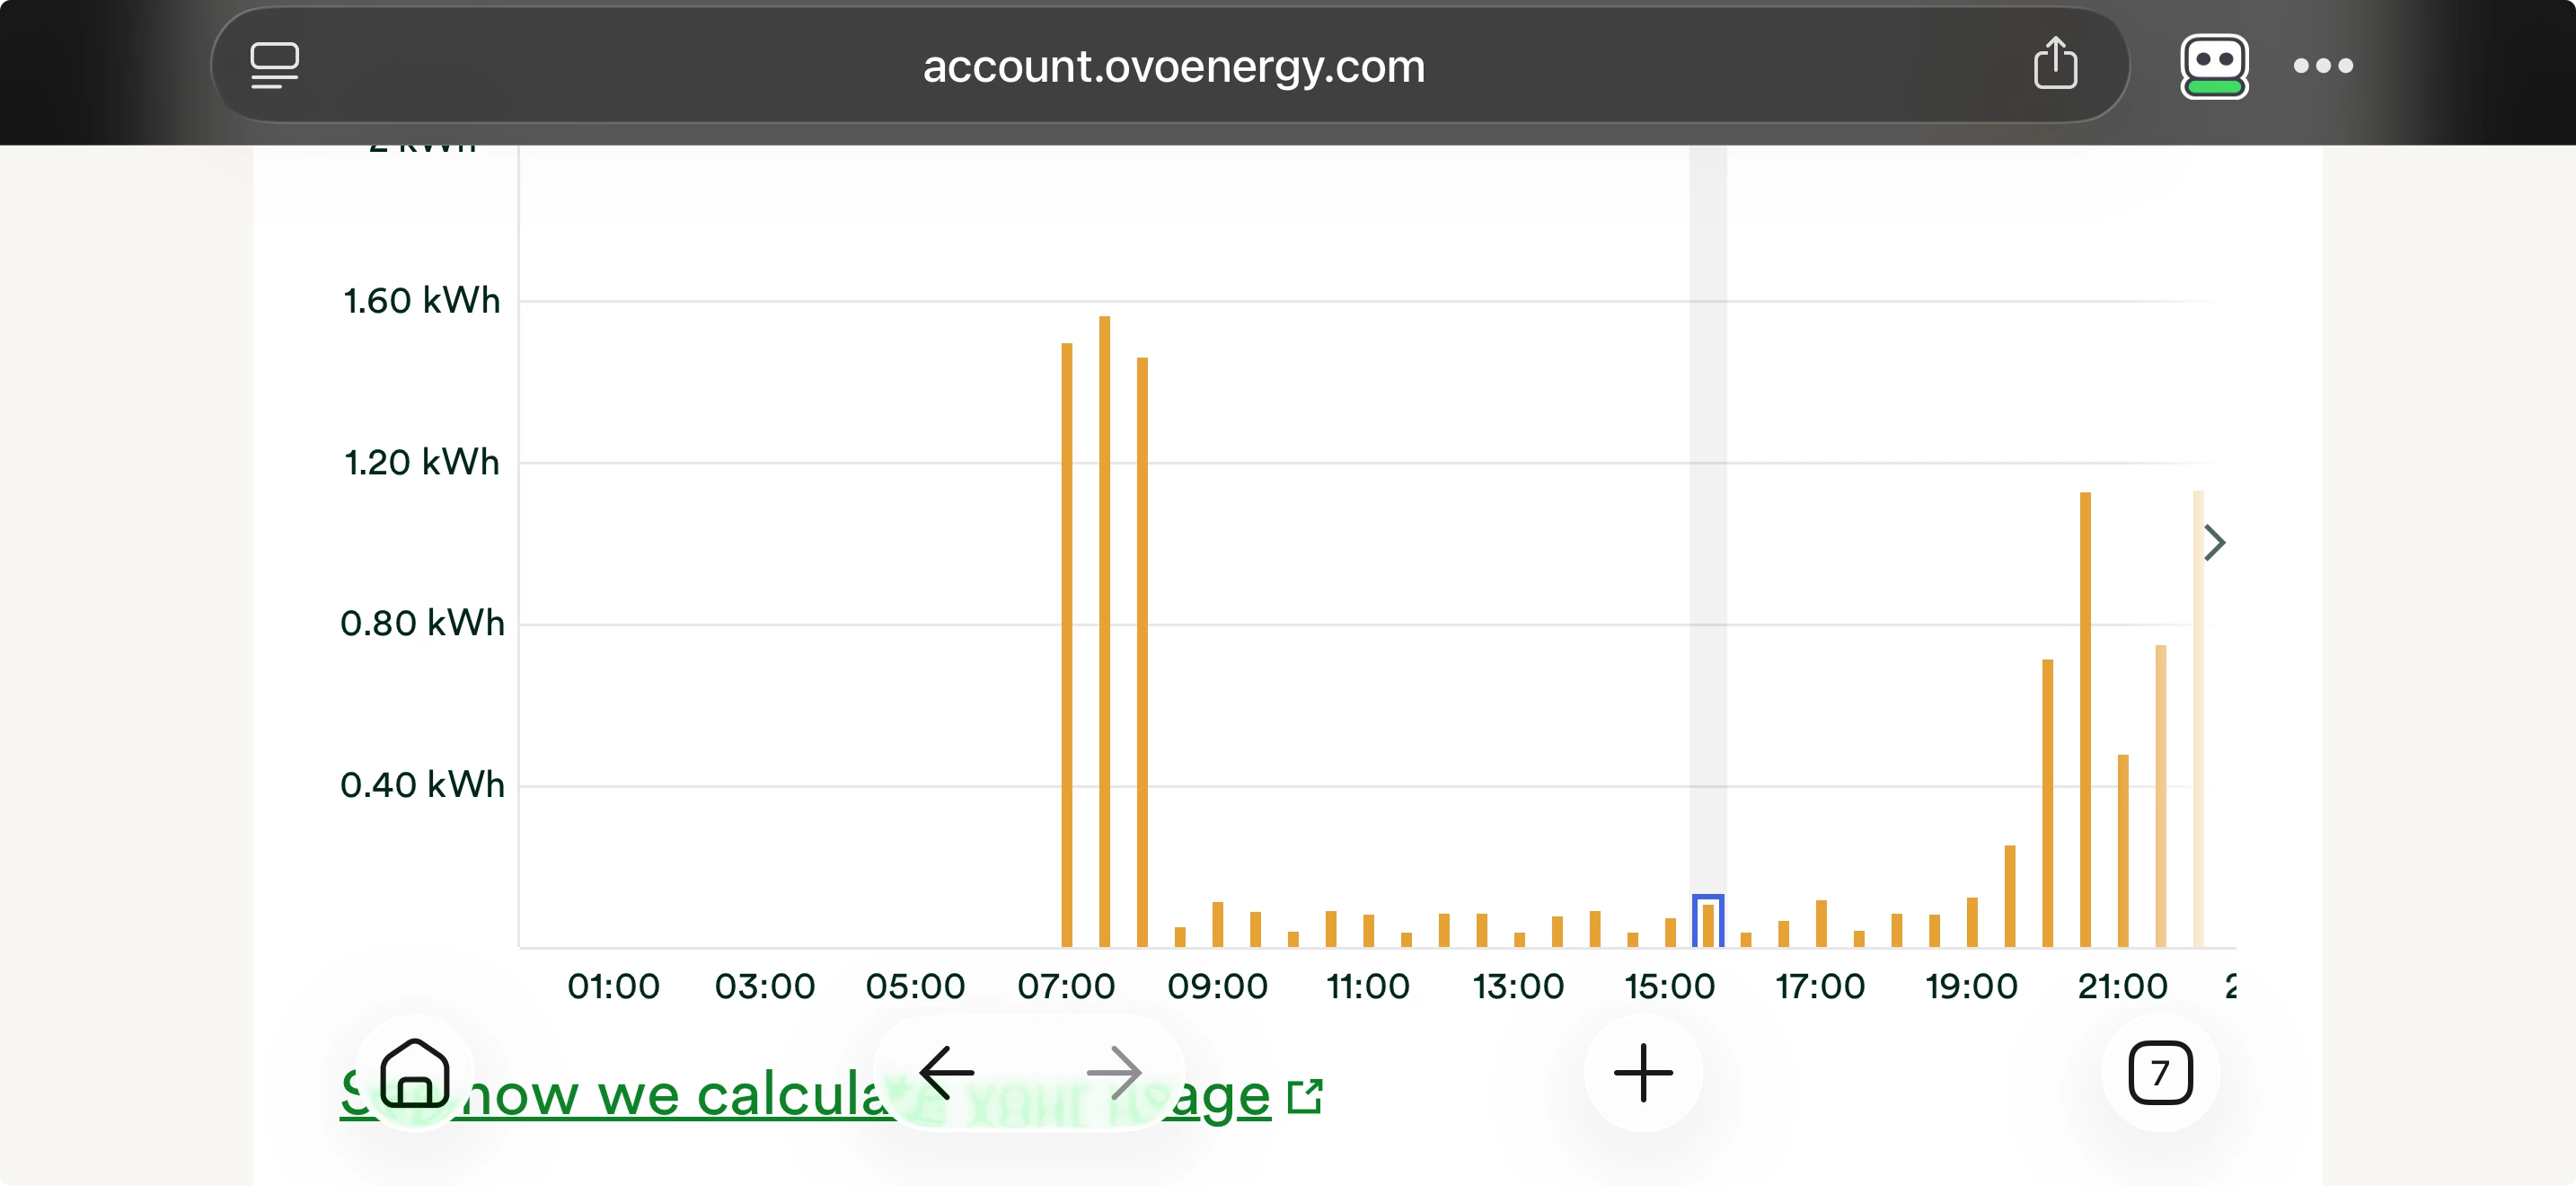
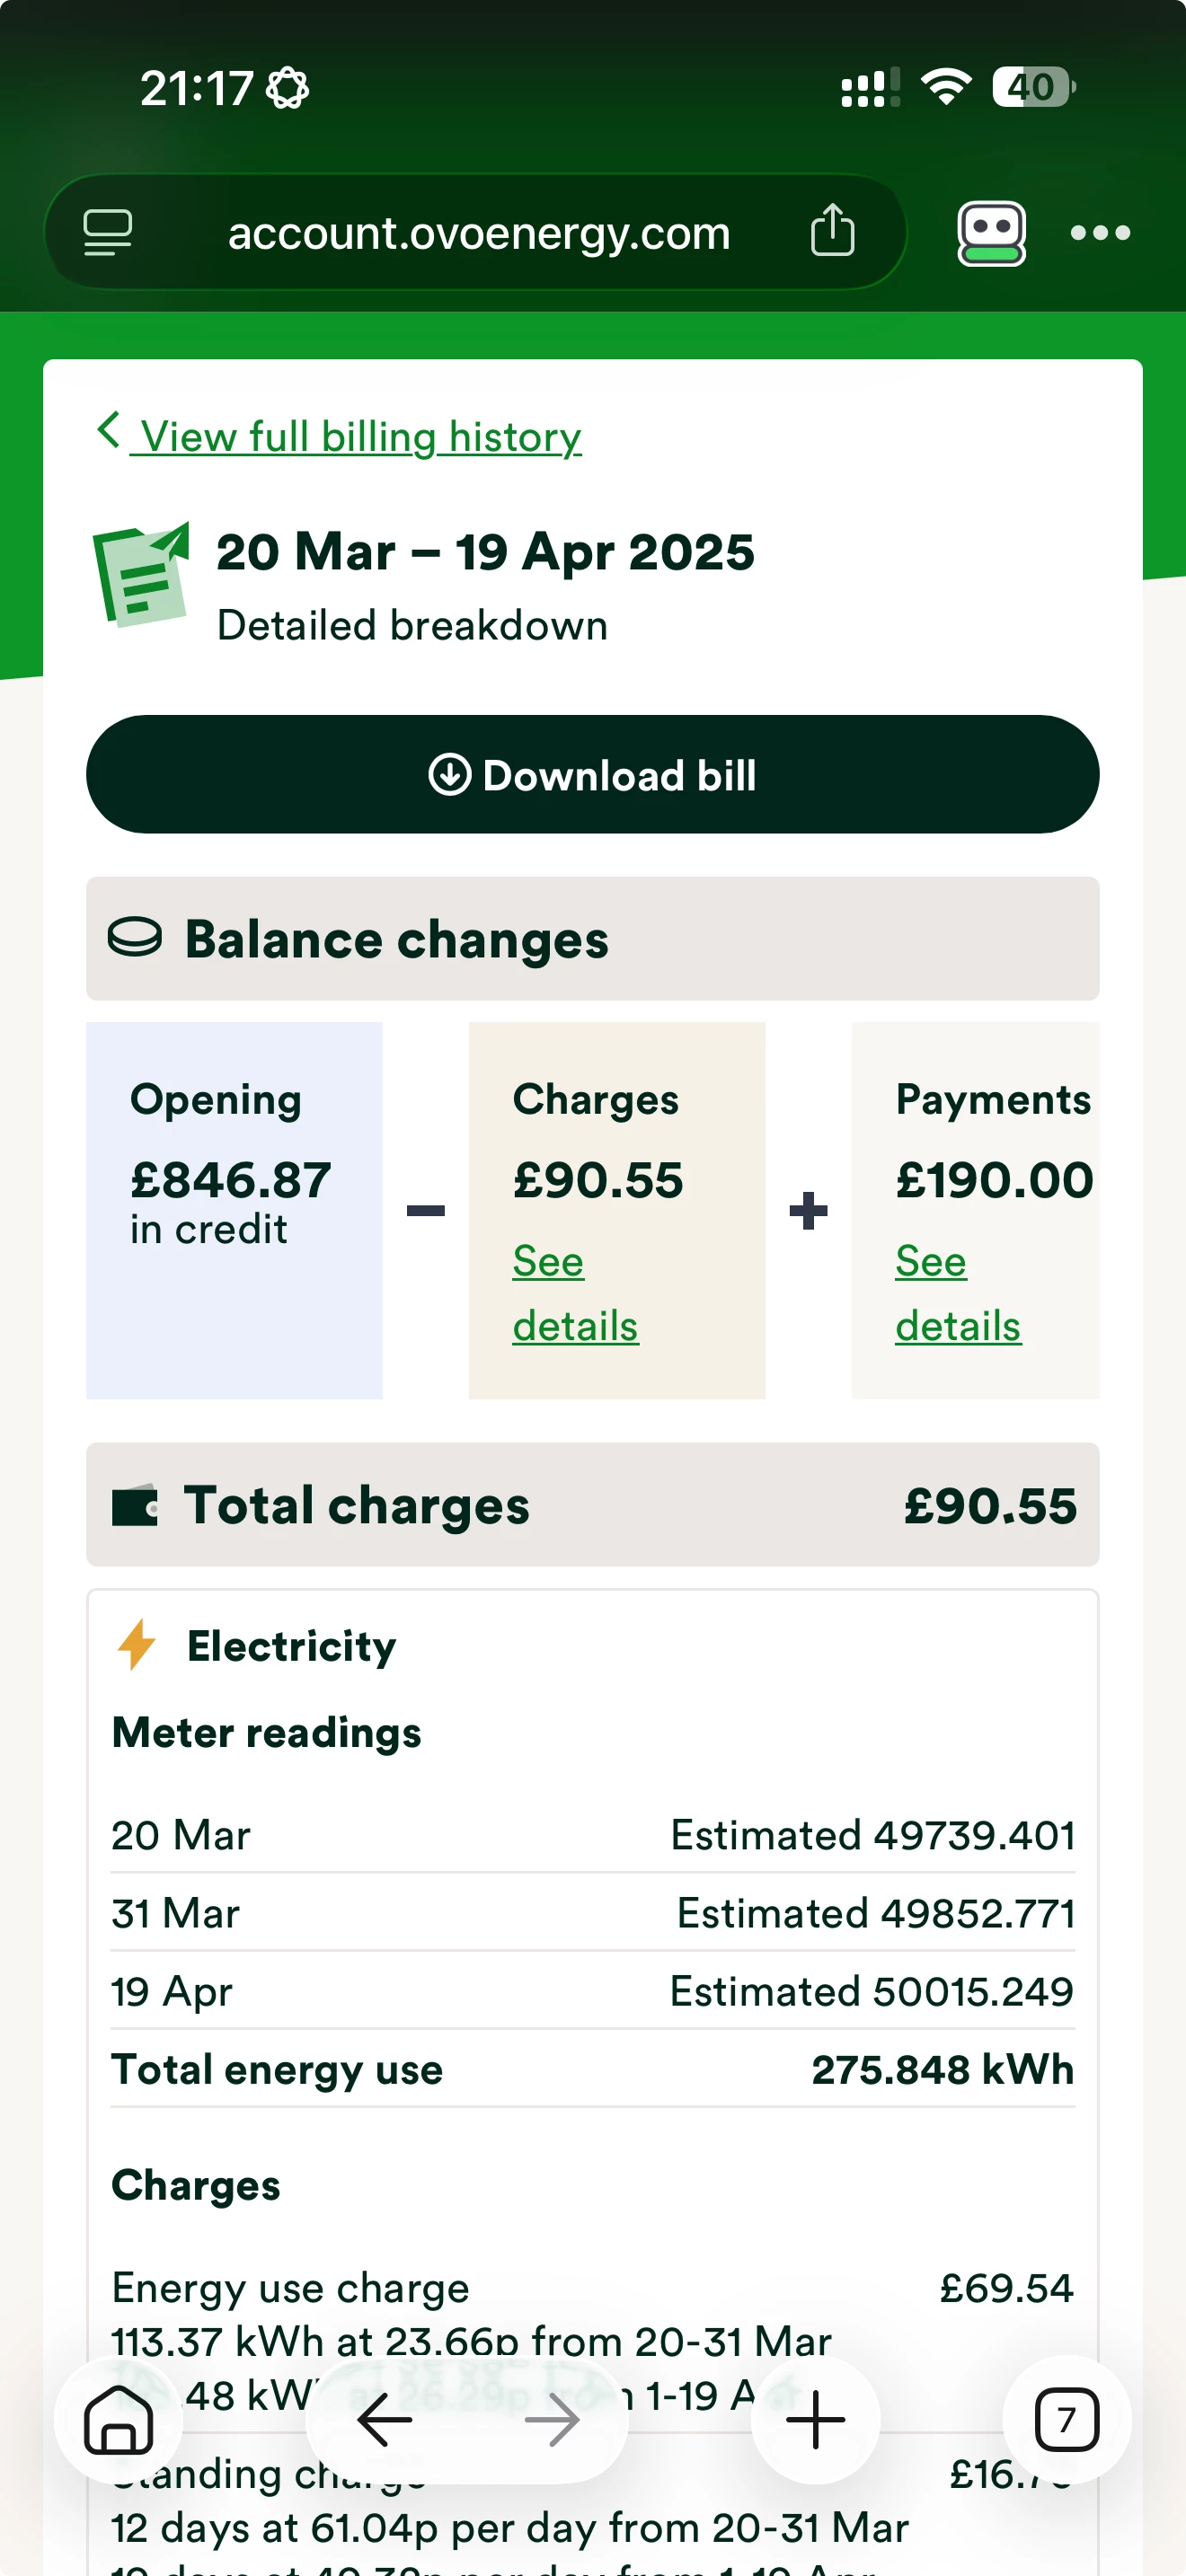
However, EVERY single day her half hour readings show 0 ZERO usage from exactly midnight to exactly 7:00am.

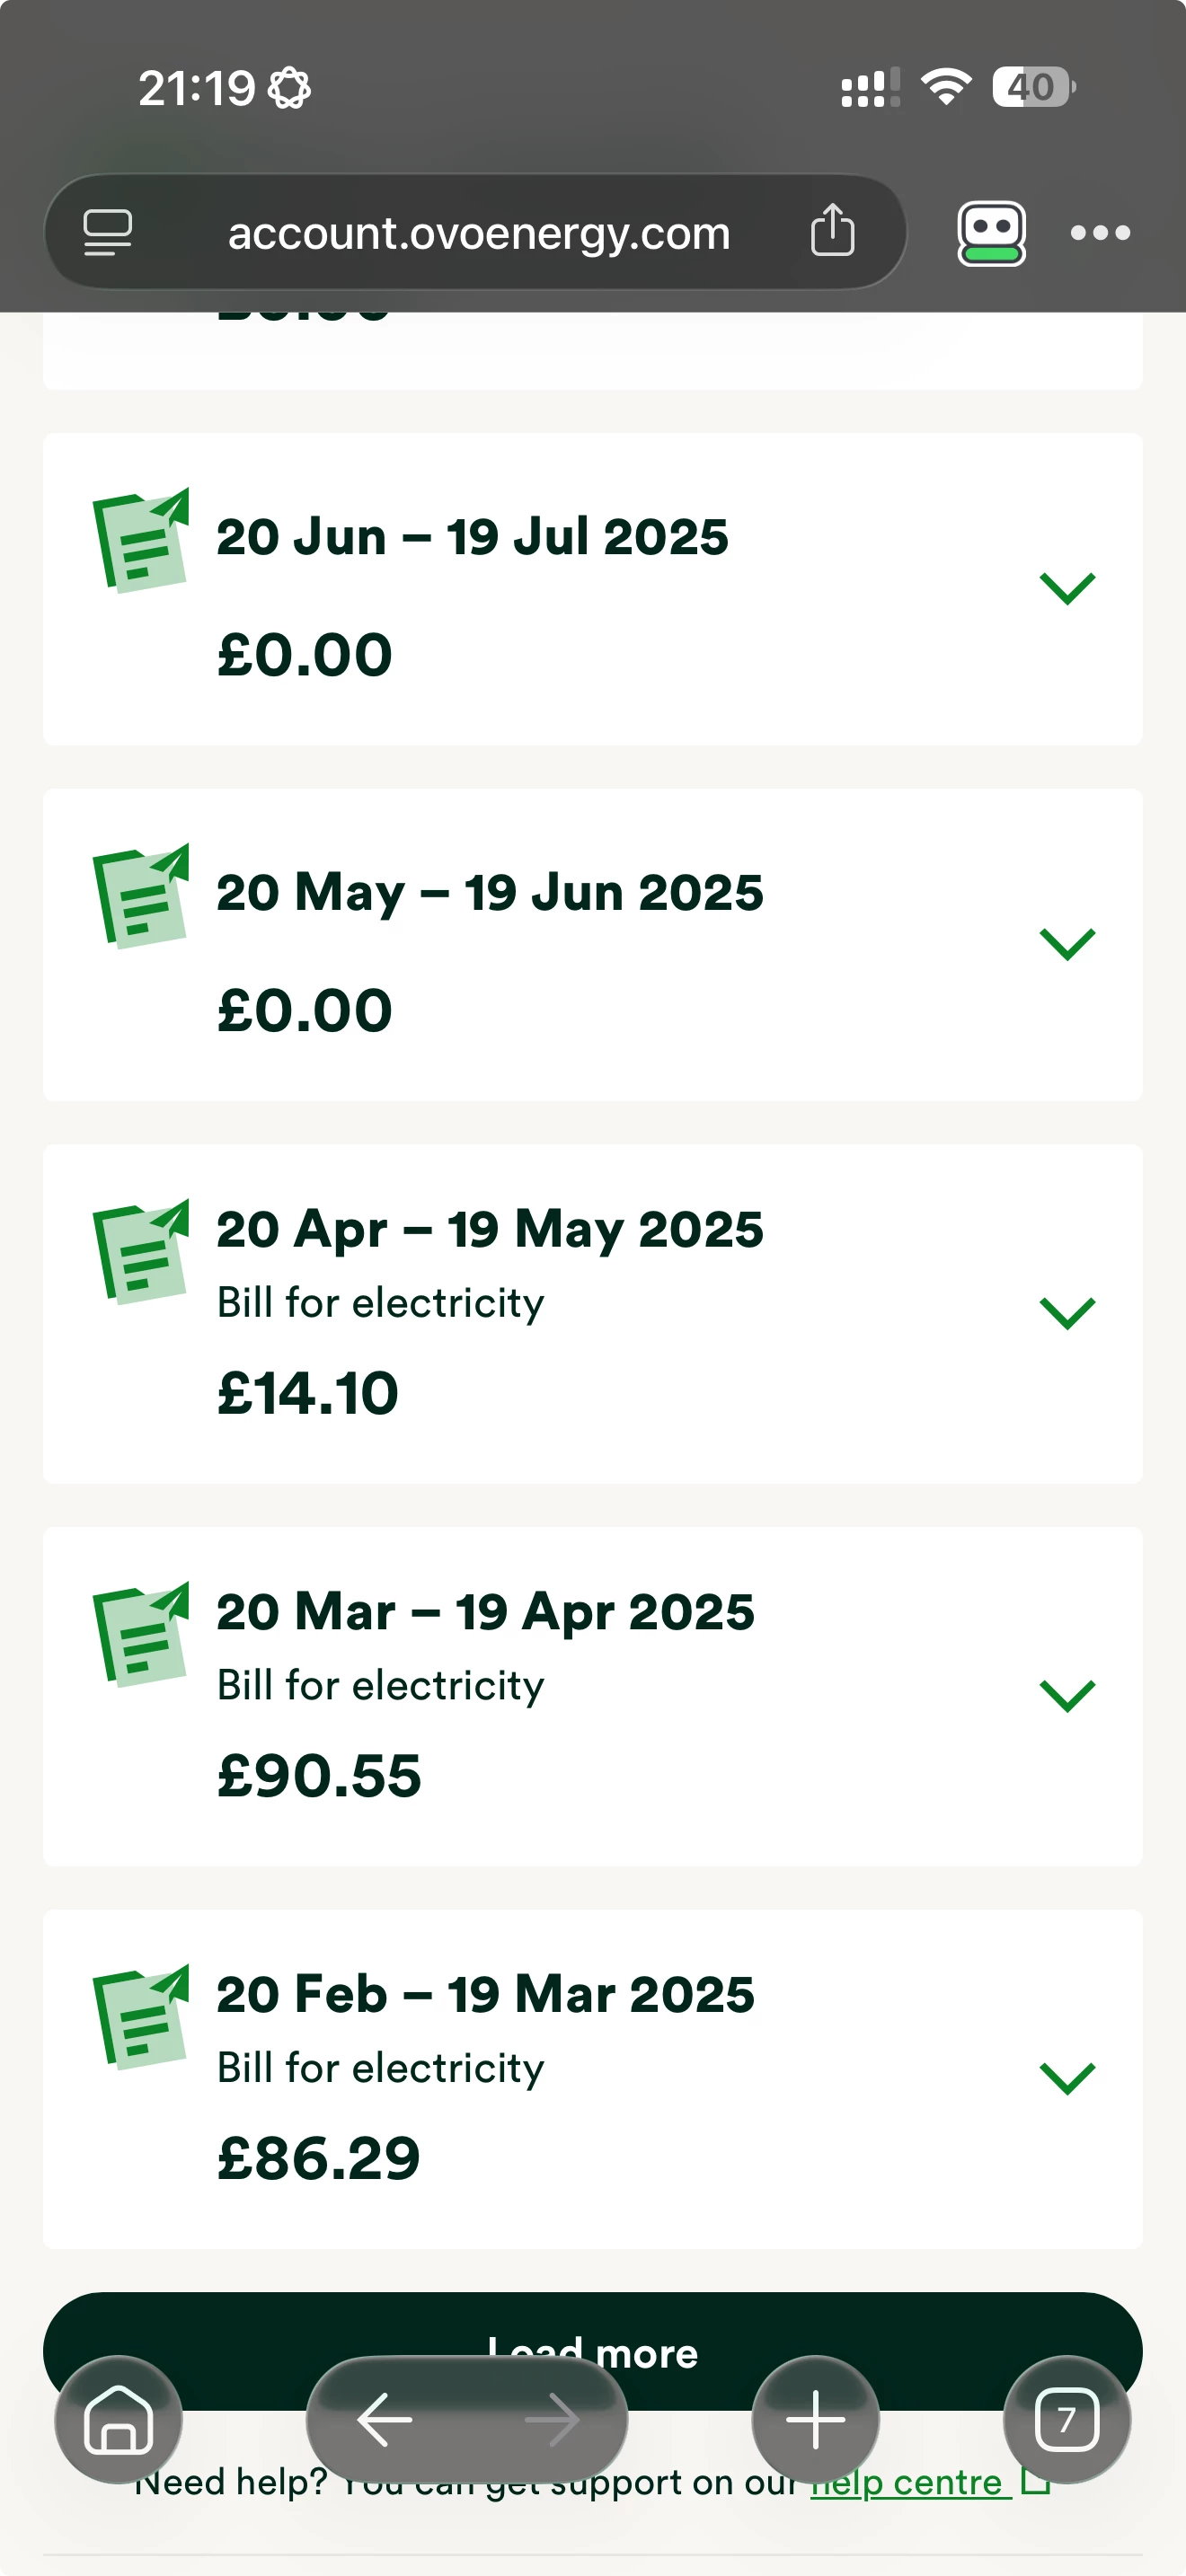
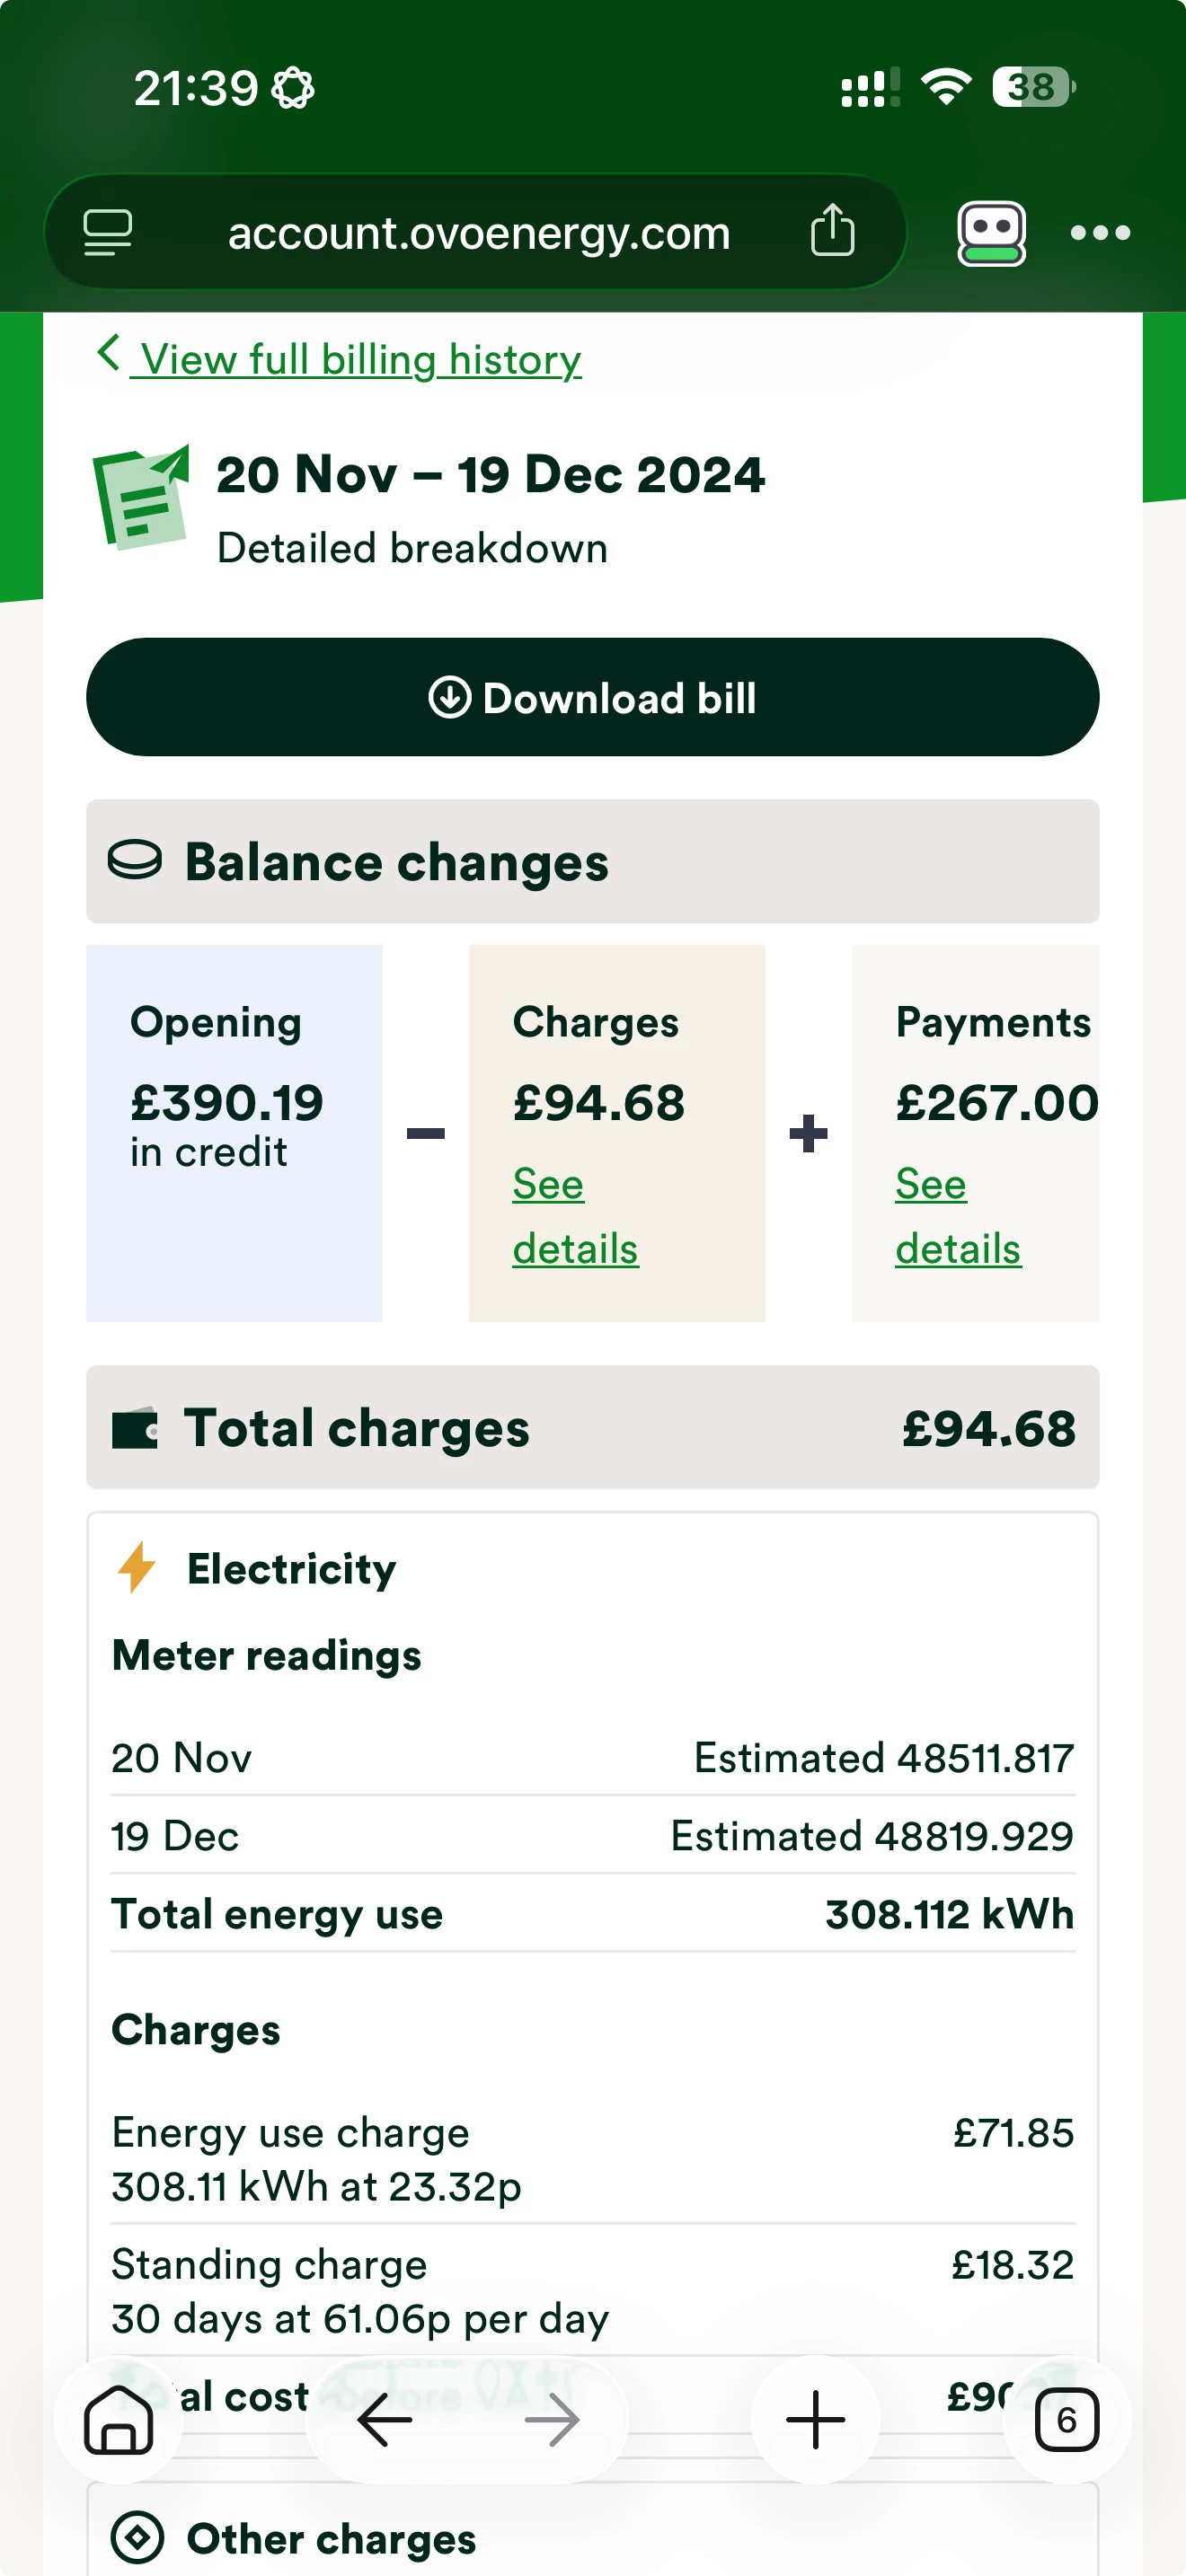
Ovo are saying their meter readings are right.

My argument is that if you drove your car a distance that you know for sure is 10 miles, but your odometer said it was 50 miles… then you are saying that the odometer must be right as that is what the odometer says !!!

My 88yo Mum does not race around the house and turn off absolutely everything at midnight, then 7 hours later race around and turn everything on.

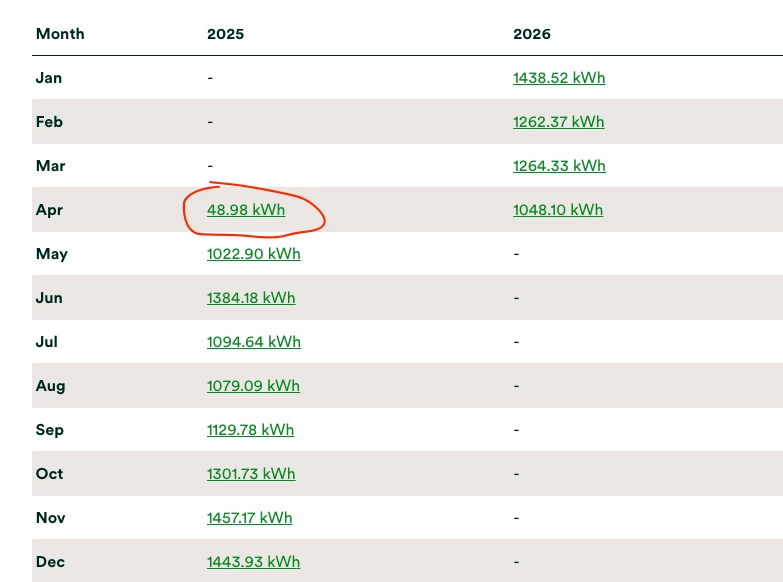
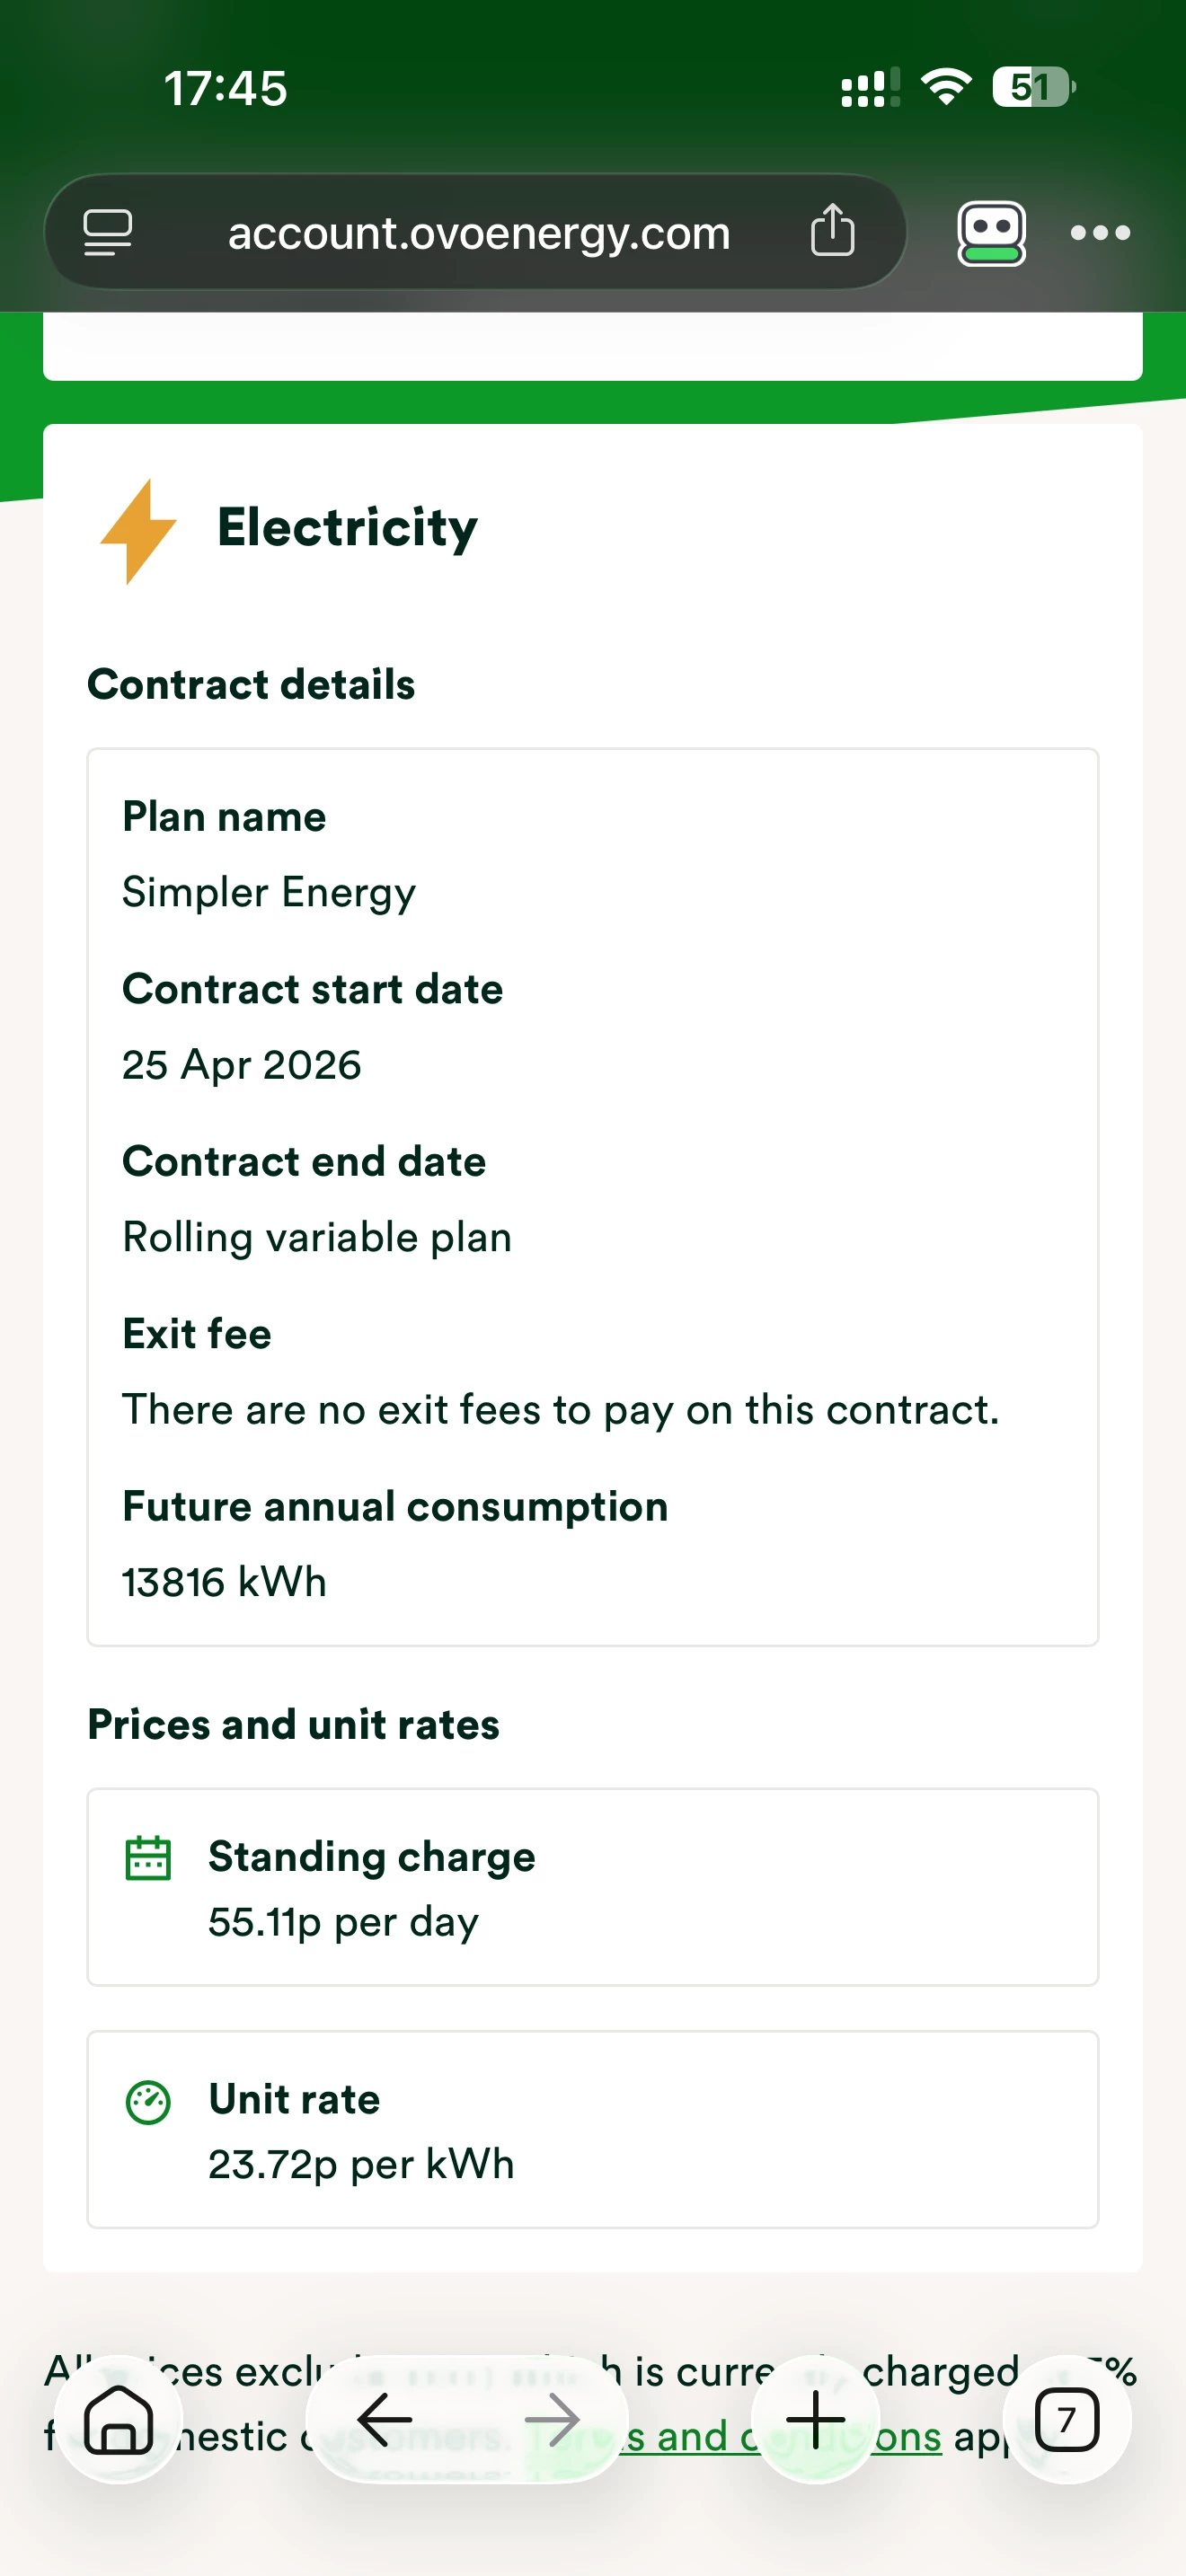
It would be funny if Ovo weren’t predicting she will use over 13000 KWH for the year !!

Anyone with any insights ?


63 replies

juliamc
Rank 20
Forum|alt.badge.img+10
  • Rank 20
  • April 29, 2026

Very odd. Could you post a screenshot of two of where you are seeing this please? Is this for gas or electricity?


Nukecad
Super User
Forum|alt.badge.img+5
  • Super User
  • April 29, 2026

Are you perhaps looking at the gas only readings, with a gas central heating boiler timer set to be OFF between midnight and 7am?

My gas CH is set to be off between 22.00 and 07.00 so my gas usage has zero half hourly readings between those times. (Unless I run a hot tap during the night, it's a combi-boiler, so such as below where I ran a hot tap beteween 6.30 and 07.00).


Ben_OVO
Community Manager
Forum|alt.badge.img+4
  • Community Manager
  • April 30, 2026

Good morning ​@rogerp64 and welcome to the community, I hope you’re doing well.


Thanks for your post - this is a strange one indeed. I’m hoping that, as ​@Nukecad suggests, that it might be the gas usage displayed on the app - easily done. This guide gives some good info on all aspects of the ‘Usage’ pages:


If this isn’t the case, and the electricity usage is displaying zero usage between midnight and 7am, this could point to the meter being set up incorrectly, or just a technical error with the app / online account. Please could you check the browser online account portal, and let us know whether the issue is the same there?


We look forward to hearing back from you.


  • Author
  • Rank 2
  • April 30, 2026

Thank you for your suggestions. 
Mum doesn't have gas, but the suggestion about the water heater is likely the explanation.


I will make sure the (electric) water heater is turned off and track usage. Heating up the entire tank must take a whack of power… 


Ben_OVO
Community Manager
Forum|alt.badge.img+4
  • Community Manager
  • April 30, 2026

@rogerp64 something definitely seems wrong here. If you could provide screenshots of the ‘Usage’ pages that’d be helpful. 


  • Author
  • Rank 2
  • April 30, 2026

Thank you ​@Ben_OVO 


water heater is turned off. So it’s not that causing the spikes. 
 

here are two images from separate days in the past week. 


Firedog
Super User
Forum|alt.badge.img+7
  • Super User
  • April 30, 2026

here are two images from separate days in the past week. 
 

Those are revealing images - thank you.

They show something like a 3kW heater starting at 7 each morning, and again at around 7.30 in the evening, on top of other activities like cooking and watching television. How is the house heated? If there are storage heaters, you would expect to see them charging up overnight - e.g. from midnight - with the sort of pattern you see from 7 am. The evening spikes could then be supplementary heating of some sort, either separate panel heaters or (for some modern storage heaters) an inbuilt fan heater (referred to as ‘boosting’ or  ‘balancing’ when there isn’t enough stored heat left to maintain the temperature at the desired level). 

This does look like some sort of wiring fault, as if appliances have been connected to the wrong circuit. Things like fridges and freezers operate round the clock, and something’s seriously wrong if they aren’t running at all overnight. 

You may have to get a competent electrician in to check things over. We might have some suggestions to make if you could post some photos of the electric supply, ideally:

  • a close-up of the meter itself (with the display lit up by touching a button if necessary) clear enough to be able to read the display and the markings on the meter itself;
  • A view of the whole backboard so we can see the main supply cable coming in from outside, and all the cables to and from the meter itself;
  • A view of each consumer unit (fuse box) clear enough to be able to read any labels the electrician may have left to say which breaker is which.

This may help us to get to the bottom of the problem and make it possible to suggest a remedy.


  • Author
  • Rank 2
  • May 1, 2026

@Firedog thank you for this. 
 

I’ll aim to get those pics as soon as I can. 
My Mums house has no active heating.

She runs a couple of fan heaters when needed and rugs up (big time) (and these fan heaters are running in the hours that are showing as nil use (Mums a night owl)


Ben_OVO
Community Manager
Forum|alt.badge.img+4
  • Community Manager
  • May 1, 2026

Thanks ​@rogerp64, we’ll await your photos as helpfully requested by ​@Firedog. I’m hoping that there’s something wrong with the usage graphs on our side, rather than with the supply at her home. Whatever the case we’ll help you get to the bottom of it.


  • Author
  • Rank 2
  • May 1, 2026

Thank you ​@Ben_OVO   I spent an hour on the phone explaining that my mother lives on her own and uses only small devices. No oven, no hot water. Fans, microwave, kettle. 
 

the consistent message was that we don’t know what she uses at home. No. However I do… and is 13000KWH what would be considered normal for a Years use !!


Ben_OVO
Community Manager
Forum|alt.badge.img+4
  • Community Manager
  • May 1, 2026

@rogerp64 13000kwh electricity over a year is incredibly high, and we rarely see this sort of usage, especially in a property like you’re describing. Are the bills incredibly high at the moment? If not, then this figure of 13000kwh will be incorrectly labelled on our systems, rather than there being a problem within the property causing high usage.


juliamc
Rank 20
Forum|alt.badge.img+10
  • Rank 20
  • May 1, 2026

If your mother had gas heating then that amount of kWh would not be that unreasonable. However, 13000 kWh of electricity must be very expensive.

Can you post a graph of her usage over a year?


Nukecad
Super User
Forum|alt.badge.img+5
  • Super User
  • May 1, 2026

@rogerp64 

What you report seems so odd, the zero readings overnight particularly, that I’m wondering if we may possibly be looking at a “crossed meter” situation here?

If you notice that the meter details and readings on your bill don’t match the meter that you think is yours, or you notice that your meter isn’t clocking when you think it should be, then you may have crossed meters.

There is more information about what a crossed meter is, and how to do a ‘kettle test’ to check for it, here:


Firedog
Super User
Forum|alt.badge.img+7
  • Super User
  • May 1, 2026

​​​​What you report seems so odd, the zero readings overnight particularly, that I’m wondering if we may possibly be looking at a “crossed meter” situation here?
  

That’s a very good point that I hadn’t considered. ‘Everything off overnight’ could be a ‘communal’ supply, e.g. powering washing machines and lights in a basement. I think someone would have noticed if, say, both fridge and freezer were off overnight. The usage pattern shown in the screenshots can’t really be that of a household. 


  • Author
  • Rank 2
  • May 2, 2026

Thank you everyone for your comments.

Clearly there is something wrong and based on this image, it looks very much like something happened in May 2025 !!


Nukecad
Super User
Forum|alt.badge.img+5
  • Super User
  • May 2, 2026

. I think someone would have noticed if, say, both fridge and freezer were off overnight. The usage pattern shown in the screenshots can’t really be that of a household. 

Consider though that not every houshold necessarily has a fridge or a freezer.

It might be considered unusual these days, but it’s not unknown.
(I lived from 2000 to 2011 without either, it’s easy to do when the shops are nearby, and even if not there’s always canned food, etc.).


  • Author
  • Rank 2
  • May 2, 2026

. I think someone would have noticed if, say, both fridge and freezer were off overnight. The usage pattern shown in the screenshots can’t really be that of a household. 

Consider though that not every houshold necessarily has a fridge or a freezer.

It might be considered unusual these days, but it’s not unknown.
(I lived from 2000 to 2011 without either, it’s easy when the shops are nearby).

@Firedog ​@Nukecad Mum has a side-by-side Fridge Freezer.. it doesn’t go off overnight…  she is generally awake watching TV, making cups of tea, fan heaters on until 4:00 or 5:00 each night.. she then sleeps in till around midday.


  • Author
  • Rank 2
  • May 2, 2026

I found an email from 2021 SWALEC…  showing project usage and cost. I appreciate everything has increased in price, but my Mum’s pattern of behaviour has not changed.

(earlier comment regarding communal meters.  Mum is in a fully detatched home)


  • Author
  • Rank 2
  • May 2, 2026

. I think someone would have noticed if, say, both fridge and freezer were off overnight. The usage pattern shown in the screenshots can’t really be that of a household. 

Consider though that not every houshold necessarily has a fridge or a freezer.

It might be considered unusual these days, but it’s not unknown.
(I lived from 2000 to 2011 without either, it’s easy to do when the shops are nearby, and even if not there’s always canned food, etc.).

Mum has a pretty big side-by-side… She is awake most nights until 4:00 or 5:00am watching TV, boiling the kettle and with the fan heaters on…  so this zero usage at night just cannot be right.


Firedog
Super User
Forum|alt.badge.img+7
  • Super User
  • May 2, 2026

The usage figures you shared this morning are interesting, too. The monthly figures are derived from meter readings, not half-hourly usage data. Here are a couple more questions:

  1. We can’t tell whether the figure of 48.98 in April 2025 is for the whole month or just part of it. Which period does the entry cover?
  2. Was this meter newly installed in April 2025? If not, why are there no entries before then?
  3. On the meter readings page, you should see the serial number (the MSN) for the meter concerned. This should match both the number printed on the front of the meter itself and, of course, the number shown on bills. Does it? 
  4. It’s a dreary exercise, but could you please look at the meter reading history back to March-April 2025? There will be lots of clicks on Show more required.
    Every entry should be labelled Smart - are they?
    Is there anything odd about the sequence of readings for April and May? 

  • Author
  • Rank 2
  • May 3, 2026

Thanks ​@Firedog I will see what I can dig up. 
 

Smart Meter was installed at Mums in early March 2026 (not quite two months ago)


Nukecad
Super User
Forum|alt.badge.img+5
  • Super User
  • May 3, 2026

Thanks ​@Firedog I will see what I can dig up. 
 

Smart Meter was installed at Mums in early March 2026 (not quite two months ago)

Was it a non-smart meter before and she sent in readings monthly?

If that is the case then the usage figuers since the new meter was fitted are consistent with the usage figures from the previous meter.
Which is interesting and shows that although they look high for a single person they are probably correct if the heating is all electric and particularly if fan heaters are in use (all night?).

You still haven’t explained why there is no usage from before April 2025 showing.
Was she perhaps with a different supplier before that?

It’s now looking more like the meter is correct and your mum is using that much electricity, so why the half hour usage figures are not showing that correctly overnight remains a puzzle.
Could it simply be a case that the half hourly data is being recorded and sent to DCC, but that bar chart is not showing it correctly for some reason?

I think we are at the stage where some photos of the meter, and everything around it on the backboard, plus photos of the consumer unit, might be handy if you can provide them.


EDit- I just had another thought.
Is your mum perhaps on Economy7 tariff, and it’s the 7 off-peak hours that are not being displayed on the bar graphs that you screenshotted?
I’m not sure just how those bar graphs show usage on multi-rate tariffs.
I’m guessing here, but is there perhaps a seperate set of charts that show the midnight to 7am off-peak usage?


  • Author
  • Rank 2
  • May 3, 2026


plan


  • Author
  • Rank 2
  • May 3, 2026

Ok. Here is more info. I had to change the account holder from Mum to myself, as Mum is not able to manage payment of the bill. 
 

I tried to do this online, but quite sure I mucked it up. 
I somehow cancelled Mums account, but then got it moved to myself. This is why the views prior to April 2025 are showing as blank. 
 

When I was next Mum we spoke to Ovo and got

the all clear for me to be paying Mums account.


I still cannot understand the usage. And especially when looking at the following images which are views from my Mums account before April 2025. 


  • Author
  • Rank 2
  • May 3, 2026