dose any one know when the clocks change to BST (British Summer Time) dose the off peak charging time also change with the time change or continue at GMT time?...some background to the question, my smart meter (installed by Ovo) only uses GMT time all year…… my home automation (Habitat System). runs in GMT so all appliances running on time switches via Home automation are on GMT using Habitat home automation I have managed to shift between 88% and 98% to off peak (using the Loop app data taken from my Ovo meter) of my electric usage to over night!
This is speculation on my part, but based on personal experience.
The peak/off-peak hours are set by the Distribution Network Operator (DNO), who know best how to balance their load. The timings are GMT all year round.
Some smart meters compensate for this when the clocks change, while others don’t. Some time switches powering off-peak equipment (e.g. storage heaters and immersion water heaters) also compensate, but it may take a manual adjustment to the timer clock to show the same time as other clocks in the house. It usually makes no real difference either way, unless you find that a heater is switching on at midnight when the cheap rate doesn’t start until 1AM (if this does happen, then the ON period should perhaps be adjusted to exclude the first and last hours of the advertised period).
It does however create a headache for those responsible for the usage and billing pages of the online account. This is my usage table for 30 October 2022:
Before midday
After midday
Time period
Usage
Time period
Usage
12:00am
-
12:00pm
0.08 kWh
12:30am
-
12:30pm
0.09 kWh
1:00am
0.07 kWh
1:00pm
0.18 kWh
1:30am
0.03 kWh
1:30pm
0.09 kWh
1:00am
0.03 kWh
2:00pm
0.09 kWh
1:30am
0.03 kWh
2:30pm
0.09 kWh
2:00am
0.03 kWh
3:00pm
0.09 kWh
2:30am
0.04 kWh
3:30pm
0.09 kWh
3:00am
0.02 kWh
4:00pm
0.09 kWh
3:30am
0.04 kWh
4:30pm
0.10 kWh
4:00am
0.03 kWh
5:00pm
0.10 kWh
4:30am
0.03 kWh
5:30pm
0.11 kWh
5:00am
0.03 kWh
6:00pm
0.11 kWh
5:30am
0.03 kWh
6:30pm
0.11 kWh
6:00am
0.17 kWh
7:00pm
0.11 kWh
6:30am
2.92 kWh
7:30pm
0.11 kWh
7:00am
0.12 kWh
8:00pm
0.10 kWh
7:30am
0.09 kWh
8:30pm
0.09 kWh
8:00am
0.10 kWh
9:00pm
0.10 kWh
8:30am
0.09 kWh
9:30pm
0.10 kWh
9:00am
0.09 kWh
10:00pm
0.10 kWh
9:30am
0.09 kWh
10:30pm
0.11 kWh
10:00am
0.07 kWh
10:30am
0.09 kWh
11:00am
0.07 kWh
11:30am
0.09 kWh
The extra and missing hours make it look strange, but even so, there are only 23 hours’ worth of readings. Stranger still, there are only 23 hours recorded for 31 March the following year. As far as I can tell, billing comes out right in the end. I’m not charged for an hour’s worth of heating at the higher rate when I shouldn’t be.
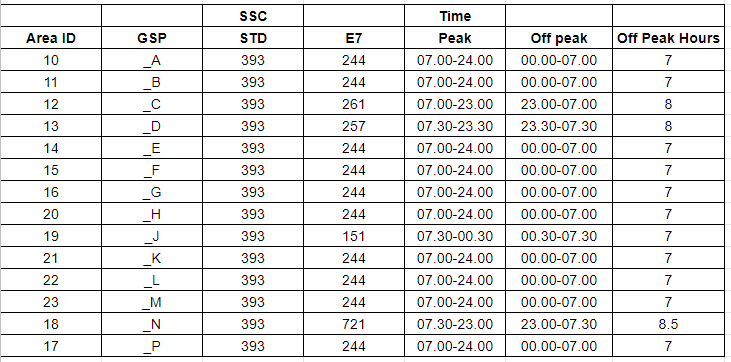
“… use this table below; the first two digits of your MPAN is the ‘Area ID’; the ‘Off peak’ times are on the column second from the right:
Then check physically whether the meter is recording peak- or off-peak-usage during the first or last hour of night-time according to the clock in your kitchen. Make allowances accordingly!
If you’ve found this article helpful, then we actually have a related idea created by another community member which you may find interesting and actually agree with. Check it out below and if you agree, feel free to Upvote the idea!
This is speculation on my part, but based on personal experience.
The peak/off-peak hours are set by the Distribution Network Operator (DNO), who know best how to balance their load. The timings are GMT all year round.
Some smart meters compensate for this when the clocks change, while others don’t. Some time switches powering off-peak equipment (e.g. storage heaters and immersion water heaters) also compensate, but it may take a manual adjustment to the timer clock to show the same time as other clocks in the house. It usually makes no real difference either way, unless you find that a heater is switching on at midnight when the cheap rate doesn’t start until 1AM (if this does happen, then the ON period should perhaps be adjusted to exclude the first and last hours of the advertised period).
It does however create a headache for those responsible for the usage and billing pages of the online account. This is my usage table for 30 October 2022:
Before midday
After midday
Time period
Usage
Time period
Usage
12:00am
-
12:00pm
0.08 kWh
12:30am
-
12:30pm
0.09 kWh
1:00am
0.07 kWh
1:00pm
0.18 kWh
1:30am
0.03 kWh
1:30pm
0.09 kWh
1:00am
0.03 kWh
2:00pm
0.09 kWh
1:30am
0.03 kWh
2:30pm
0.09 kWh
2:00am
0.03 kWh
3:00pm
0.09 kWh
2:30am
0.04 kWh
3:30pm
0.09 kWh
3:00am
0.02 kWh
4:00pm
0.09 kWh
3:30am
0.04 kWh
4:30pm
0.10 kWh
4:00am
0.03 kWh
5:00pm
0.10 kWh
4:30am
0.03 kWh
5:30pm
0.11 kWh
5:00am
0.03 kWh
6:00pm
0.11 kWh
5:30am
0.03 kWh
6:30pm
0.11 kWh
6:00am
0.17 kWh
7:00pm
0.11 kWh
6:30am
2.92 kWh
7:30pm
0.11 kWh
7:00am
0.12 kWh
8:00pm
0.10 kWh
7:30am
0.09 kWh
8:30pm
0.09 kWh
8:00am
0.10 kWh
9:00pm
0.10 kWh
8:30am
0.09 kWh
9:30pm
0.10 kWh
9:00am
0.09 kWh
10:00pm
0.10 kWh
9:30am
0.09 kWh
10:30pm
0.11 kWh
10:00am
0.07 kWh
10:30am
0.09 kWh
11:00am
0.07 kWh
11:30am
0.09 kWh
The extra and missing hours make it look strange, but even so, there are only 23 hours’ worth of readings. Stranger still, there are only 23 hours recorded for 31 March the following year. As far as I can tell, billing comes out right in the end. I’m not charged for an hour’s worth of heating at the higher rate when I shouldn’t be.
“… use this table below; the first two digits of your MPAN is the ‘Area ID’; the ‘Off peak’ times are on the column second from the right:
Then check physically whether the meter is recording peak- or off-peak-usage during the first or last hour of night-time according to the clock in your kitchen. Make allowances accordingly!
If you’ve found this article helpful, then we actually have a related idea created by another community member which you may find interesting and actually agree with. Check it out below and if you agree, feel free to Upvote the idea!
Noel | I have no official status; I'm just a volunteer who comes here to help other customers. My gear: Aclara SGM 1416-B Electricity-only E7 meter; Chameleon IHD3-PPMID-AAA | It may look as if I know what I’m talking about, but don’t let that fool you. |
A couple of weeks ago someone commented it’s hard to determine his Power Move as what he calculates doesn’t match what OVO says.
When I look at my usage the figure on the first screen doesn’t always match the second screen.
The difference here isn’t much, just 0.08 kWh, but sometimes it’s as much as 0.25 kWh. That doesn’t sound much, but it’s nearly 10% of my daily use. I know rounding will make a difference, but surely not that much? Most days it’s the same or 0.01/0.02 out. I wonder which is the correct useage?
Also, on occasion it doesn’t update correctly and shows I’ve used power between midnight and 1 in the morning but nothing else all day. This only started after the clocks went forward in spring. Could it be a timing issue?
None of this really bothers/affects me, I’m just curious. This could answer the chap’s comment, but search as I have, I can’t find the original post.
I meant to add to my last message is that the curious thing about the clocks issue is that it gets free hours and Power Flex events in the correct time periods.