Rank 12
October 29, 2025
Solved

How is data recorded on the online graphs and tables?

  • October 29, 2025
  • 51 replies
  • 761 views

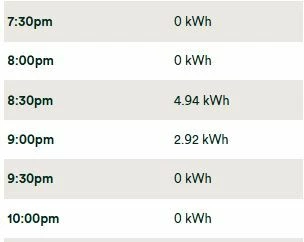
Here is an extract from the table showing my gas usage yesterday evening. As you can see, two values are recorded: 8.30pm and 9pm. If usage is recorded at 8.30pm, does this show what has been used between 8pm and 8.30pm or what has been used between 8.30pm and 9pm?

Best answer by Bendog

Today I have agreed to close the case I raised regarding the issue of missing data and the “data shift” issues. This is an extract from the reply I received from Dawn at OVO. 

Thank you for highlighting the "data shift" where your heating usage, which you observe coming on at 6:30 am, is recorded in the 6:00 am half-hourly slot. This is a known aspect of how smart meters and the data network report usage. The meter records consumption in a given half-hour period (e.g., 6:00:00 to 6:29:59) and then transmits that total. Depending on the exact timing of the meter reading and data processing, usage that begins at 6:30 am often falls into the total for the preceding 6:00 am slot. This inherent delay can indeed make precise real-time management of usage for specific initiatives challenging, and we appreciate your feedback on this.”

As you can see, OVO acknowledge this is a “known issue”. Knowing this, I wonder how and why it was decided to offer a “time of use” initiative for gas users. Earlier in the email, I was told that any missing data is a DCC issue. I still wonder why almost all of my missing data occurs at the same time. 

51 replies

Nukecad
Super User
Super User
November 21, 2025
  • I’m sceptical about ​@Nukecad‘s theory about the gas meter clock being stuck at ‘time of installation’. It must be part of the commissioning process to synchronize the meter’s internal clock with that in the CH; what happens subsequently is anybody’s guess. 

I freely admit that it’s an unsubstantiated theory - but can’t think of another that could account for the gas metering offsets that we are seeing?

There does seem to be a difficulty with understanding what the actual issue is, which will be why Ben_OVO got that wide-of-the-mark answer.

The issue here isn’t that the gas meter’s clock is out, it isn’t.
The issue is that the 30-minute usage data packages are not aligned to the clock half-hour.

As an example:

Imagine that my particular meter was commissioned at 6 minutes past a clock half hour. 

It records the next 30 minutes of usage data as being in the clock half hour where that 30 minutes data period started. Even though 6 of them were actually in the next clock half hour.

So a 30-minute data package that started at 06:36 would run untill 07:06 and so would record the fist six minutes of a CH boiler timed to come on at 07:00 as being used in the 06:30 to 07:00 clock time period.

I have checked the clock time set on my gas meter and it’s correct.*

However my readings still show the first six minutes usage in each clock half house as being used in the previous clock half hour. As in the example I give above.

The only reasonable way I can think to explain that is that the 30-minutes data collection period is not aligned with the clock half hour.

And the only reason that I can think of as to why such a misalignment might happen is the meter commissioning not being on the half hour.

To get the 30-minute usage logging to align with a clock half hour you would have to either-

  1. Start recording the first 30 minutes of data at the clock half hour before the meter was comissioned.
    or:
  2. Specify somehow that the first data period should be less than 30 minutes and should end on a clock half hour,
    or:
  3. Ignore anything used before the first encountered clock half hour, which isn't practical. It would mean the commissioning engineer hanging around until a clock half hour was reached so that they could check that the meter was measuring as it should do.

#2 would probably be the most practical way, but it doesn’t appear to work like that, and won’t do until someone (Ofgem?) sees the offset as being a problem that needs to be addressed.

*PS. Thinking about that, if support sends a "Set Clock" command that would just reset the clock, it wouldn't have any effect on the observed usage merering offset.

PPS. Until someone comes up with another, reasonable, theory to explain why the gas usage data periods are observably misaligned to the clock half hour then I'll stick with my theory.


I said, Hey - Watts going on.
BendogAuthor
Rank 12
November 21, 2025

i can only agree with your comments there.

TBH though gas is a fossil fuel and so doesn’t fit in with the OVO ‘Plan Zero’ ethos.

You can sort of see why they obviously regard gas as second class; and would probably not have anything to do with it if they could get away with dropping it and selling electricity only.
But of course that would risk losing customers who prefer to have one supplier for both fuels.

PS, Here’s an off the wall thought about fossil fuels.
Gas, Coal, and Oil, are in fact renewable fuels. It just takes a very, very, long time for them to renew. (much longer than it takes to burn them).

I do understand that OVO are not really interested in those of us who use gas, so why did they not just institute another electricity saving period? Since most people, if they have gas with OVO also have electricity, it would have been simple and OVO would not have received copious amounts of data and images from me for something worth a maximum (on my tariff) of about 60p per week. This whole thread would have been unnecessary too!!

I love your final comment, however!


Nukecad
Super User
Super User
November 22, 2025

When I first read the Terms of the offer and realised it was for gas and not electricity I predicted that it would cause issues. (Although I didn't see this metering offset cropping up again).

I think that we are still waiting for the confusion posts from those who will be expecting 10 kWh of free electricity to be credited this month. You just know that people don't read things properly.

I said, Hey - Watts going on.
BendogAuthor
Rank 12
November 23, 2025

I feel a bit of an intruder in this thread because, gas not having been invented in this part of the world yet, I’ve no personal experience of gas meters to go by. However, here are a couple of general remarks:

  • I honestly can’t tell from the red figures in ​@Bendog‘s table whether he’s missing all the data for some days or just between noon and midnight. I just don’t seem able to say at a glance whether 12:00 AM/PM refers to noon or midnight - to this old dog, 12:00 will always be noon - the Meridian to which the ‘M’ in AM and PM refers.


This is how OVO’s online Portal (not the app) displays the half hourly data. When we are on BST or GMT, this is how those missing time slots appear to me using the online Portal.

This leads me to assume that OVO do not, in fact, manage the changes that occur twice a year, every year, on an easily predicted date.

Firedog
Super User
Super User
November 23, 2025


This is how OVO’s online Portal (not the app) displays the half hourly data.
 

This leads me to assume that OVO do not, in fact, manage the changes that occur twice a year, every year, on an easily predicted date.
  

Right. I’d forgotten that the online usage data tables have that infuriating way of displaying times. I only ever see the ones I get from n3rgy, where I also see three decimal places for the kWh values. It helps, of course, to see 12:00am in context. It’s done nicely in the app, just the other way up for some reason.

It took me some time to work out what you were illustrating with the ‘missing data slots’ images. I think you’re pointing out that the data for the last hour of the day were transferred to the first hour - is that it? If so, that was - I thought - corrected last March. If you examine the underlying data, when the website calls for data for a particular date during BST, the code now returns data for the 24 hours starting at 23:00 the previous day:


The first two nodes here are displayed at the website with labels 12:00am and 12:30am; quite inexplicably, 0.069 becomes 0.07 kWh and 0.026 > 0.03 kWh:


Have you found out why gas data are missing for specific periods most days? Comparing with what Bright returns would confirm whether the fault was at your end or at OVO’s.
  

Noel | I have no official status; I'm just a volunteer who comes here to help other customers. My gear: Aclara SGM 1416-B Electricity-only E7 meter; Chameleon IHD3-PPMID-AAA | It may look as if I know what I’m talking about, but don’t let that fool you. |
BendogAuthor
Rank 12
November 24, 2025

Have you found out why gas data are missing for specific periods most days? Comparing with what Bright returns would confirm whether the fault was at your end or at OVO’s.
  

This image shows what is displayed on the online OVO Portal compared with what is displayed, for the same date and times, on the Bright app.

It is also something that does not happen every day but, it seems, on random dates. 

Firedog
Super User
Super User
November 24, 2025

OK, so OVO and Bright agree on the timestamps, but Bright apparently don’t differentiate between ‘null’ (no data) and ‘0’ (value is zero), so that doesn’t help much - sorry! I’m guessing that when this happens, you see a null value even though there has actually been consumption in the period. I’m not sure, but in this scenario I’d expect the unreported usage to be notified to the CH when normal service was resumed, in the spirit of ‘better late than never.’

I can’t find any instance in my own records of null values, so I can’t check how they might be reported by a different user, e.g. n3rgy. 

Noel | I have no official status; I'm just a volunteer who comes here to help other customers. My gear: Aclara SGM 1416-B Electricity-only E7 meter; Chameleon IHD3-PPMID-AAA | It may look as if I know what I’m talking about, but don’t let that fool you. |
BendogAuthor
Rank 12
December 24, 2025

Update (of sorts) Another person, today, has taken over “my case” (and then left for the “holidays” at 2.30 pm).

However, this is what I have now been told: “I understand you would want to know what you have used in that time, however, after speaking with a tech Specialist, I was advised the online usage chart and app, are add ons. This was explained to me as, they are not a requirement of service and do not impact or affect your supply and are provided as a tool to help understand usage. It was explained to me also that much like mobile phones and wifi, the signal can be interrupted sometimes and if the signal has been interrupted, there is nothing we can do to alter that.”

I understand that signals may be interrupted, sometimes, but WHY would it happen at the same time every time it does happen and why would it happen on random days? 

The final assessment was that this was going to be the likely resolution: “It may be I am simply going to reach out to advise you it is nothing more than a signal issue that is unresolvable. I just want to be realistic and upfront from the start and not give any false information.”


The image shows that recorded electricity usage never suffers the same issue. It shows the daily data I have collected from the online portal from December 1st - 22nd. 

Firedog
Super User
Super User
December 25, 2025

Fascinating stuff, for which I’ve no explanation. Just a couple of suggestions:

  1. I wonder if there’s a difference between zero and null (in your table, ‘0.00 kWh’ and ‘-’). It’s possible that the meter records zero for anything less than 0.01 kWh, but null for anything less than, say, 0.002 kWh. We see this sort of ‘negligible’ report in, for example, the electricity meter’s ‘anti-creep’ performance. If you turn off everything at the CU, the meter’s LED impulse counter will probably show solid red. This indicates not that there’s no electricity flowing through it, but that there’s a flow of less than, say, 40 mA (the figure for my own Aclara meter). If this is logged anywhere, it might show a difference between real zero and null (i.e. < 40 mA).
  2. Since the times of these null readings are pretty uniform when they happen, could there be interference with the gas meter’s Zigbee transmission that happens just at these times? Something emitting EMF radiation close by that turns on and off at these times? I can’t think of anything specific, but - outside security lights? Electric blanket before bedtime? Or perhaps another intermittently-operating Zigbee device? The gas meter’s signal is tiny (it has to be, to conserve battery power in the meter), so susceptible to tiny variations in the ubiquitous EMF radiation just slightly different from the rest of the day. The Zigbee transmitter will in general pick the best channel to use, but I’ve no idea how often it checks. Again, it can’t be too often because battery - perhaps daily, say. A Zigbee expert might come along to tell us. Meanwhile, you could waste several hours trying to make sense of discussions like this one: I tracked channel utilization with ZHA to find the best Zigbee channel - Configuration / Zigbee - Home Assistant Community
Noel | I have no official status; I'm just a volunteer who comes here to help other customers. My gear: Aclara SGM 1416-B Electricity-only E7 meter; Chameleon IHD3-PPMID-AAA | It may look as if I know what I’m talking about, but don’t let that fool you. |
BendogAuthor
Rank 12
December 26, 2025

Fascinating stuff, for which I’ve no explanation. Just a couple of suggestions:

  1. I wonder if there’s a difference between zero and null (in your table, ‘0.00 kWh’ and ‘-’). It’s possible that the meter records zero for anything less than 0.01 kWh, but null for anything less than, say, 0.002 kWh. We see this sort of ‘negligible’ report in, for example, the electricity meter’s ‘anti-creep’ performance. If you turn off everything at the CU, the meter’s LED impulse counter will probably show solid red. This indicates not that there’s no electricity flowing through it, but that there’s a flow of less than, say, 40 mA (the figure for my own Aclara meter). If this is logged anywhere, it might show a difference between real zero and null (i.e. < 40 mA).
  2. Since the times of these null readings are pretty uniform when they happen, could there be interference with the gas meter’s Zigbee transmission that happens just at these times? Something emitting EMF radiation close by that turns on and off at these times? I can’t think of anything specific, but - outside security lights? Electric blanket before bedtime? Or perhaps another intermittently-operating Zigbee device? The gas meter’s signal is tiny (it has to be, to conserve battery power in the meter), so susceptible to tiny variations in the ubiquitous EMF radiation just slightly different from the rest of the day. The Zigbee transmitter will in general pick the best channel to use, but I’ve no idea how often it checks. Again, it can’t be too often because battery - perhaps daily, say. A Zigbee expert might come along to tell us. Meanwhile, you could waste several hours trying to make sense of discussions like this one: I tracked channel utilization with ZHA to find the best Zigbee channel - Configuration / Zigbee - Home Assistant Community

We now have only solar powered outside security lights. We did this as we had one wired in that had no off switch facility in the house, not even via the fuse board!! It was wired into a permanently live feed in the garage for which we could find no other use, so we had it disconnected. However, this has made me think about what we do have that is set to go off every night at 11pm - our Hive heating controls. I think we will change that to midnight from tomorrow to see if that has an effect on when these “signal interruptions” happen. I do not have any data from before our smart meters were installed, of course and our boiler, radiators and all associated controls were installed only two weeks before the smart meters, anyway,

However, this would not explain the fact that this “null read” happens one hour later during BST as the Hive controls compensate for that.