
I hereby start a new thread, with a link to Open Energy Monitor.
I blame the interest shown by
I hereby start a new thread, with a link to Open Energy Monitor.
I blame the interest shown by
...
Can I ask that we leave this Monitoring subject alone here, rather than get distracted from solar panels. If anyone knows more about Modbus networks and the SCADA software used to handle the commands and data, then please send me a PM ![]()
Energy monitoring needs to be a separate topic on its own.
I can’t help with modbus, but see that it’s mentioned by a fair few users of the Open Energy Monitor system on their forum.
A separate thread on energy monitoring could perhaps start by looking at OEM (if there would be any interest here...)
And
Or would this be more specific to generation?
 +2
+2Thanks for picking this
That Home Assistant topic is different to what I’m raising here.
I’m looking at using digital metering to provide data which can be stored and analysed. That data should enable ‘us’ to develop home-based energy usage devices which
That’s not the same as the ‘Smart Home’ devices which enable a light to be turned on with a voice command or charge your EV with enough electricity for your trip the next morning. Users with Smart Home devices tend not to know (or care) what affect it has on their energy budget. They are persuaded by slick marketing rather than joule-counting.
The Open Energy Monitor forum link which
… I just need time to get stuck into it. ![]()
But we need to avoid expanding on that subject within this topic.
I have more to post here about PV Inverters and I don’t think it wise to swamp such useful information by surrounding it with discussions on energy monitors.
A separate thread on energy monitoring could perhaps start by looking at OEM (if there would be any interest here...)
And
Or would this be more specific to generation?
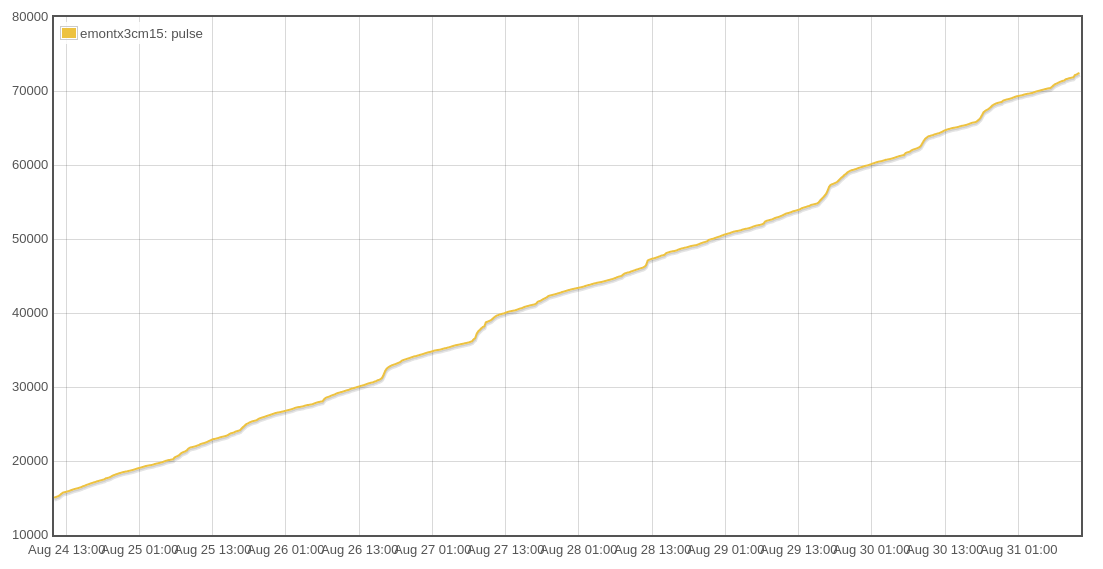
Yes, Open Energy Monitor is separate from Home Assistant, and it’s not specific to generation. There is a huge amount of information about OEM on their website, which I won’t try to repeat, but perhaps a few images will give some idea. It monitors supply voltage using its AC mains adaptor and combines this with readings from a current transformer to obtain an estimate of power drawn, every 10 seconds, and my history from setup looks like this:
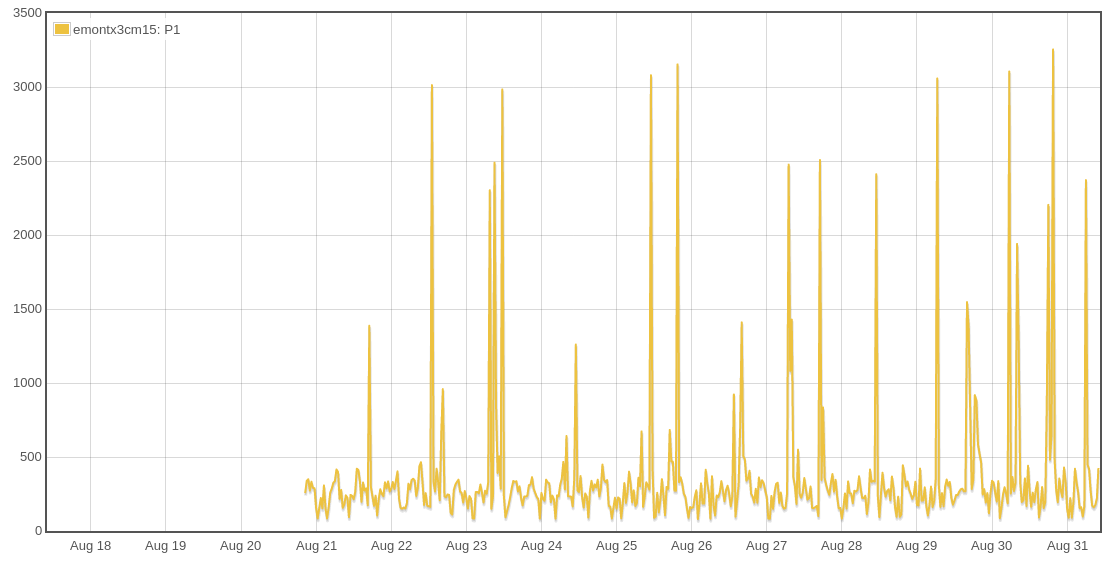
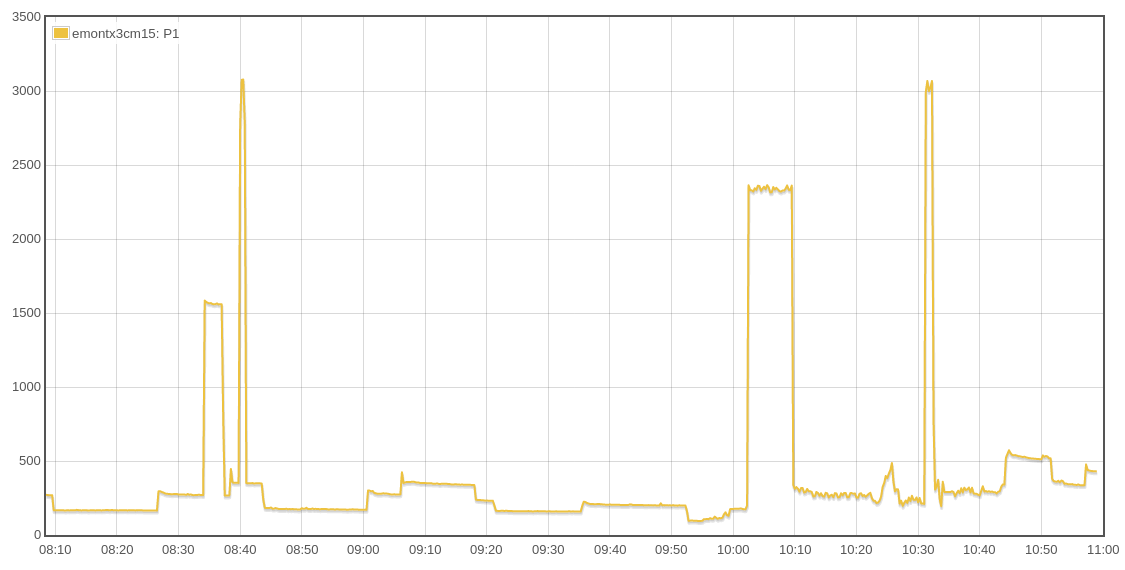
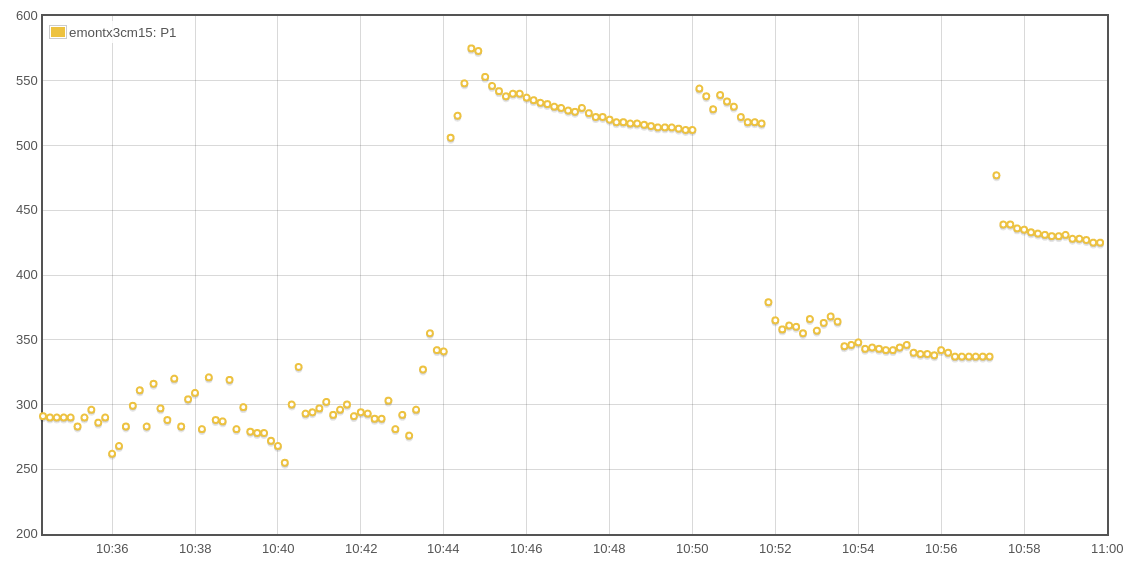
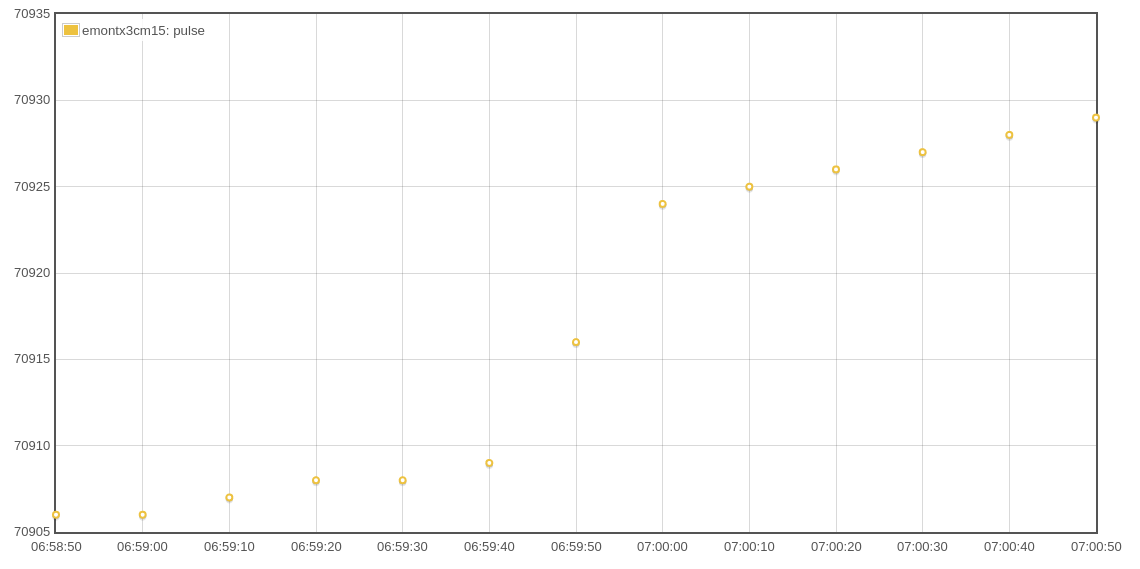
Zooming in a few times:
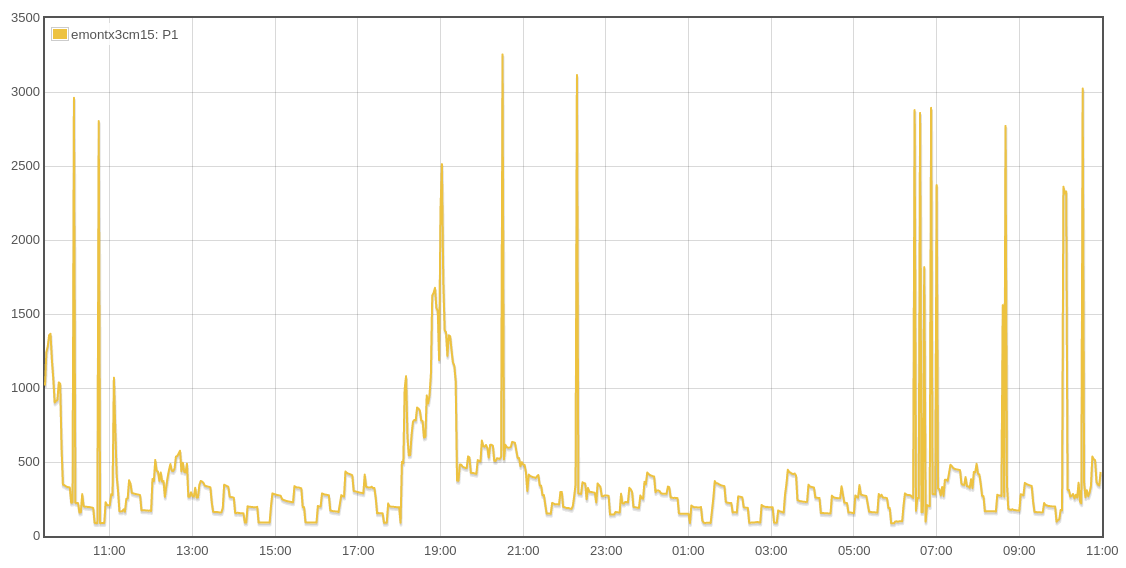
The only other sensor I have counts the LED pulses on the SMETS2 meter:
That’s 1000 pulses per kWh, so this is like a high resolution plot of meter reading (in Wh) vs time. It also has 10 second resolution:
The power drawn then was…
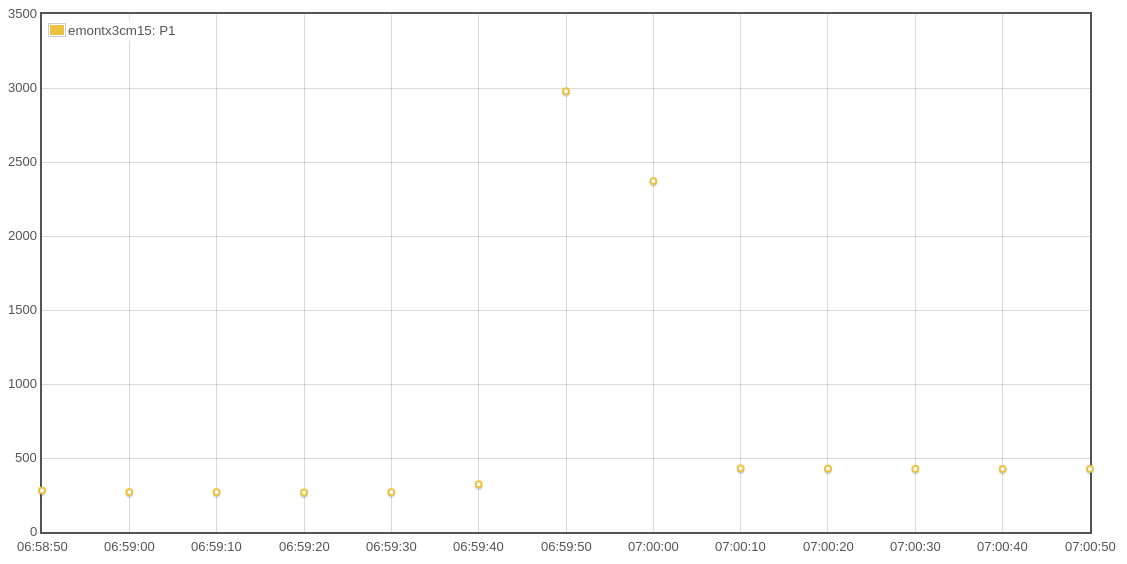
So far, so boring. OEM users with solar panels, batteries, heat pumps, etc. (I have none of these) can add more sensors and keep track of what those are up to.
Potentially, it gives far more insight than mere smart meters ever can. And, of course, those who are into home automation can link this into their Home Assistant, Node Red, or whatever else they might have.
The key to it all is that both hardware and software are open source (free as in freedom), and if you don’t feel up to building hardware yourself, it’s all available to buy in their online shop. So it gets more difficult if your battery from Tesla is resolutely proprietary and non-open, but those who try seem able to get something out even from them.
I’ll stop here, partly because I don’t want this to turn into a sales pitch, but mainly because the system is very new to me. It’s been in development for nearly 10 years and (evidently) the community of users have a lot of both good ideas and competence.
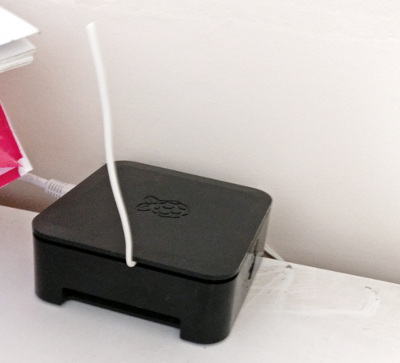
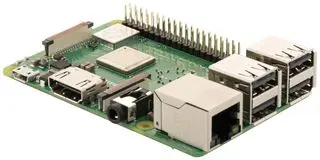
The monitoring thing:
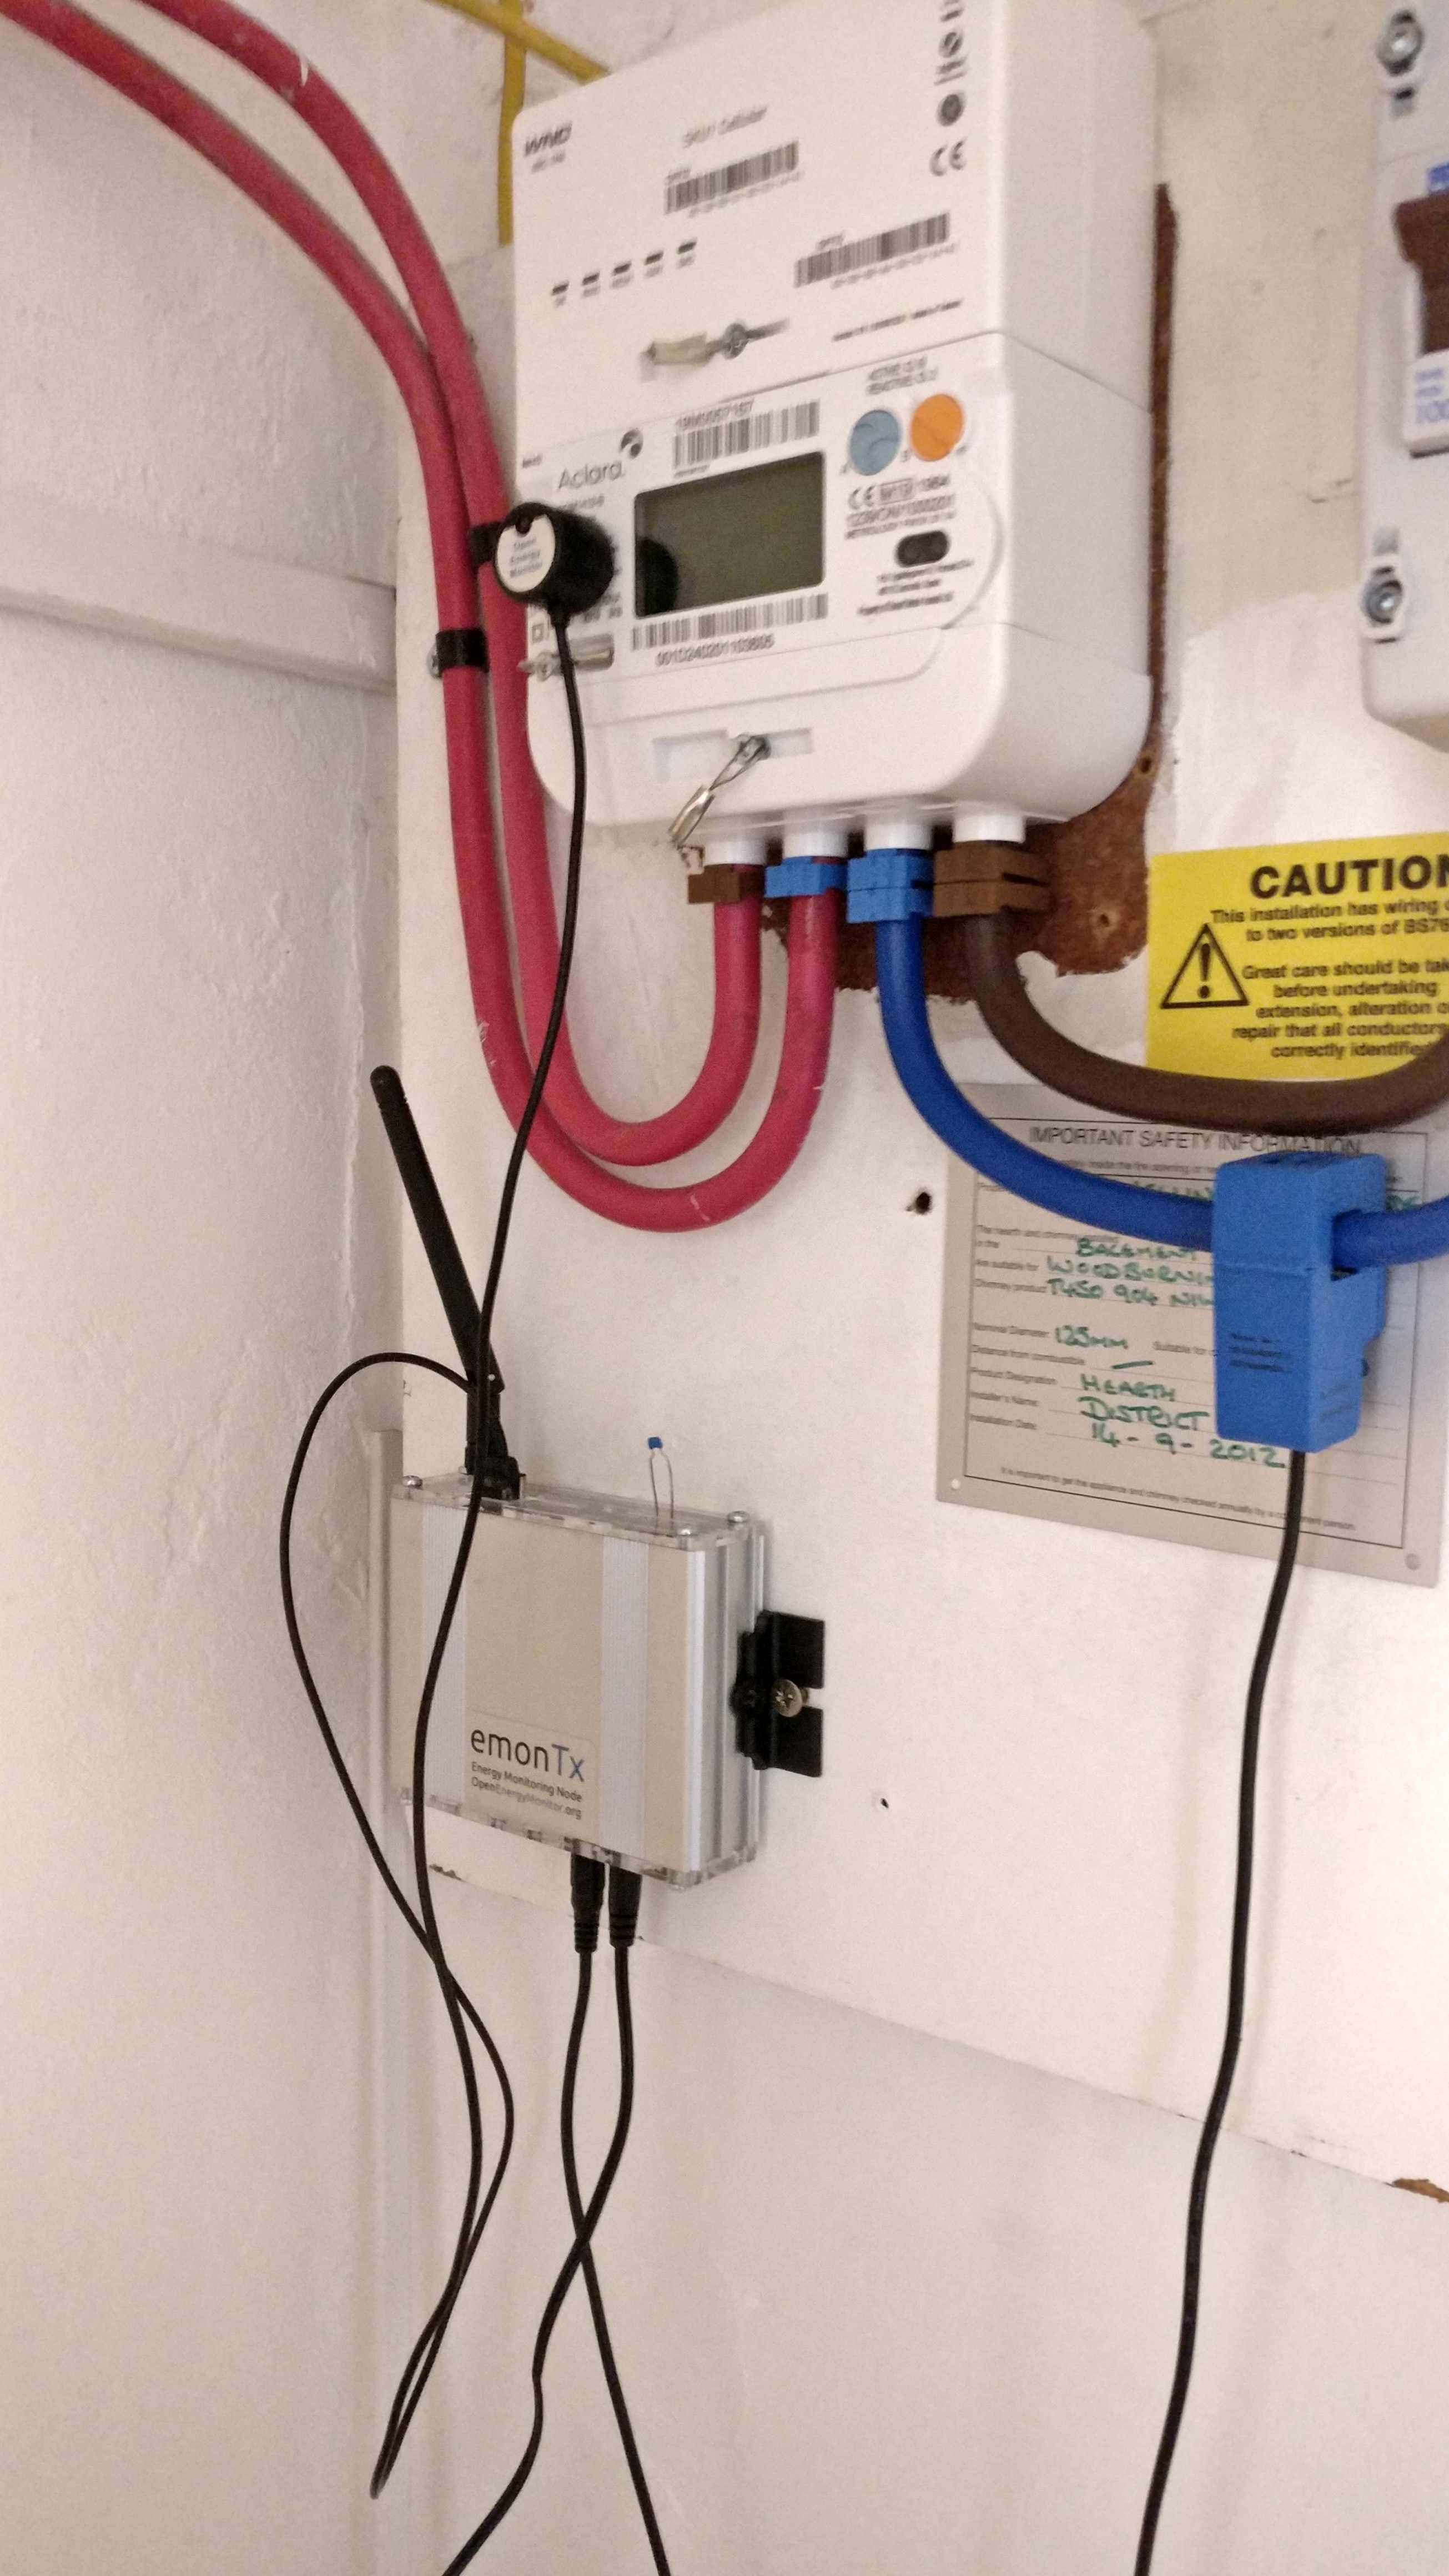
talks to a Raspberry Pi over RF, (this was an Rpi3 that I already had - I only had to buy the RF add-on) which is what does all the server stuff and is accessible over WiFi.
If nothing else, it’s like having a souped up IHD that works anywhere.
 +2
+2At which point,
At which point,
I’ve just started a thread already,
New thread now combined with related comments. In case this is missed,
Thanks for the info
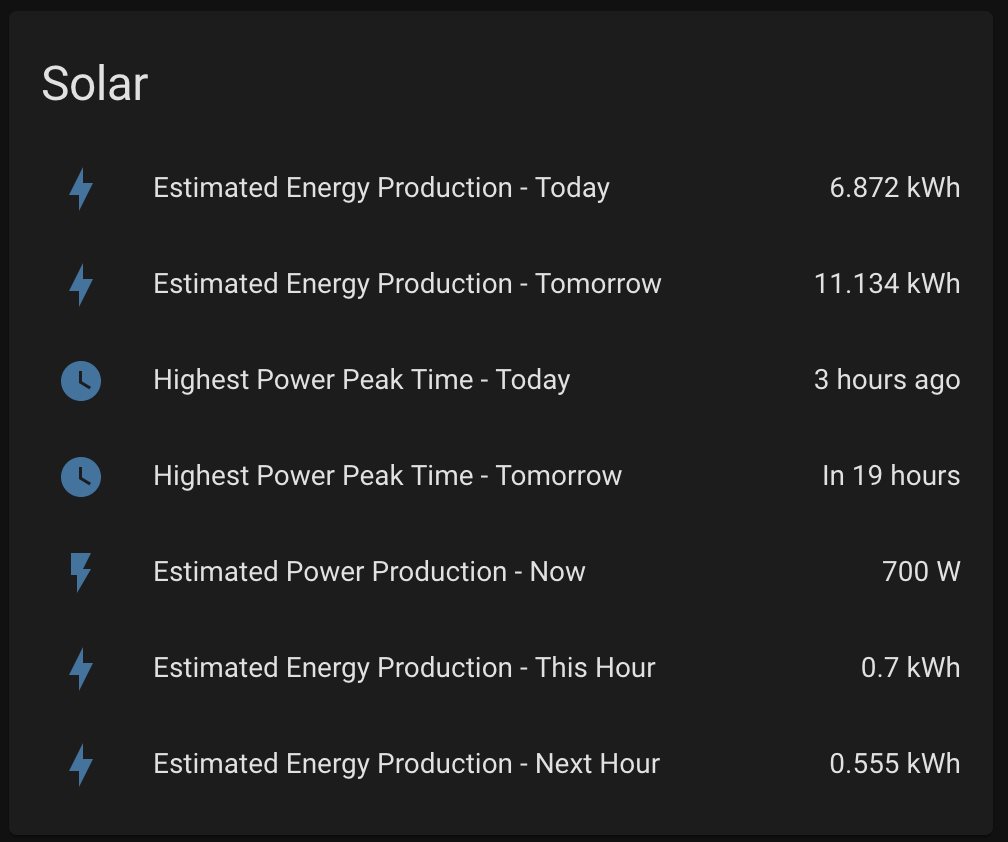
I noticed there’s a forecast.solar integration for Home Assistant which predicts an estimate of your solar capture just using your location and some internet-based metereological service. This isn’t monitoring, it’s predicting.
New thread now combined with related comments. In case this is missed,
Perfect. Many thanks for moving that exchange of comments,
I can procrastinate no longer. I have a little to-do list of steps needed to finish off the setting up of my OEM system. Full disclosure (not that I’m putting pressure on myself, or anything):
What I haven’t looked into yet is setting up the MyElectric “app” that presents a souped up IHD-like display on a web page or mobile device (smartphone, etc). This is the kind of thing that the utility company would provide, and which would change whenever one switches supplier. No longer - it would present the information I want, not what they think I want.
I noticed there’s a forecast.solar integration for Home Assistant which predicts an estimate of your solar capture just using your location and some internet-based metereological service. This isn’t monitoring, it’s predicting...
Indeed it is. There’s a huge amount of stuff that is way beyond anything I’ve got my head around so far, and the monitoring of energy is only a small part of it all.
The heatpump monitoring stuff will surely be of interest to some on here, as will the monitoring of solar PV.
...
Can I ask that we leave this Monitoring subject alone here, rather than get distracted from solar panels. If anyone knows more about Modbus networks and the SCADA software used to handle the commands and data, then please send me a PM ![]()
Energy monitoring needs to be a separate topic on its own.
I can’t help with modbus, but see that it’s mentioned by a fair few users of the Open Energy Monitor system on their forum.
A separate thread on energy monitoring could perhaps start by looking at OEM (if there would be any interest here...)
And
Or would this be more specific to generation?
I use Home Assistant with modbus to get my solar data from the Solaredge inverter.
+2Thanks
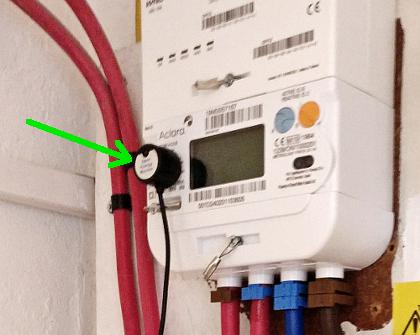
a: the blob on the front of your Smart Meter which you refer to as the Optical Pulse Sensor
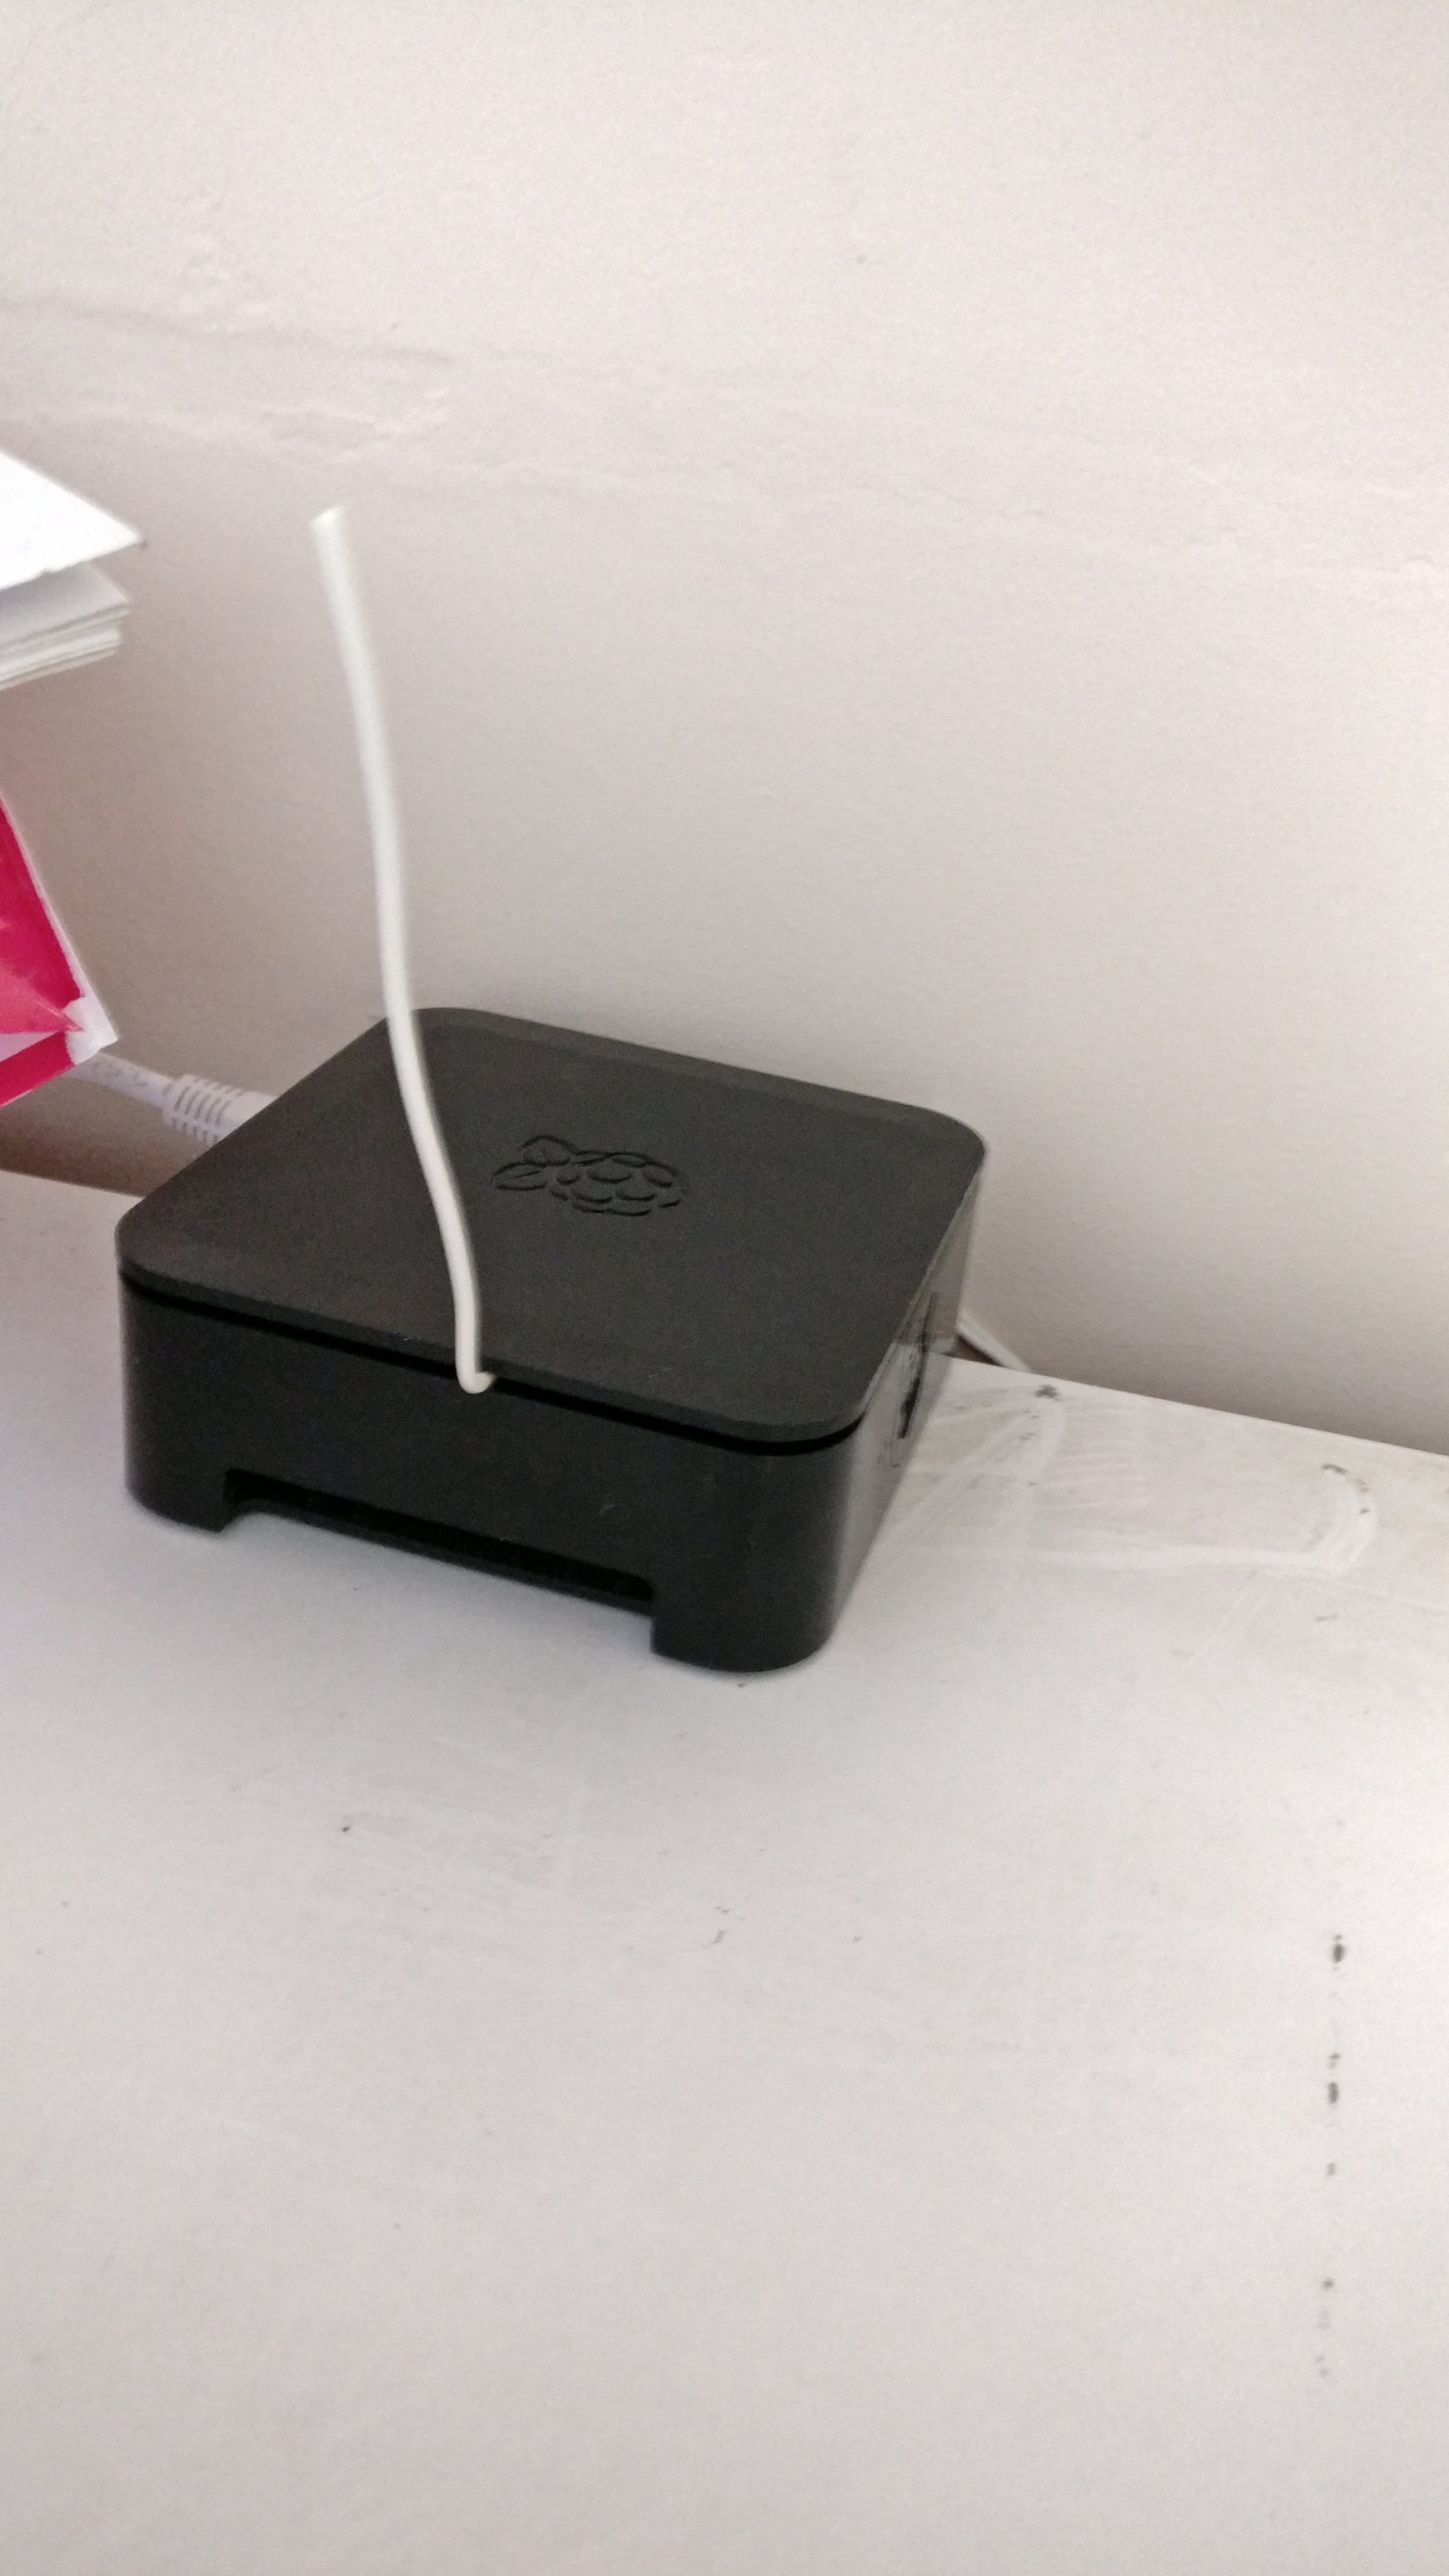
b: the contents of the black box with the sticky-up white wire
c: How you are getting those graphs from the black box… without using the phrases
Hopefully that gives the Moderators a fighting chance of keeping up on where we’re heading with all this.
Thanks
Will do my best,
a: the blob on the front of your Smart Meter which you refer to as the Optical Pulse Sensor
Like many/most/all smart electricity meters, mine has a lot of LEDs that flash from time to time. One of these relates to the energy supplied. Here’s a photo I took before attaching the “optical pulse sensor”:
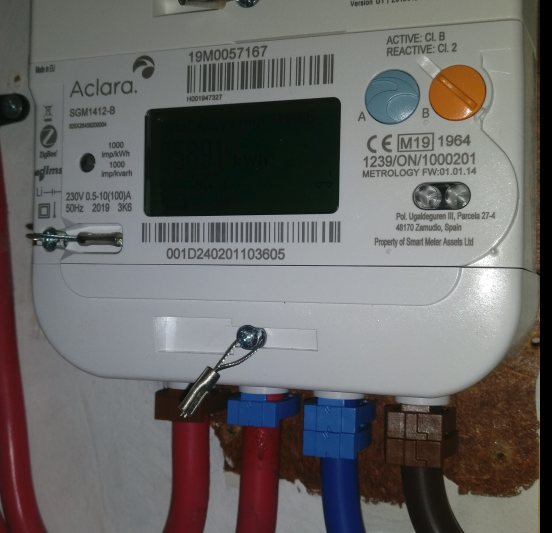
Zooming in a bit
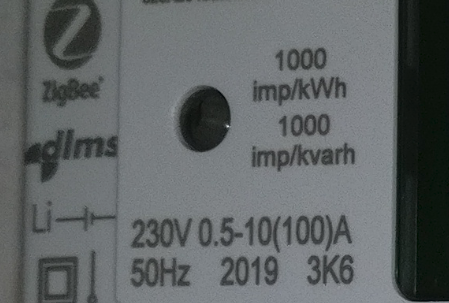
That black hole by the “1000 imp/kWh” label has a red LED that flashes once every time the total energy supplied goes up by another 0.001 kWh. There is more detail here https://shop.openenergymonitor.com/optical-utility-meter-led-pulse-sensor/
That sensor produces an electrical signal. Out of curiosity, I tried to measure the signal that came from one LED pulse with an oscilloscope. Here is the result:
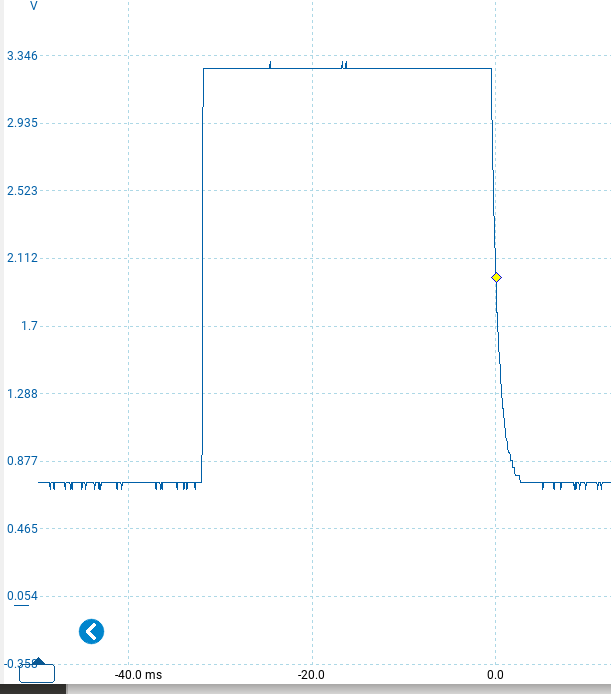
This is not a feature of the standard OEM system. I (now) have my own PC oscilloscope.
That, and the signals from any other sensors are fed into a box of tricks called “EmonTx”, also described in more detail here
https://shop.openenergymonitor.com/emontx-energy-monitor-transmitter/
which broadcasts that information on a 433 MHz radio signal that can get through the brick wall to the black box on the other side.
b: the contents of the black box with the sticky-up white wire
The sticky-up white wire is just the radio aerial on this:
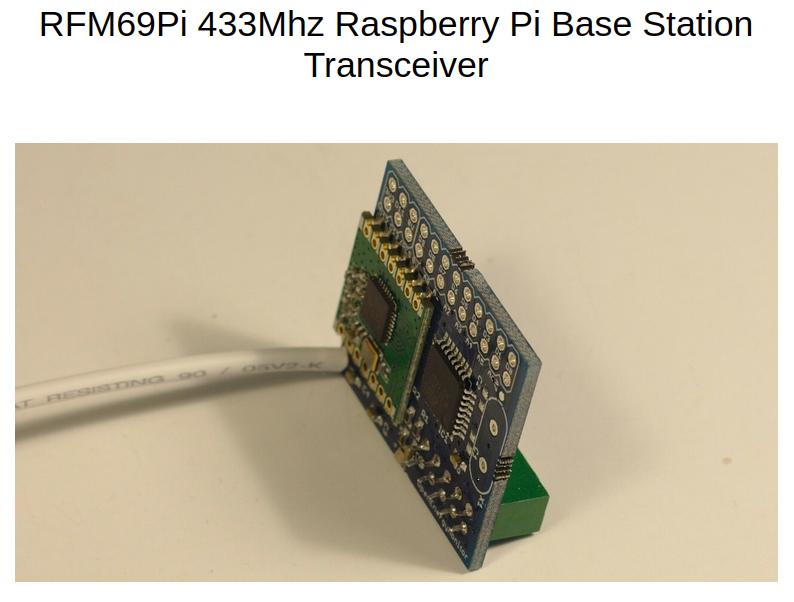
described here https://shop.openenergymonitor.com/rfm69pi-433mhz-raspberry-pi-base-station-transceiver/ which I attached to my Raspberry Pi3 (the only other thing inside that black box).
c: How you are getting those graphs from the black box… without using the phrases
There was a one-time only process of setting things up, in which I told the Pi how to connect to my home Wi-Fi network (it remembers the network name and password, etc.)
This system is running all the time. I can look at it from my laptop by pointing a web browser at http://emonpi.local, I log in and am presented with a “dashboard” offering a summary of how things are.
OK. I confess that last sentence is a lie - I haven’t actually set up a “dashboard” yet, I just get a menu of inputs (an “input” has usually has sensor data, a value that changes every 10 seconds) and feeds (a “feed” is what you get if you keep track of an input over a period of time - i.e. timeseries data such as can be plotted:
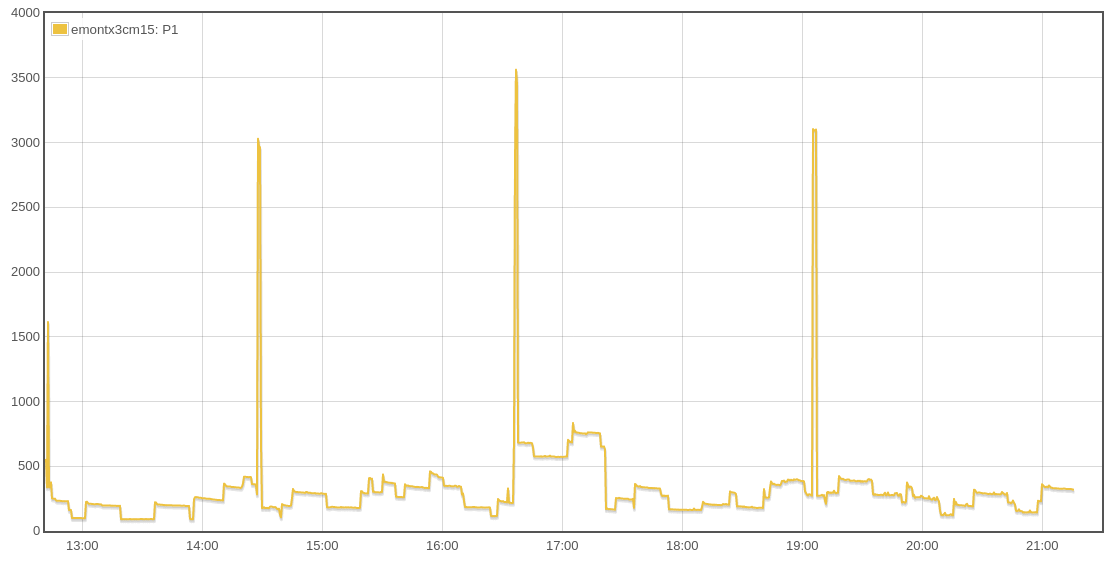
and one of the things I can do with a feed is look at it. That is how the graph appears on the screen, and I can then zoom in, plot and compare multiple feeds, etc. to my heart’s content.
+2For the sake of others who come across this topic in the following months, may I point out that the Raspberry Pi is a British-designed micro-controller board. It uses the ARM processor family, originally created by Acorn Computers Ltd and most often found in smart-phones.
The Raspberry Pi Foundation has its own website with lots of background information and projects to get you started.
The two main suppliers of Raspberry Pi boards and add-on modules in the UK are
Although the Model-4 is the latest iteration of the Pi, you will note that
The Pi is a complete computer which can run a number of operating systems, although most users choose Raspberry Pi OS, derived from Debian Linux.
The board allows connection of a monitor (via HDMI), keyboard, mouse, network and solid-state drives. As you can see from
...
Although the Model-4 is the latest iteration of the Pi, you will note that
Thanks
I do like free software (free as in beer, as well as free as in freedom).
Those that prefer to buy a card preloaded with this image will find it here. If you only have the even earlier Model-2 Pi (no longer available to buy?) OEM say Emoncms will run on that too.
For what it’s worth, I downloaded and played with the Emoncms software for a day or two before deciding to buy the hardware (sensors, etc). In this way, it is possible to get some idea of the capabilities of the system (within a day of such playing, I was convinced that it was worth trying for real).
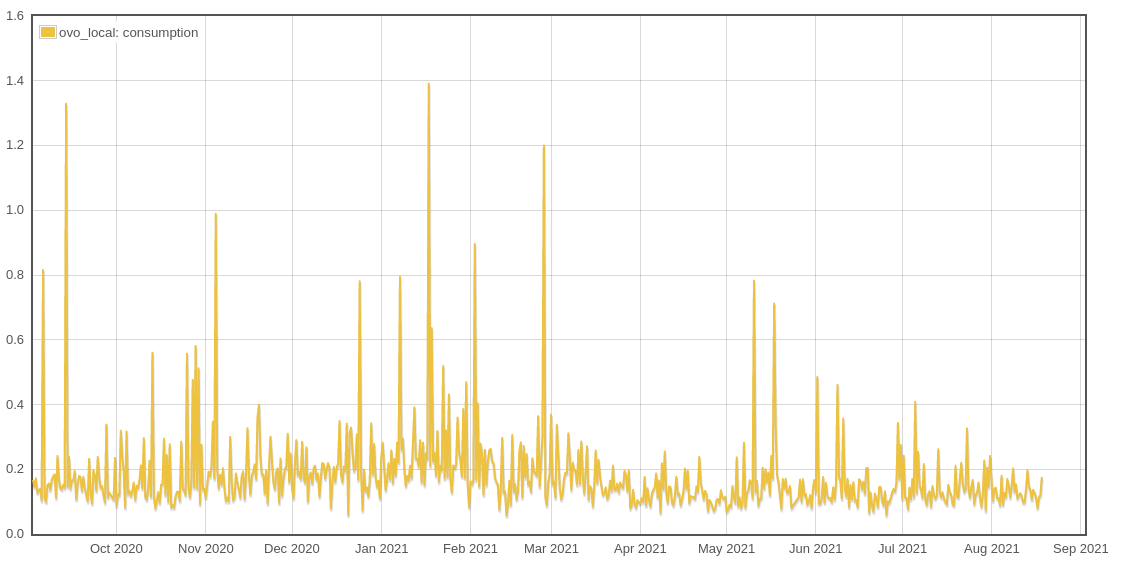
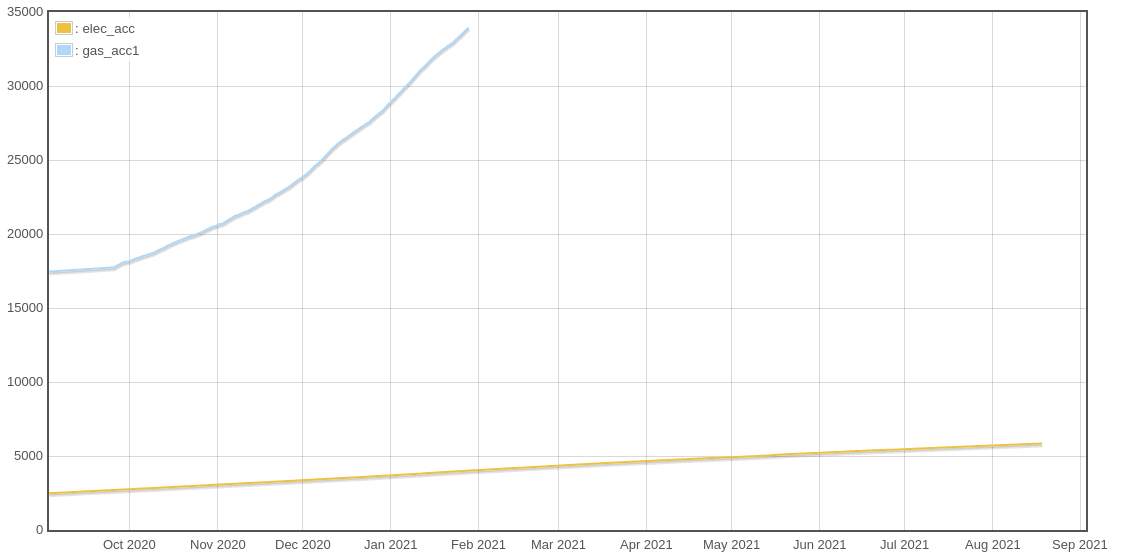
For instance, I worked out how to upload my own Ovo smart meter data and review it all in Emoncms. Here, for instance, is the not-quite-up-to-date electricity consumption (these are kWh per half-hour) over the past year
And the same for gas (kWh per half-hour):
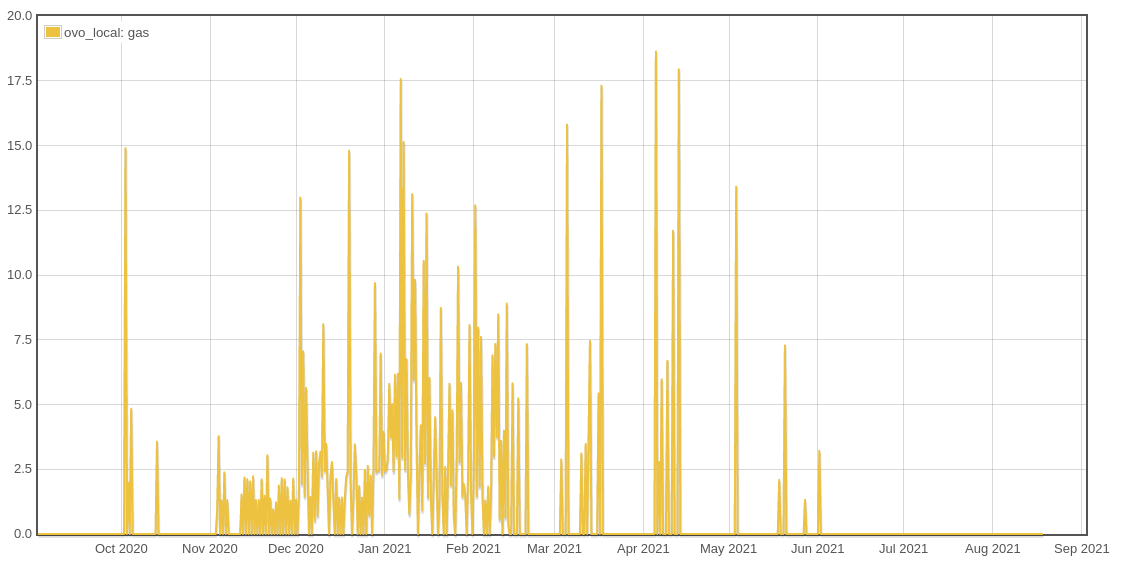
[There are no MAXINT values in this period]
Such fun to be had …
I have been known on here to advocate ways to look at “usage”, other than kWh/half-hour (better perhaps to call this “demand”, and express it in W), such as meter reading (or “consumption”, in kWh). Inevitably, Emoncms can do the sums to convert one into the other:
I’ve no doubt it could look up the national grid’s CV data and recover gas volume in m^3, with a bit of effort. Perhaps not surprisingly for a monitoring system, Emoncms is not very tolerant of missing data (my gas data on My Ovo has a lot of gaps), and is very ready to decide that a feed is “inactive” and abandon processing it. This is why the gas kWh stops after a few months.
I now have no need to create my own software to review data as I want to. Emoncms appears to be already set up to do what I want. This gives me an extra incentive to solve Ovo’s problems with missing data ;-)
...
Can I ask that we leave this Monitoring subject alone here, rather than get distracted from solar panels. If anyone knows more about Modbus networks and the SCADA software used to handle the commands and data, then please send me a PM ![]()
Energy monitoring needs to be a separate topic on its own.
I can’t help with modbus, but see that it’s mentioned by a fair few users of the Open Energy Monitor system on their forum.
A separate thread on energy monitoring could perhaps start by looking at OEM (if there would be any interest here...)
It is ages since I have used Modbus (both the protocol and I were a long younger...), but I am happy to help where I can. It is not a difficult protocol, and it very much follows a standard read / write access model. One of the things to be aware of is that it does not support consistent snapshots, so that needs to be handled on the application layer (nasty!).
+2That’s good news
I don’t understand SCADA software nearly well enough (yet). Most offerings seem vastly too complex for the level of energy information we’d like to have available for most Forum Members. I think we need something open-source (free) and supported by a group of enthusiasts.
Most SCADA software is expensive and includes ongoing licences/maintenance contracts. Ugh!
I spent about 2 hours yesterday reading through the various solutions being offered by the Open Energy Monitor project. I’m now at the point of ordering some bits, although I’ll be using wired connections, rather than the 433MHz link which
At this moment in time I haven’t yet discovered if the OEM Project hardware/software has any possible option to run an RS485 (Modbus) channel.
Everything I read yesterday concerns the use of three input devices:
In other words, this is doing only monitoring, and no controlling or configuring. What I’d also like to see is Modbus devices being implemented for
So that’s where I’m currently at.
And a note to
Let’s not worry for the moment how the customer acquires the device and the cost. I already have some possible solutions.
But first let’s see if we can better understand these (relatively cheap) monitors and learn how to configure them to provide useful/interesting data.
…
I spent about 2 hours yesterday reading through the various solutions being offered by the Open Energy Monitor project. I’m now at the point of ordering some bits, although I’ll be using wired connections, rather than the 433MHz link which
At this moment in time I haven’t yet discovered if the OEM Project hardware/software has any possible option to run an RS485 (Modbus) channel
….
But first let’s see if we can better understand these (relatively cheap) monitors and learn how to configure them to provide useful/interesting data.
I see you’re as easily persuaded as I was ;-)
I look forward, where useful, to comparing notes on our respective experiences …
Modbus isn’t of direct interest to me, so I didn’t follow much beyond that link, but they strike me as a very welcoming and helpful community of users at OEM, so if I were you, I wouldn’t hesitate to post your questions sooner rather than later,
BW
+2Oh I didn’t take much persuading,
I’m on the OVO PowerVault trial of Storage Batteries, but the battery unit itself has no integral monitoring. Instead this is delivered via a ‘live’ graph from their website. But that graph incorporates digital filtering. So although I can sometimes momentarily see anomalies, such as drop-outs, these get ‘smudged’ as they are amalgamated with following readings.
I’ve also been monitoring a local substation for the past 3 years - a project which Western Power is now funding when the original grant from Ofgem ran out. There are eight community groups who have access to these smart transformers.
Due to that background, Western Power have kindly run a 3-phase feed to my house. Although I continue to use only single phase, I can have access to the other two for monitoring purposes. So that presents a whole host of useful data for investigation ![]()
+2Update: I’ve just found that there is a Modbus interface listed in the OEM Shop.
If the hardware connection has been developed, then I must assume that there is some software support for it!
I’m adding it to the order about to be placed, and I’ll have a look at the software later.
Oh I didn’t take much persuading,
I’m on the OVO PowerVault trial of Storage Batteries, but the battery unit itself has no integral monitoring. Instead this is delivered via a ‘live’ graph from their website. But that graph incorporates digital filtering. So although I can sometimes momentarily see anomalies, such as drop-outs, these get ‘smudged’ as they are amalgamated with following readings.
I’ve also been monitoring a local substation for the past 3 years - a project which Western Power is now funding when the original grant from Ofgem ran out. There are eight community groups who have access to these smart transformers.
Due to that background, Western Power have kindly run a 3-phase feed to my house. Although I continue to use only single phase, I can have access to the other two for monitoring purposes. So that presents a whole host of useful data for investigation ![]()
That all sounds like it’ll keep you busy for a while.
Have fun!
+2I’m hoping this will keep US busy for a while. We have different skill sets and will need to collaborate! ![]()
I’m hoping this will keep US busy for a while. We have different skill sets and will need to collaborate! ![]()
Rest assured, there are few things I enjoy more than collaboration :-)
Tagging in
... I have a little to-do list … :
Roughly speaking, “cleaning up” the data involves things like the following...
For electricity data, one combines actual meter readings (the ones taken at the end of each billing month, i.e the ones printed on bills) and usage data (“usage” is the only clue to what is going on during the month). Usage data are available online in My Ovo, Usage (both daily and half-hourly). Combining these leads to an upper bound and a lower bound, which vary with time, on what the meter reading could be at any time during the billing month.
The following graph shows these two bounds for my consumption, over the last 2 years. Any acceptable estimated meter reading has to lie between these two lines. They look like a single line because, on this scale, the orange line covers the blue:
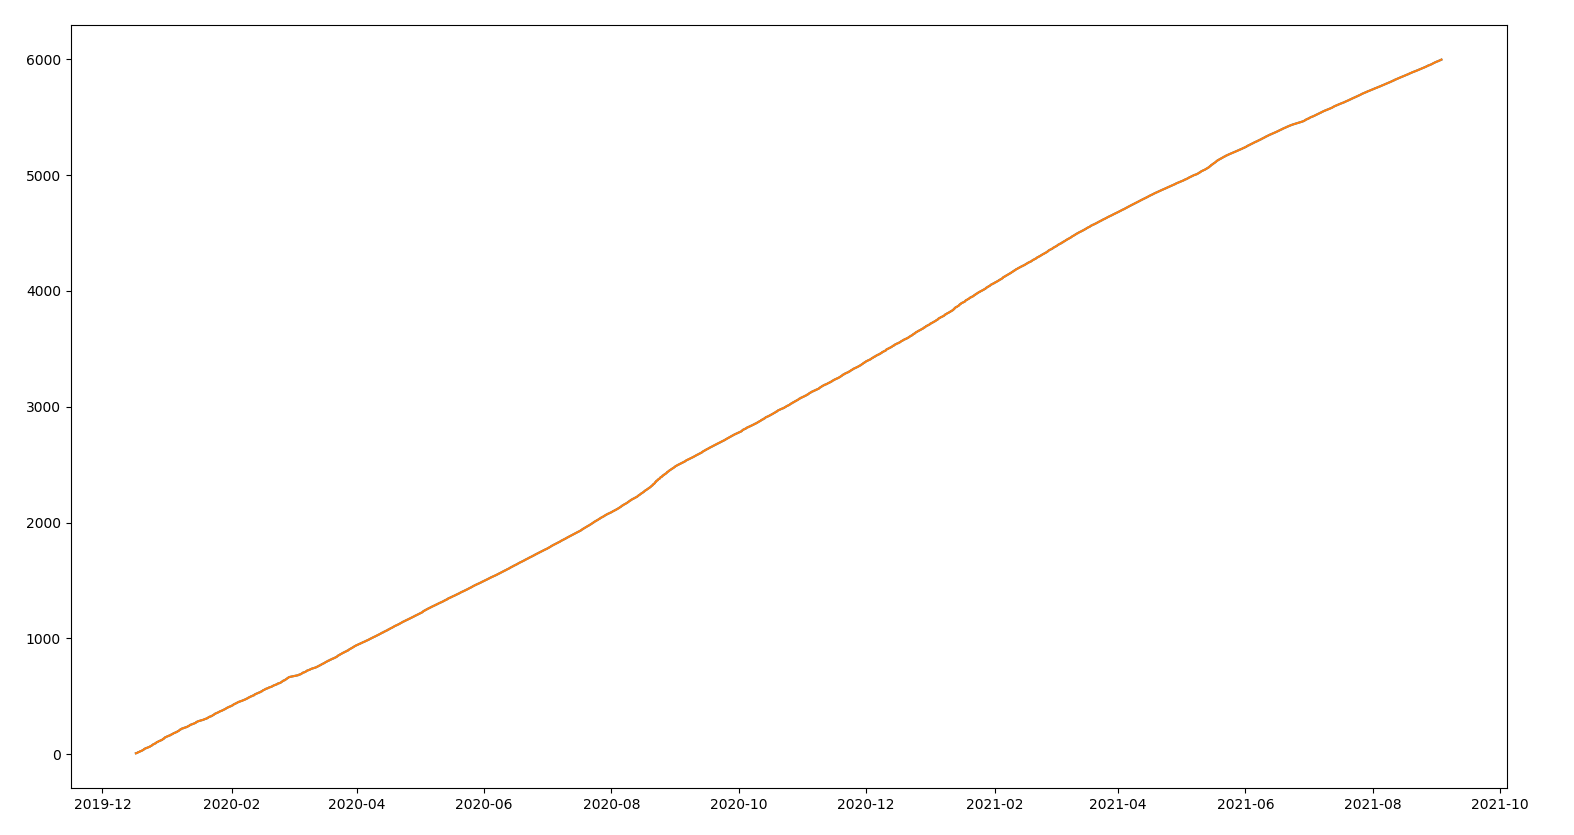
A higher or lower reading is logically and physically impossible.
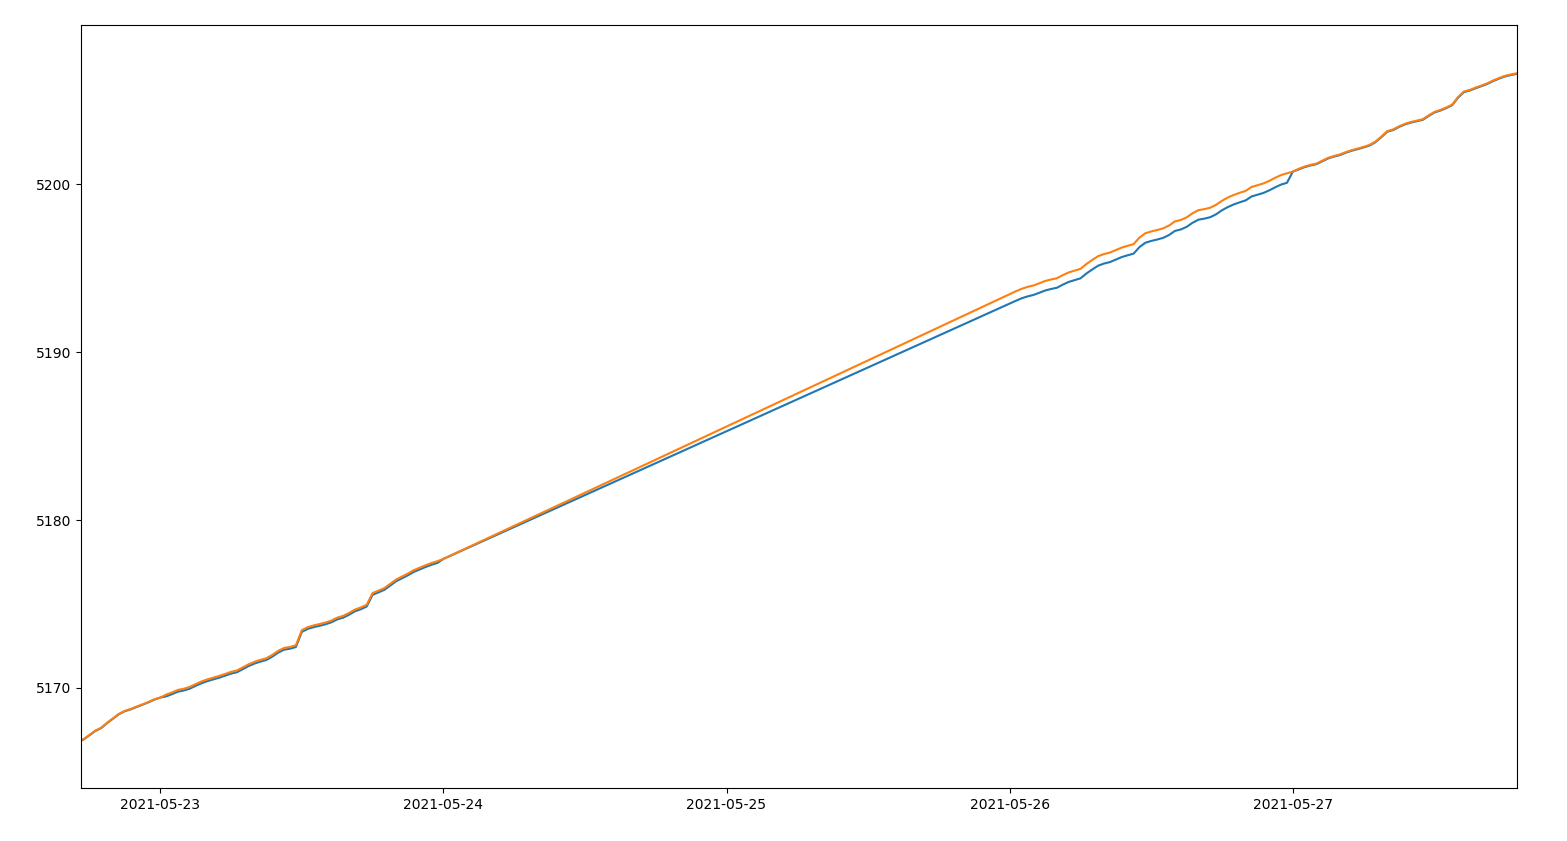
There were a couple of days in May when DCC may have had problems, because Hildebrand’s Bright app is missing data too (albeit at slightly different times). Zooming in a lot:
The difference between these bounds, in kWh, is plotted in the graph below - it’s always within 1 kWh of zero, and the missing data in May results in the largest positive spike, to the heady heights of 0.6 kWh.
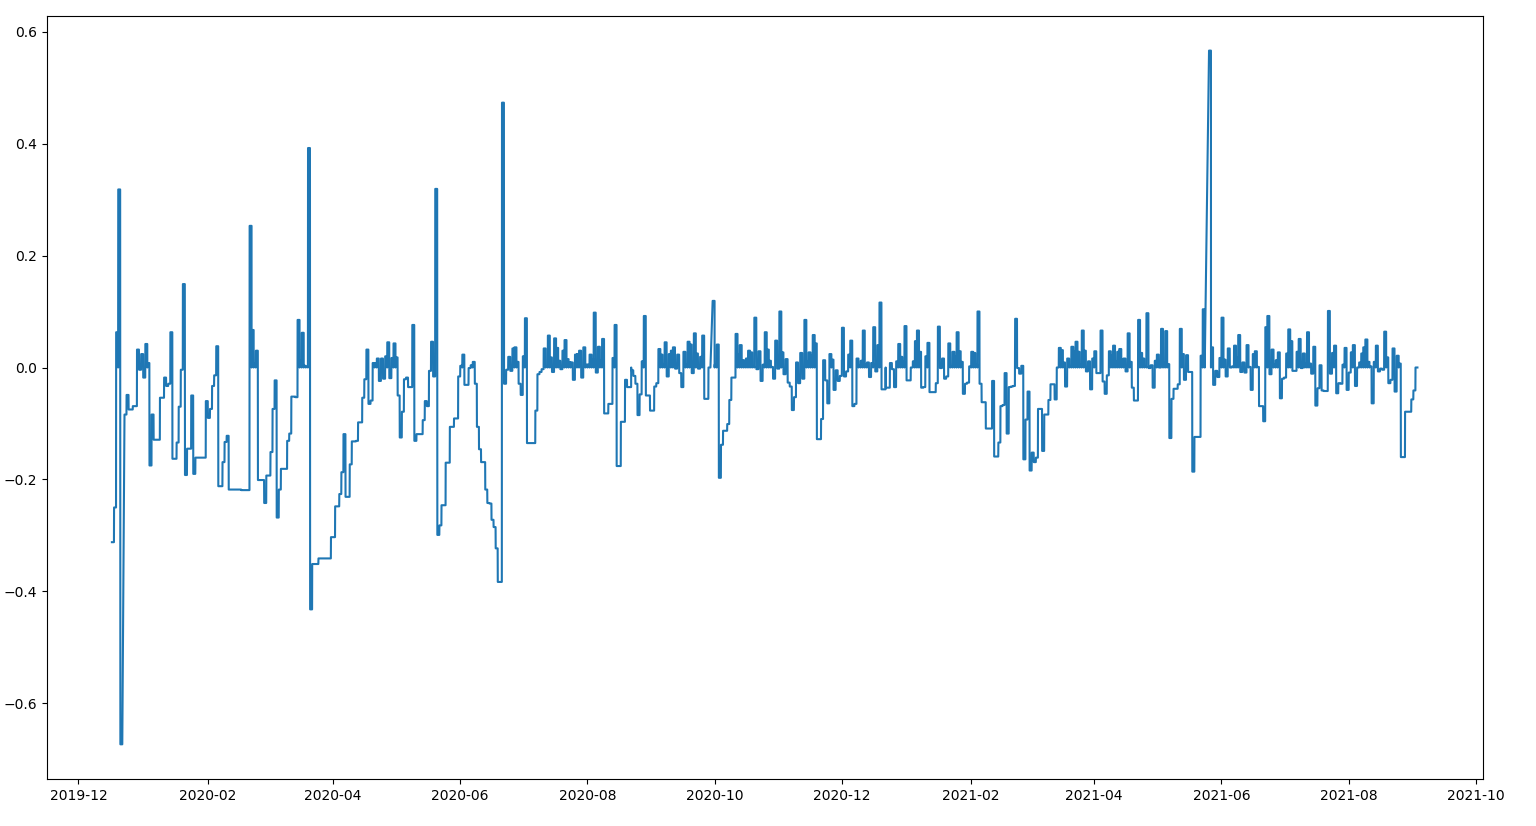
This is all done in an approximation where I gloss over the fact that the timings of daily and half-hourly usage data are not aligned. It’s ignoring this “apportionment” that causes the difference between my upper and lower “bounds” sometimes to have the wrong sign. But it isn’t hard to get very plausible estimates.
I’m moving on to look at the gas data (which is make more intricate by having to take out CV to convert energy usage in kWh into increments in meter readings of gas volume. The trick in dealing with missing data is to combine meter readings with usage, and this is where CV comes in.
But I’ve just been forcibly reminded that Ovo is still sometimes presenting me with negative values for daily gas usage. What on earth they’re playing at, I’ve no idea ...
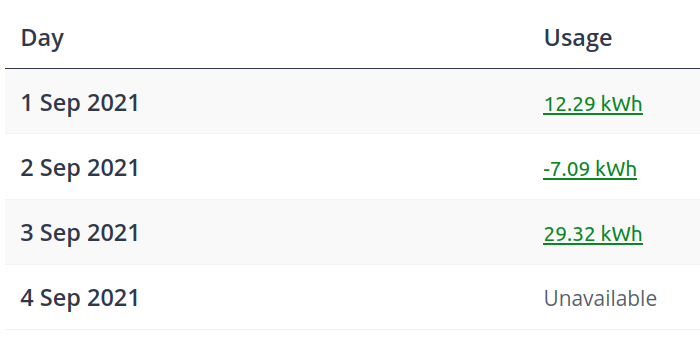
… but the error boils down to a failure to make intelligent use of half-hourly usage data, when the midnight meter reading (the one that they don’t bother to record any more, because “they don’t use it”) and latest daily usage data get lost in the communications system.
If I sound exasperated, that’s because I am. Getting the processing and analysis of data right, even incomplete data, really isn’t as difficult as Ovo make it appear.
PS The reference to “the orange covering the blue” rings bells, but it would have been too distracting to leave the following aside where it was in the explanation above:
(Cue joke about watching snooker on a black and white tv. “Whispering” Ted Lowe. I’m showing my age, and a slightly mis-spent youth...)
Ask your question to our members - they have the experience you're looking for:
Ask our communityNo account yet? Create an account
Enter your E-mail address. We'll send you an e-mail with instructions to reset your password.
OVO Energy Ltd, Floor 5, Crescent, Temple Back, Redcliffe, BS1 6EZ, (Company no. 06890795) registered in England and Wales.
OVO (S) Gas Limited is registered in England and Wales (Company No. 02716495) at Floor 5, Crescent, Temple Back, Redcliffe, BS1 6EZ.
OVO (S) Gas Limited is part of OVO Group Ltd


