Tutorial

Energy usage data from third party Apps: Ivie, Loop and Hugo - my guide

  • 26 November 2022
  • 21 replies
  • 3934 views
Energy usage data from third party Apps: Ivie, Loop and Hugo - my guide
Userlevel 7
Badge +5

There are a number of third party data sets now available gathering info from smart meters so I thought I’d give a few a go to see what they offer. As has been mentioned, the OVO info screens are useful but could be enhanced but what about the others. 

Loop Homes
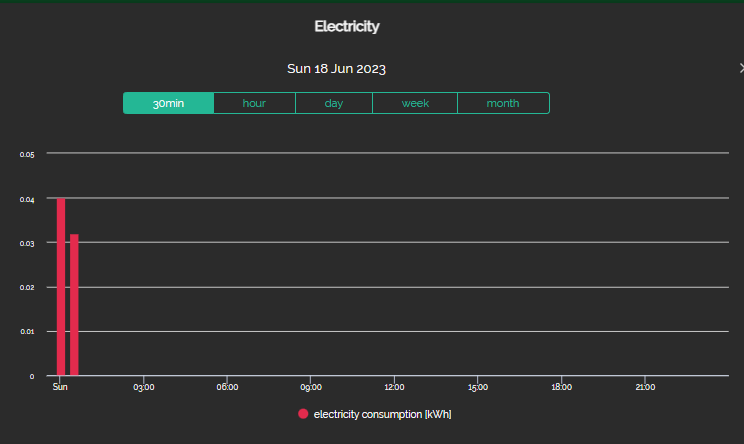
Loop - a useful and quick series of data which are updated during each day keeping track quite efficiently. This offers not much more than that apart from a solar PV and battery storage simulator but always a go-to for quick info. For some reason, gas always lags electricity by half a day or so. Loop are also running a peak hours reduction trial at present (2022-2023)  

(example screens)

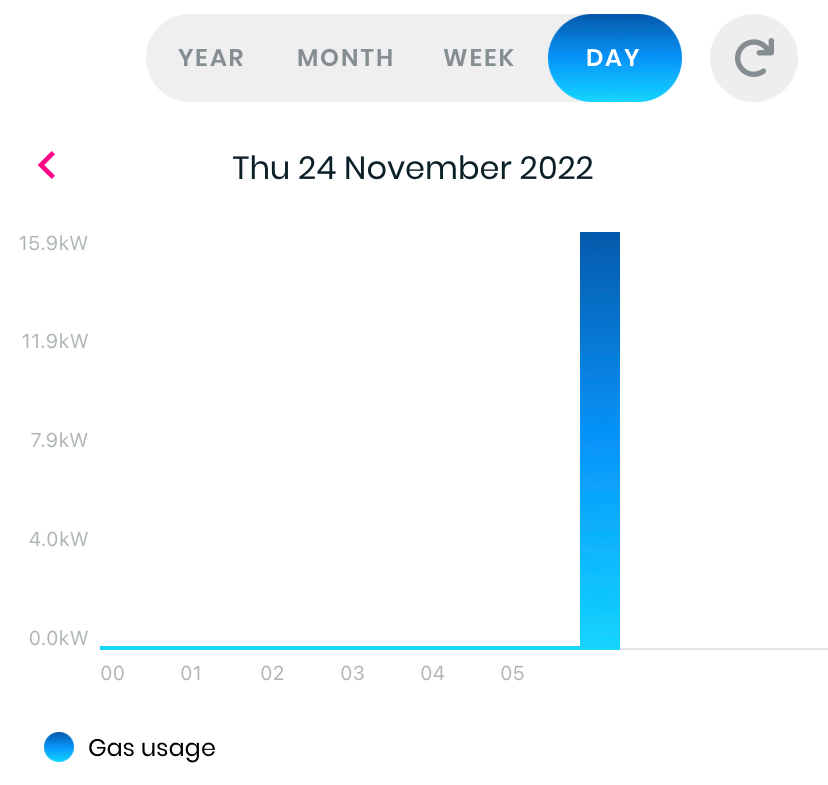
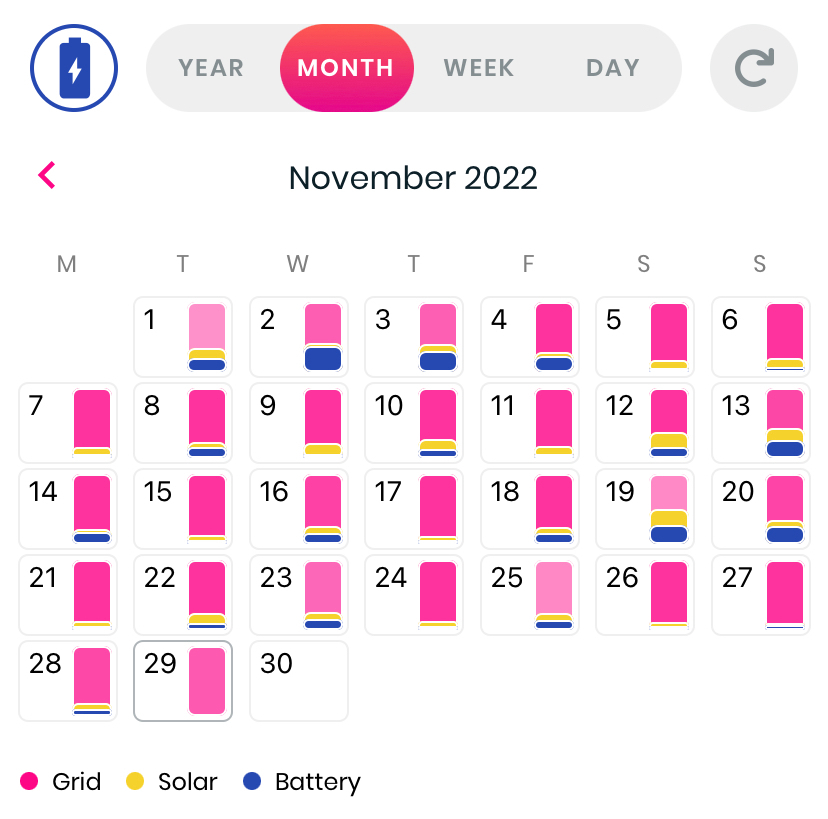
Loop does also have a solar PV and battery storage simulator which can give an idea of possible energy savings with these technologies. You can switch these on and off and also view a calculated kWh saving - however, if you already have solar panels or batteries you will get a false picture as the app doesn’t currently allow you to indicate this  

Hugo Energy

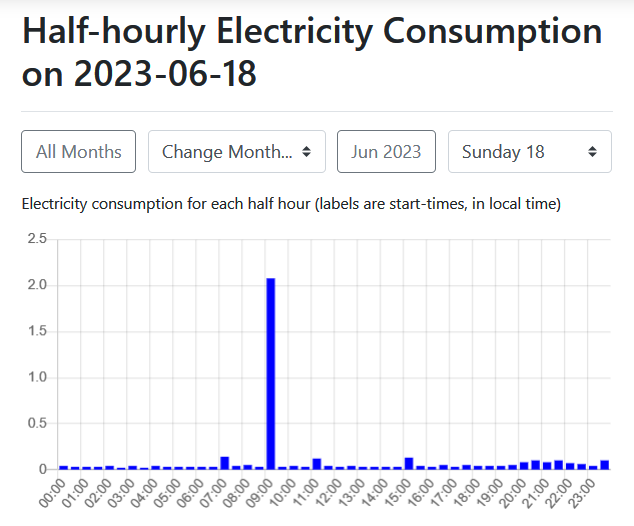
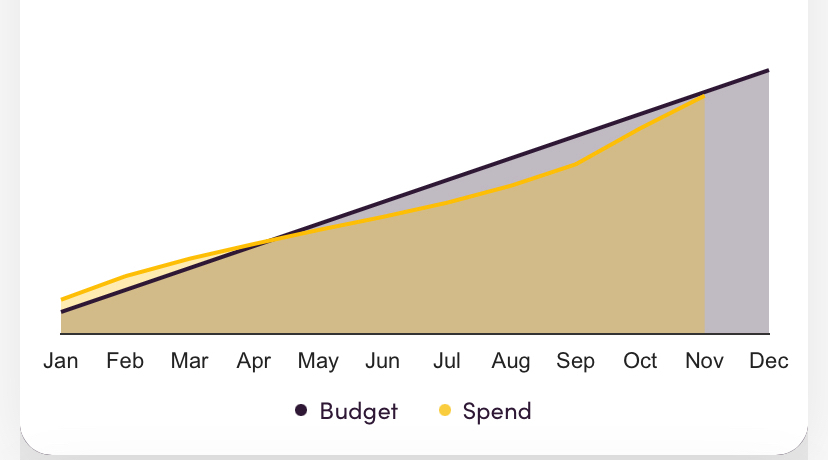
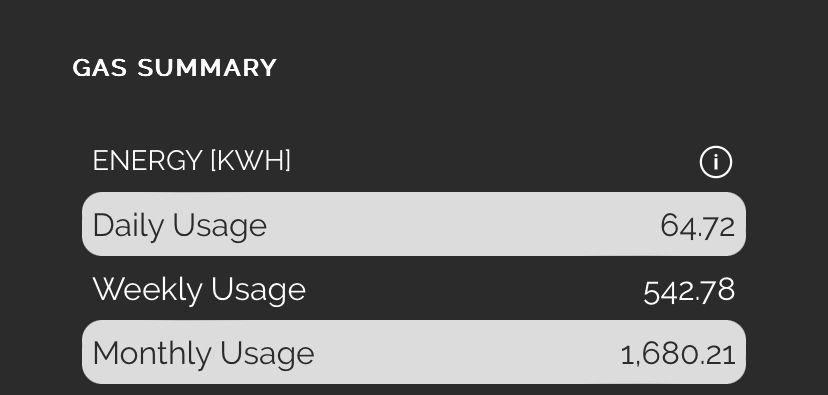
Hugo - a nice series of data screens but nothing for current day. It also has a budget tracking option to look across the year and project to year end. Good for a few different perspectives on the data. Generally always full and available the next morning 

An interesting data prospect (below) looking at a track of spend to projected budget 


Ivie Energy

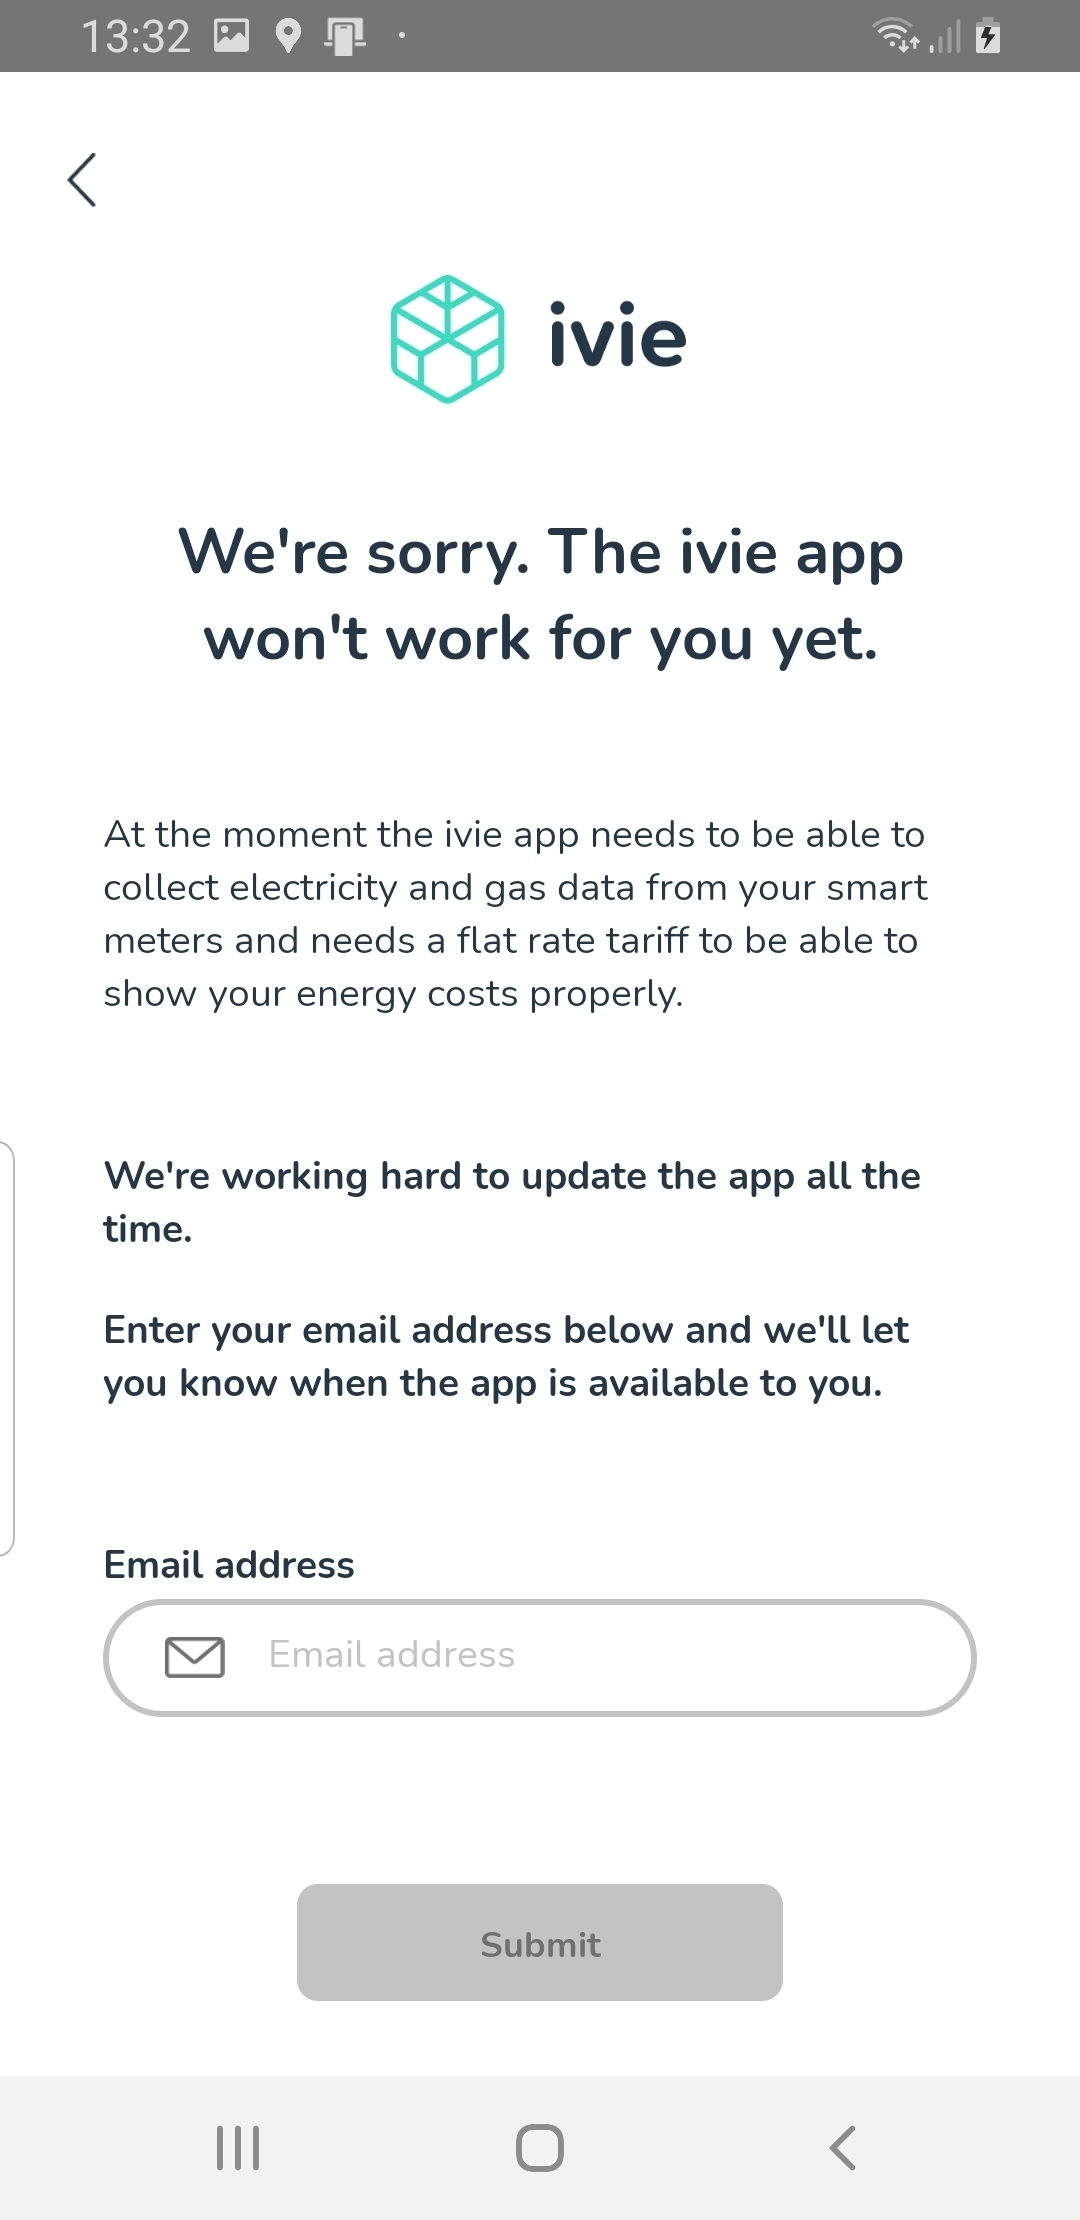
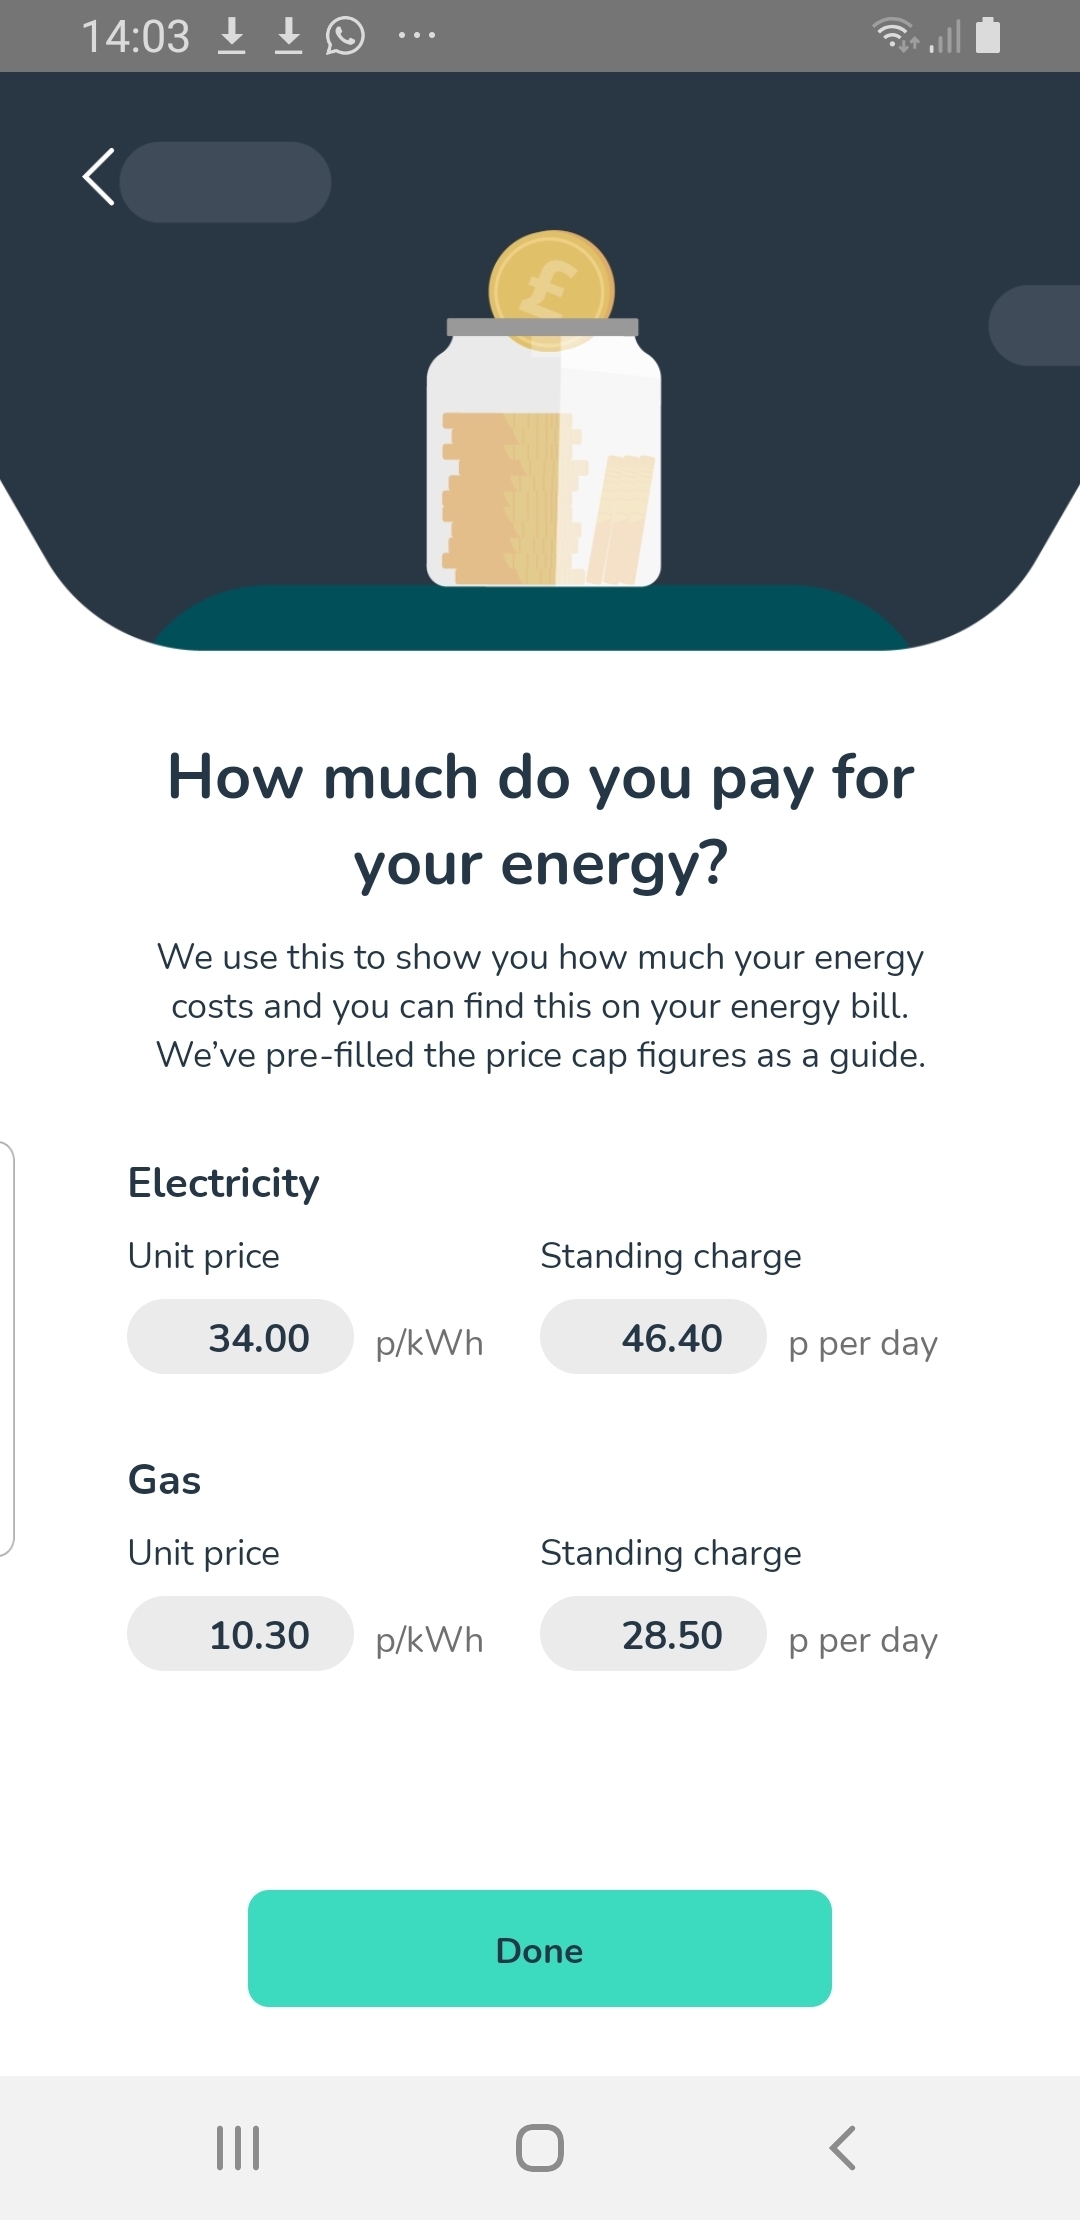
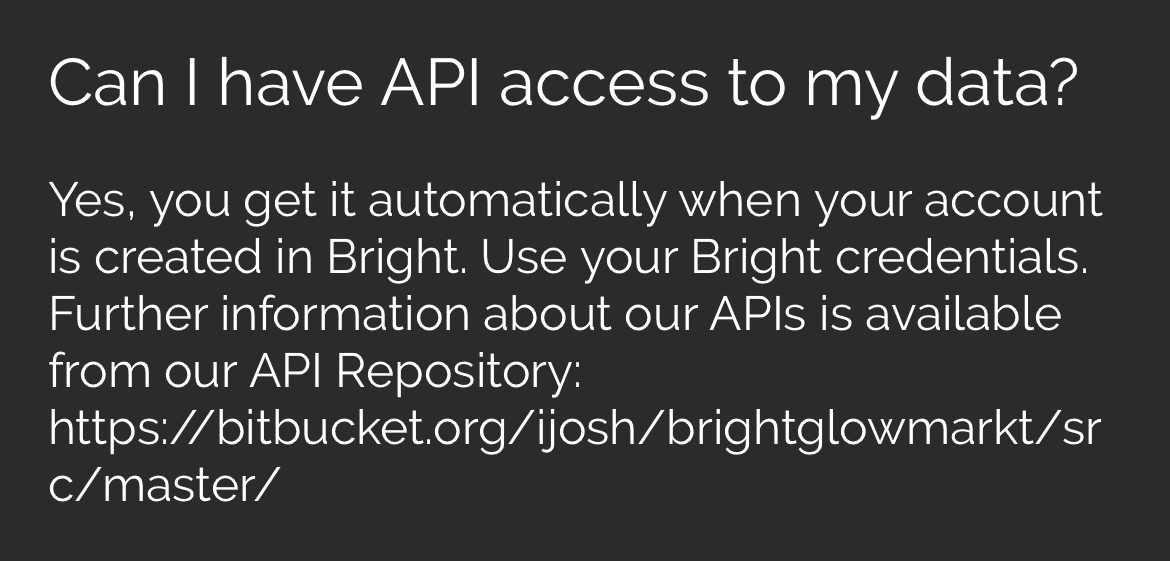
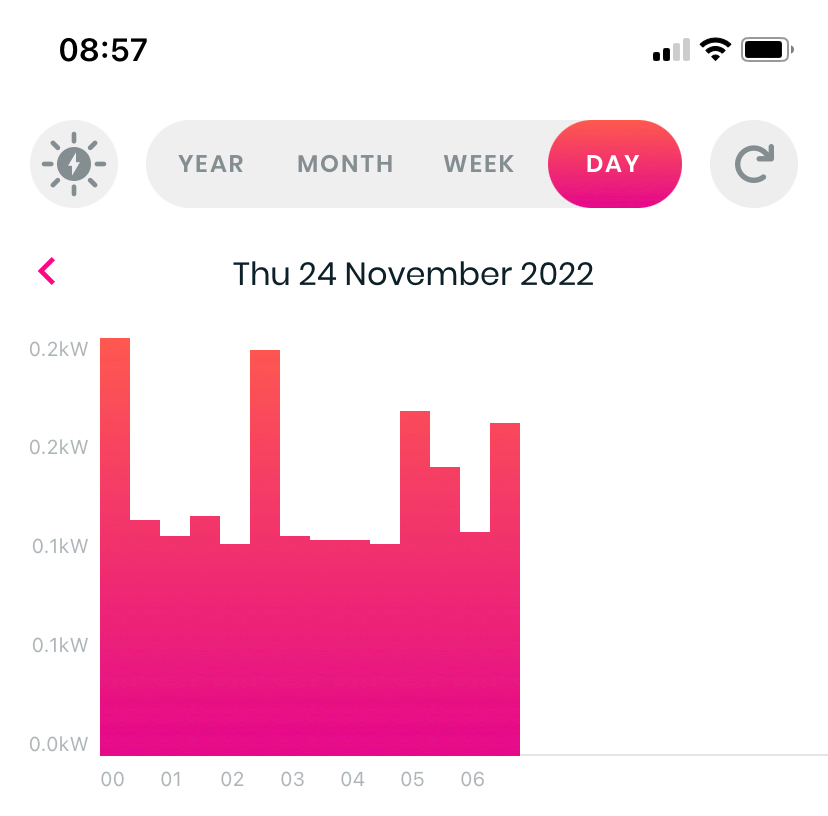
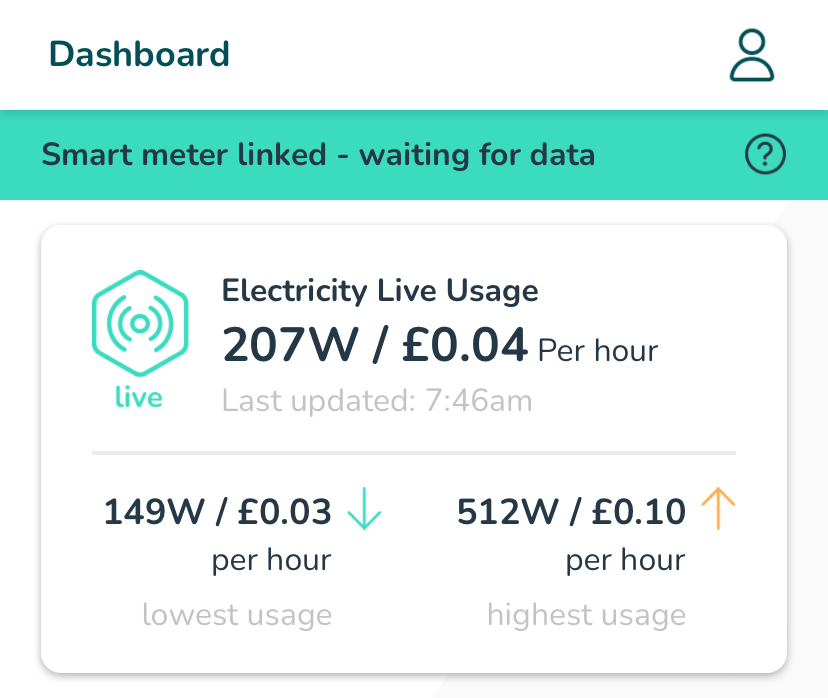
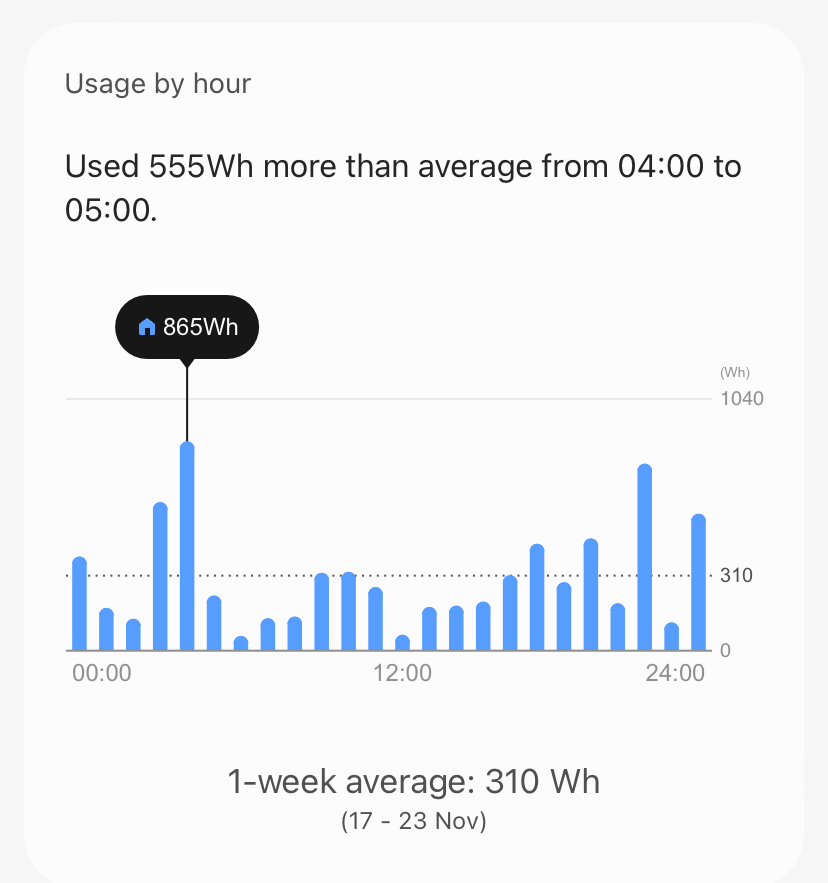
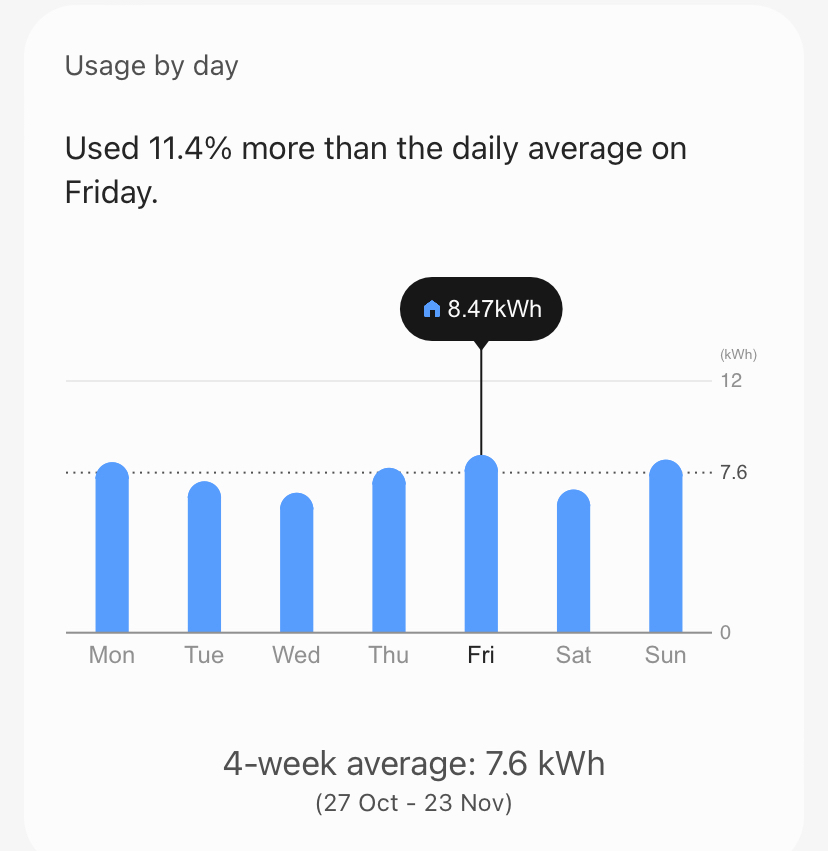
Ivie App - a newer option but currently it struggles to get data. It tends to take a day plus several hours and so it is not currently that useful although when complete, the detail on each day, week or month looks good comparing to expected use. This also has struggled to get any previous data from when initiated and so there is not much to look at currently. Hopefully this will sort itself out and also link to the ivie bud for a more complete feed. 

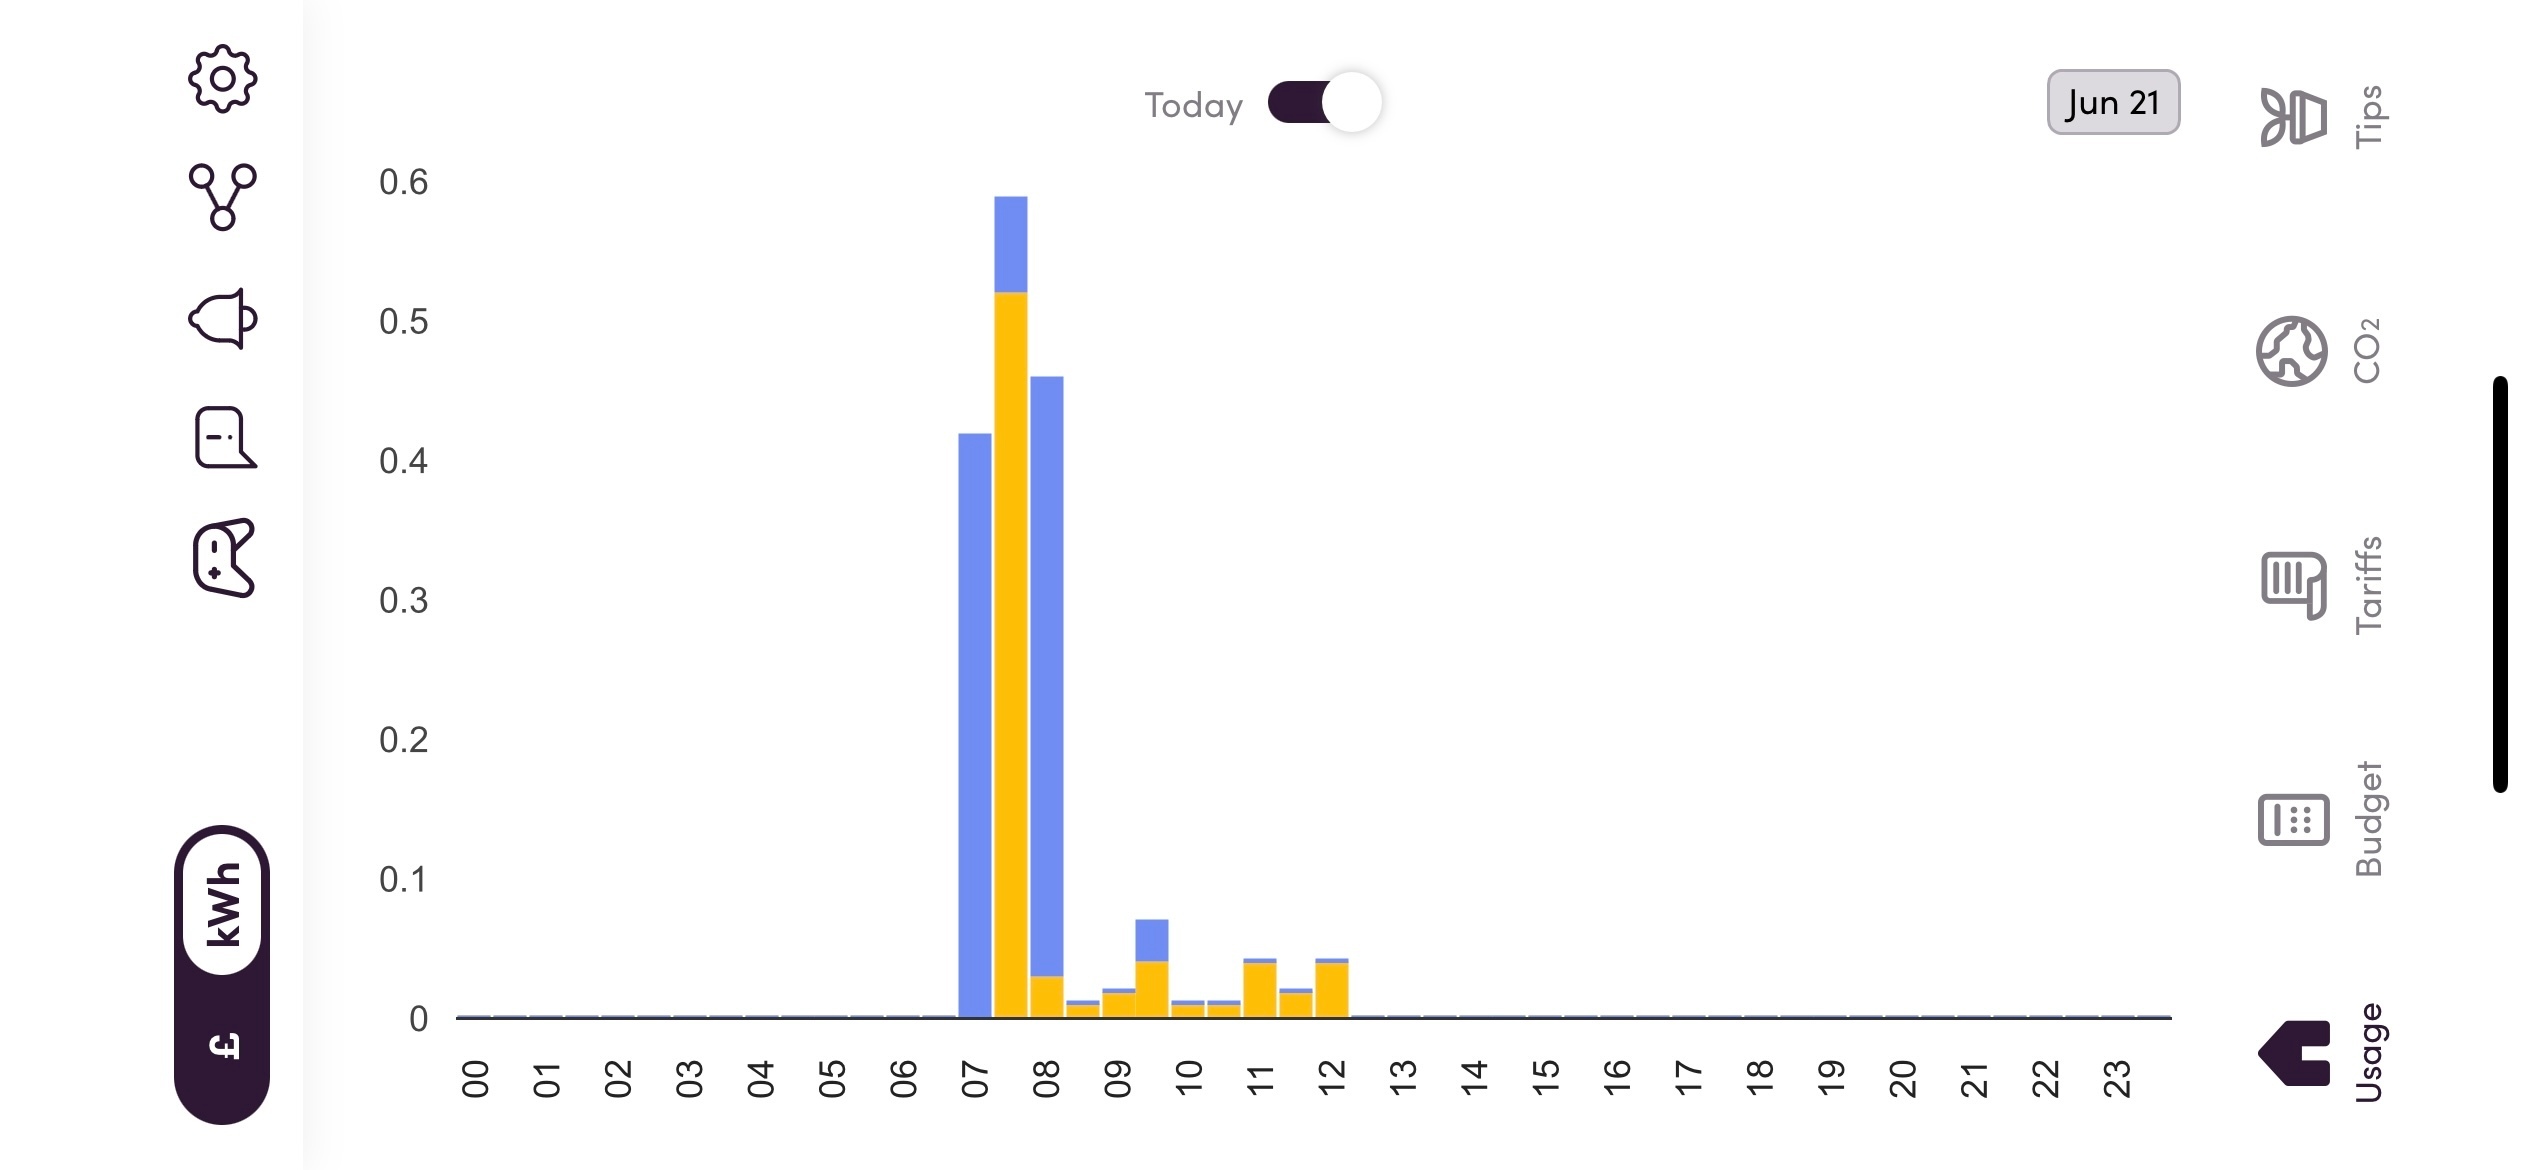
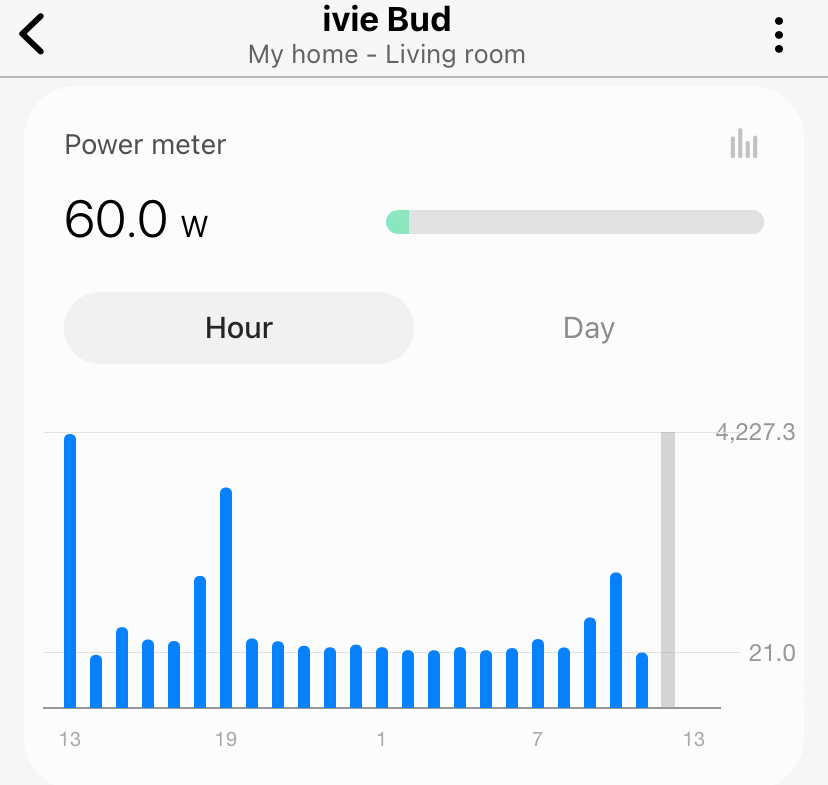
There is a live feed from the IHD to the ivie app (when working)

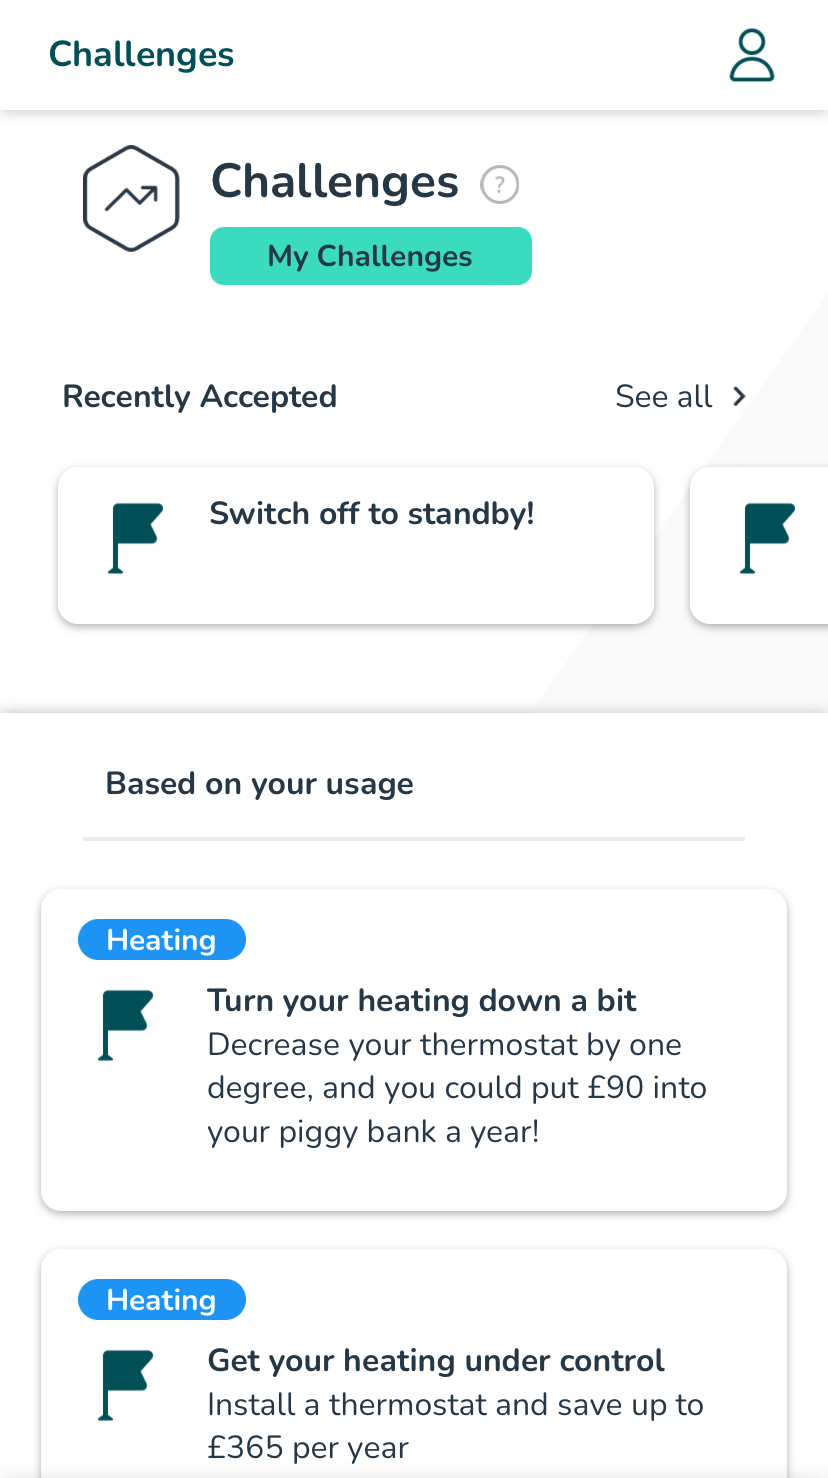
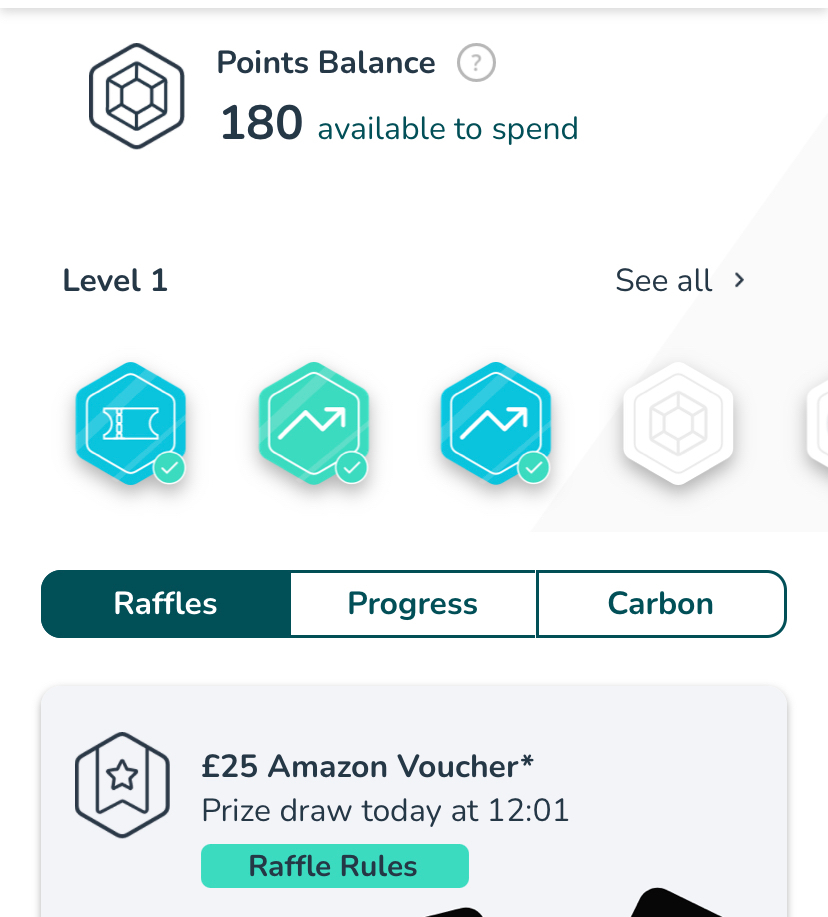
This ticks a box for something I’ve been looking for for a while. I’m still exploring but also like other parts of the dashboard with energy insights and points to be gained by accepting and completing energy saving challenges 


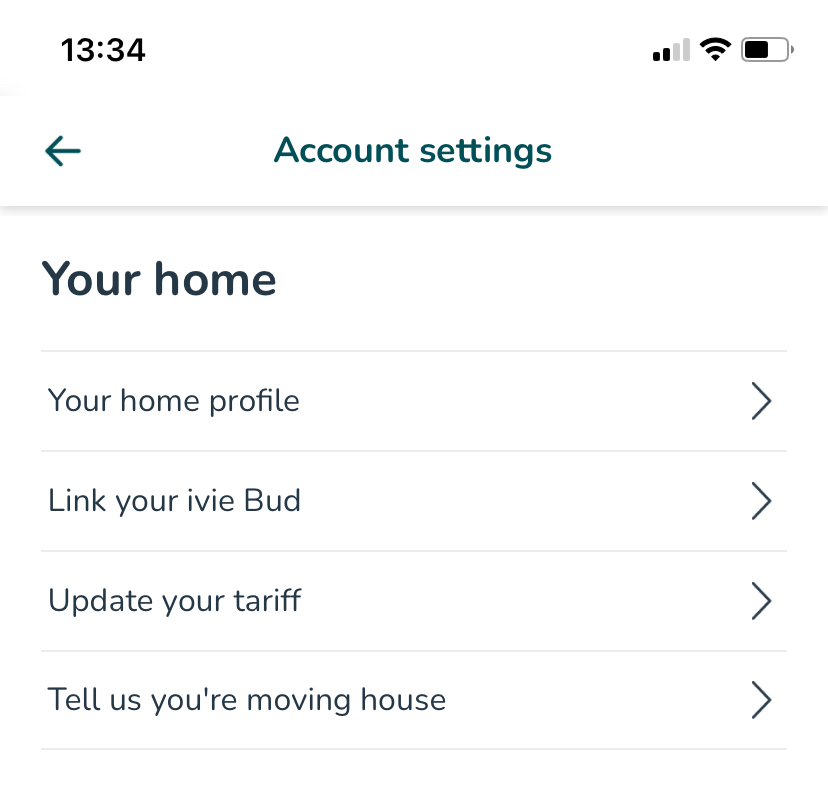
There is also a link to SmartThings which has various other options to monitor home appliances, lighting, cameras, smart plugs and other connected devices Currently this looks useful to view high usage slots within a week and even day.

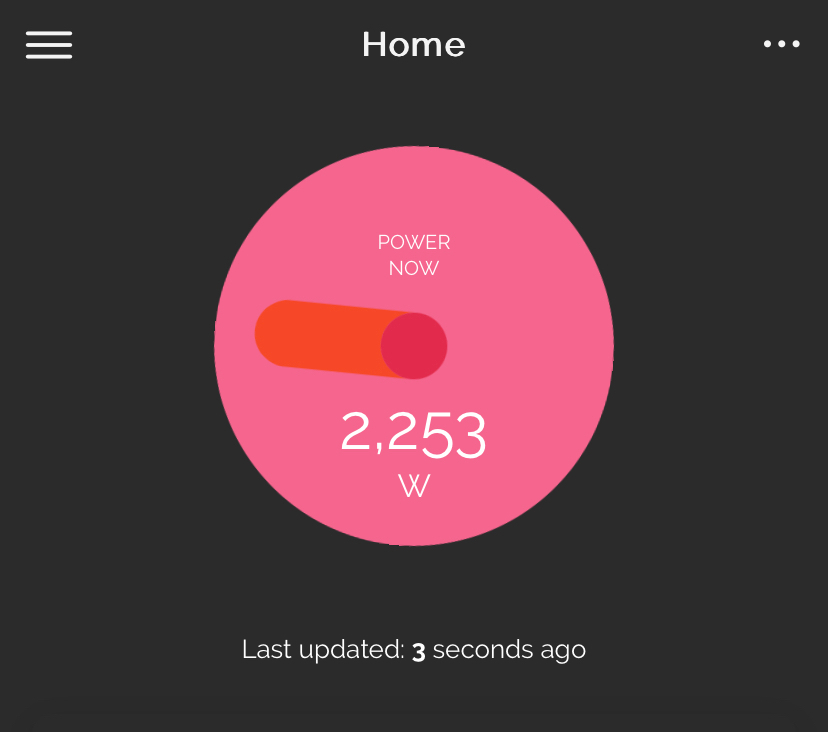
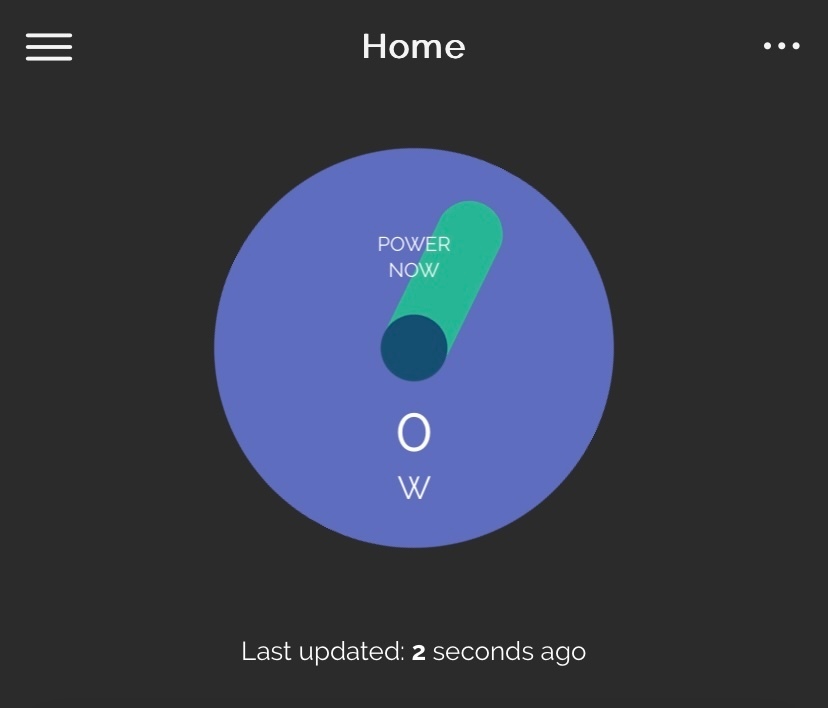
There’s also an hourly feed from the links with chameleon and ivie bud which scrolls through the hours giving an instantaneous reading and a more complete day’s view 


Bright / Hildebrand

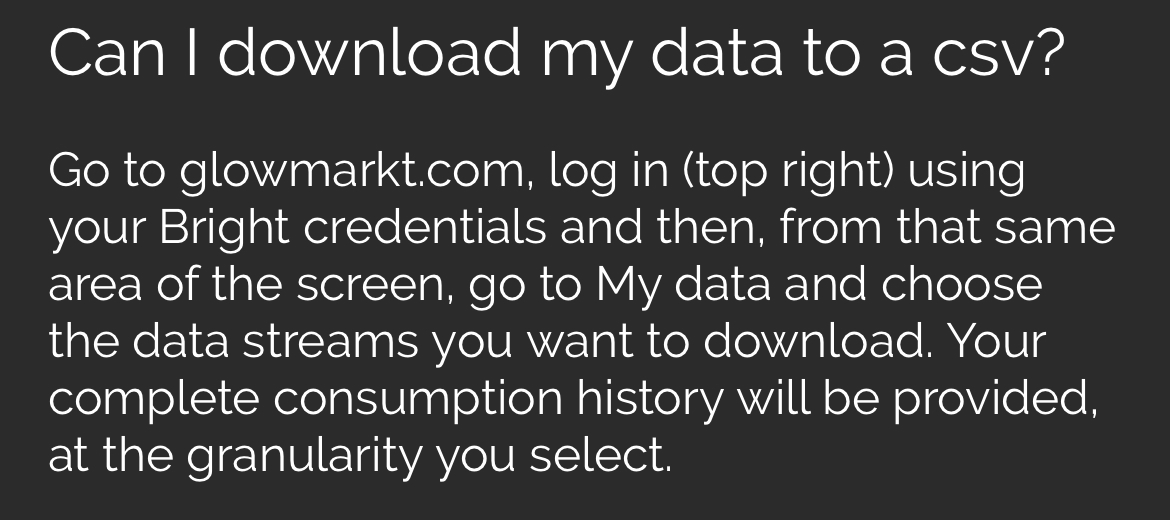
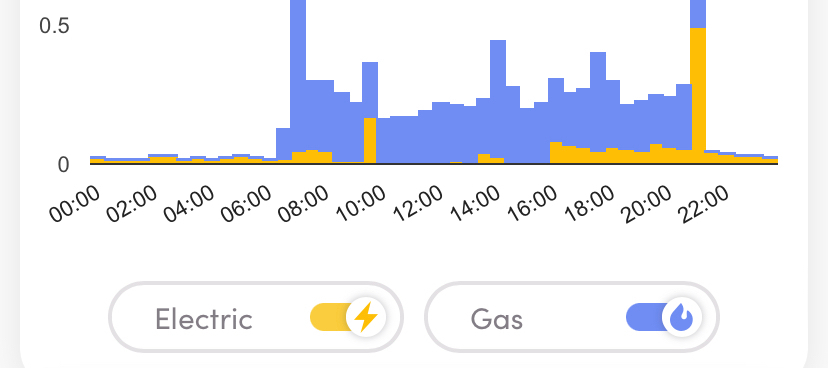
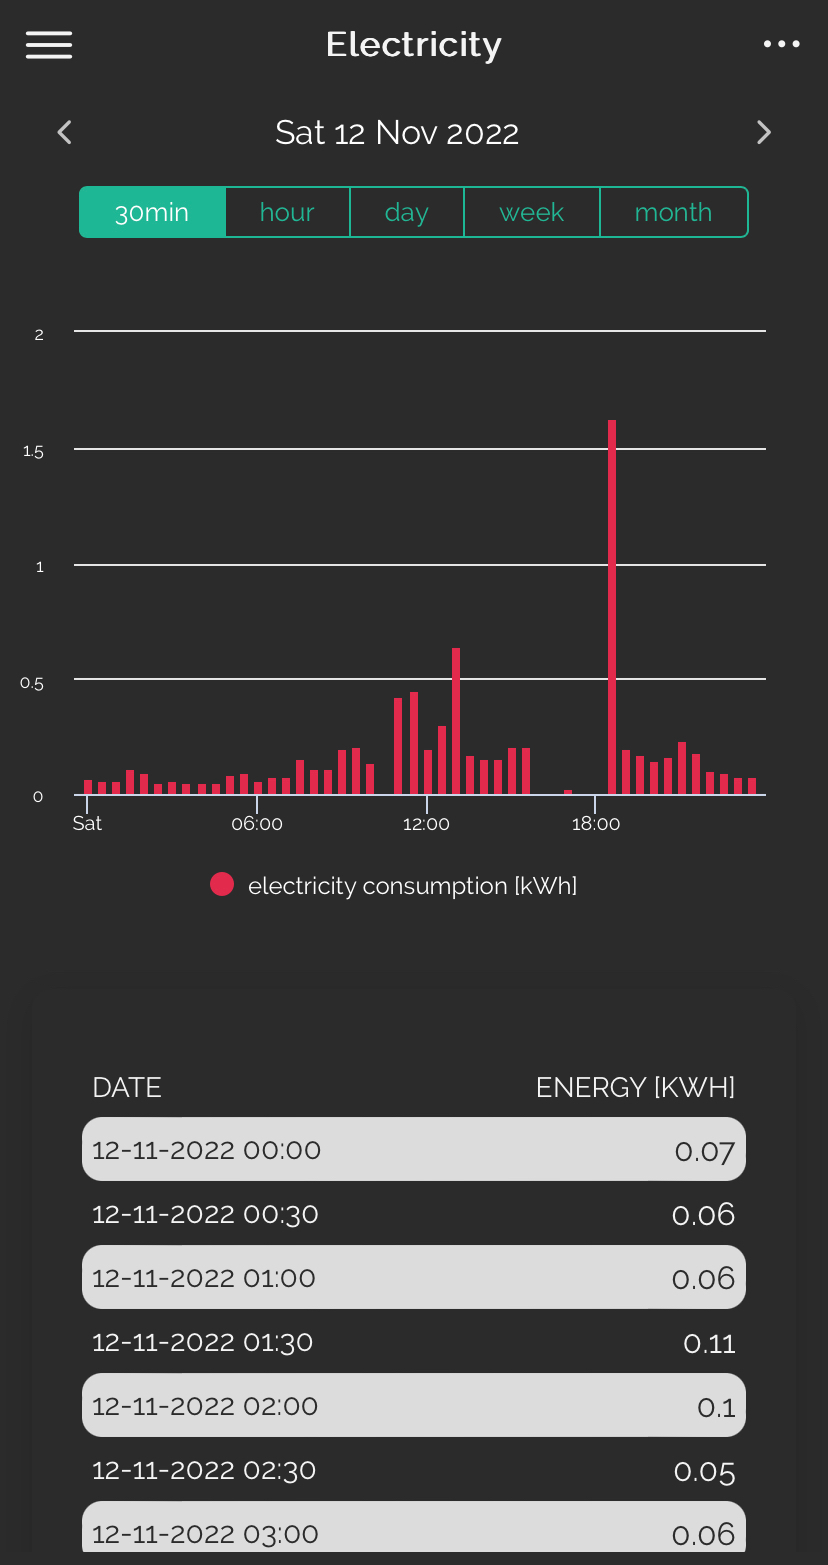
Another app which also offers its own display (to purchase) and link to some useful current data. Although the front dashboard is active for the day, it is very text heavy which in my personal view is not as easy to read.

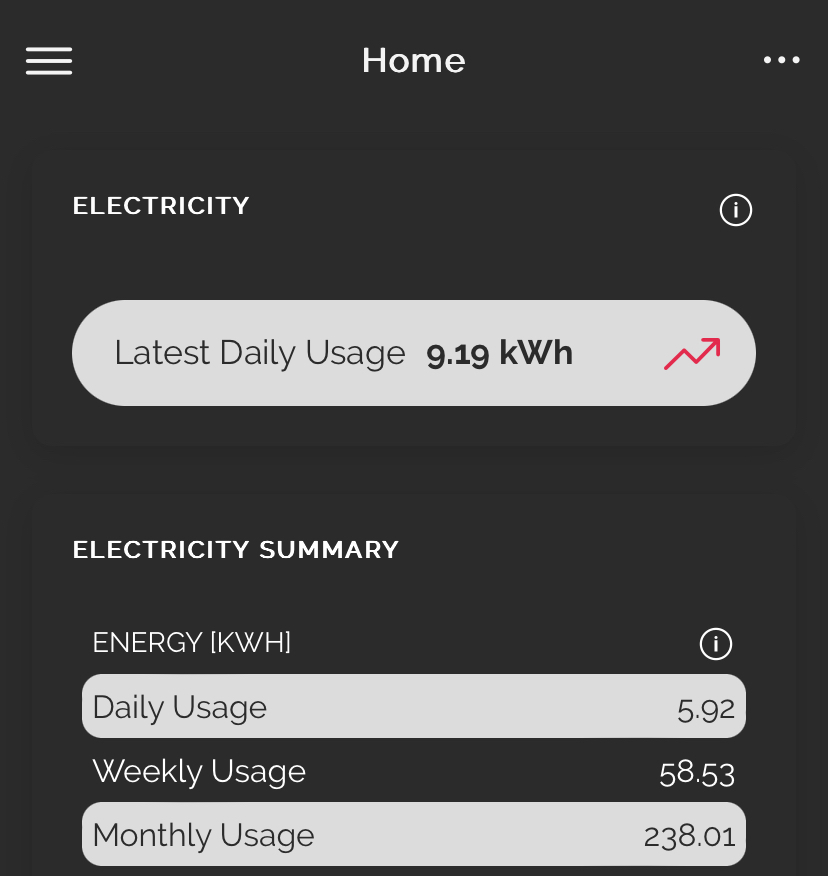
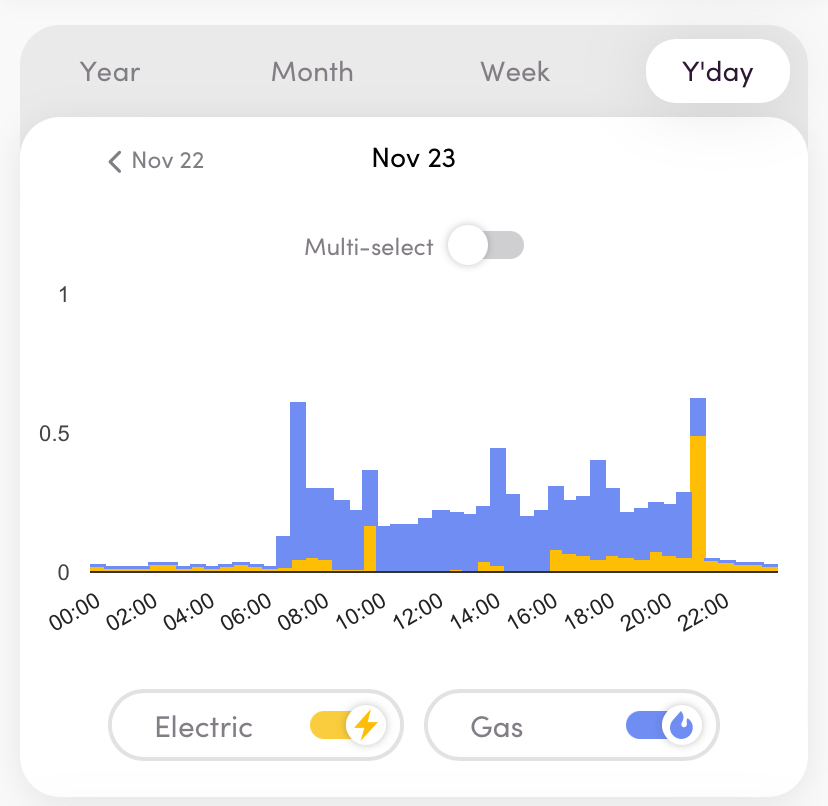
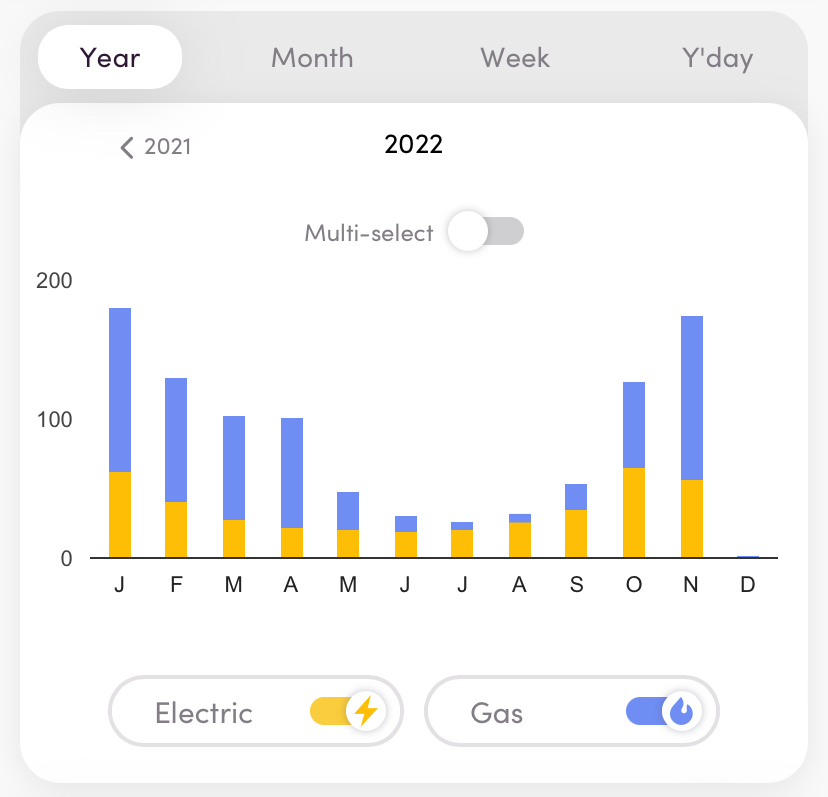
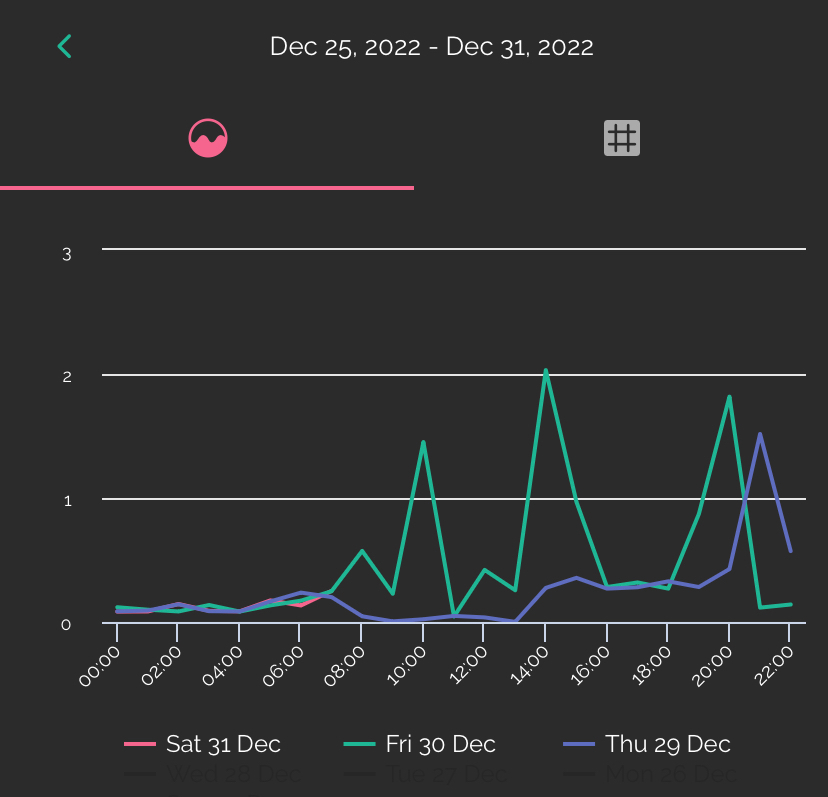
The rest of the information is very good, giving graphical representations of data daily, weekly and monthly and also available as hourly and half-hourly views. 
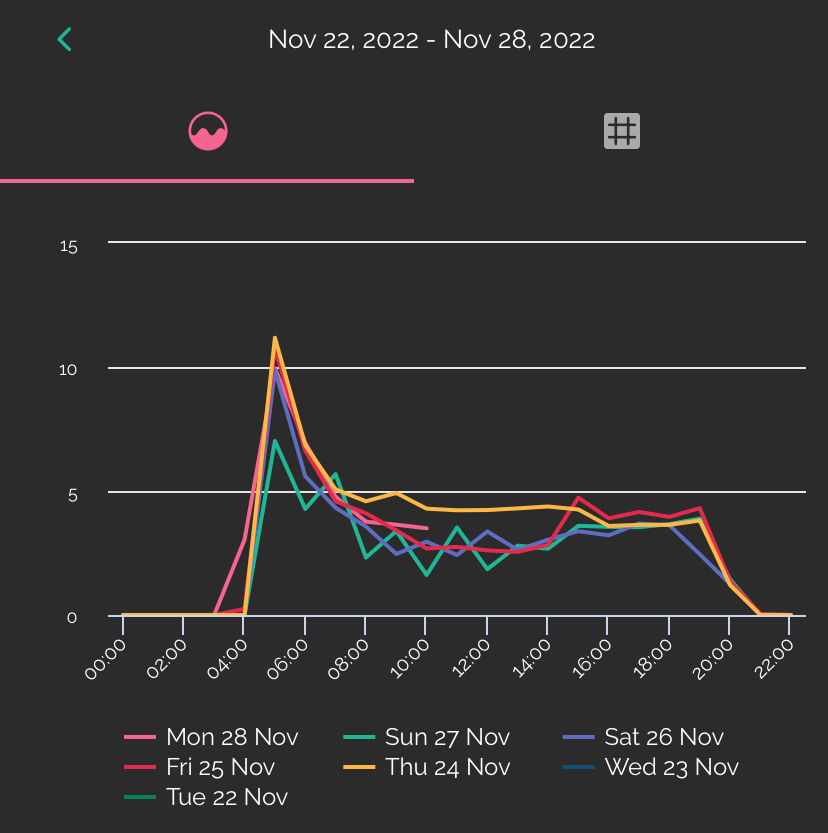
The most useful of these is a comparison view so that the user can judge their use from previous records


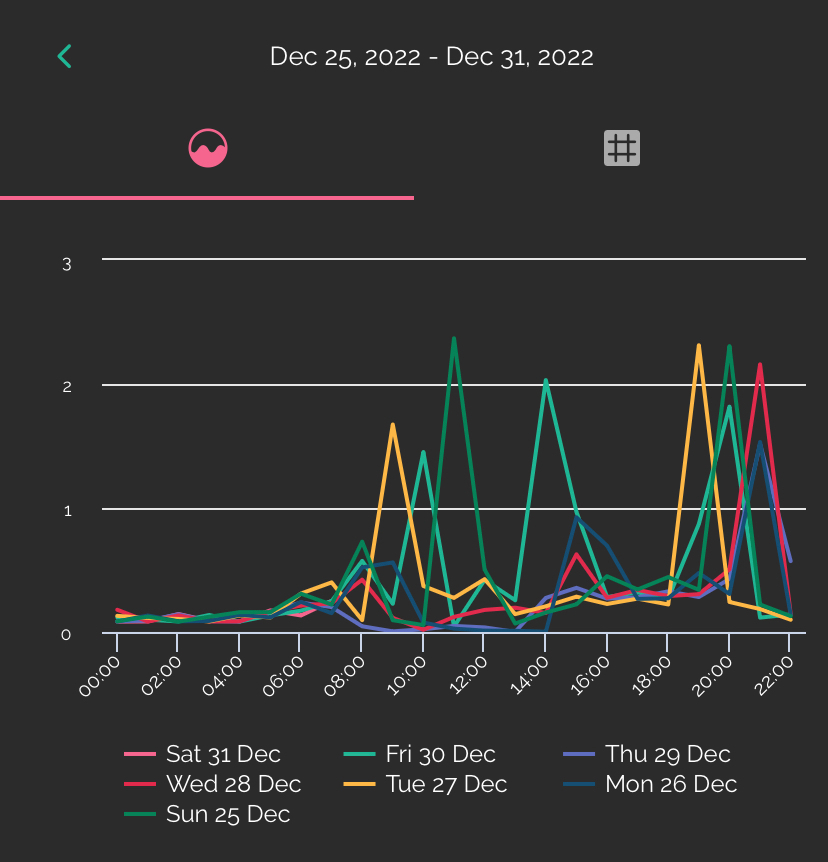
Update: not well documented but there are options on the Bright data screens to zoom in by pinching the screen on a mobile or tablet in the normal way which can help to look at specific time slots more closely. Also I have recently discovered that you can switch off a days data on the comparison screen by clicking on the key dates  - this is an extra useful feature when comparing days against each other like this 

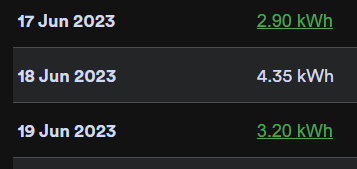
A complete week in comparison view 

Reduced days in comparison view

Bright also have an IHD which I’ve just acquired. It looks like it gives a great deal of extra information, links to the Bright app and gives a graphic display of instantaneous use. It also feeds a minute feed to the Bright app graphics which I will report on shortly. 


Note : Using several of these at once appears to bring some sort of conflict in data acquisition but the whole area of gathering and displaying data is currently in its infancy therefore I would expect it to become a comprehensive offering in the next few years .. perhaps even integrated into the offering from your energy supplier.


21 replies

Userlevel 7
Badge +1

I’ve linked this guide from a high traffic thread. You may find it racks up a lot of views now.

Userlevel 1

Another drawback with Ivie is that it only supports flat rate tariffs. at the moment.

Userlevel 7
Badge +5

Another drawback with Ivie is that it only supports flat rate tariffs. at the moment.

I think you mean Loop. On the ivie app you can change the tariff on the settings page

Userlevel 1

Another drawback with Ivie is that it only supports flat rate tariffs. at the moment.

I think you mean Loop. On the ivie app you can change the tariff on the settings page

Nope .. definitely Ivie.


Userlevel 7
Badge +5

@Hafnia you must have a different set up 

Taken from the settings page just now

Userlevel 1


Taken from the settings page just now


I can’t even get that far.

In which case I guess the hack is to tell them you are on a flat rate tariff, just to get past the registration, and then update the tariff ;)


EDITED: Nope, that doesn’t work either … it only lets you input flat rate tariffs


Badge +3

I have Loop slow clunky and can not set tariff manually ...But one nice thing it tells my my usage electric and gas and also tells me I use 87% of my days electric at Night  which is the only thing I look at  shame OvO can  not do the same as its the same data set…….I have been with OVO 5 years and can only look back 1 year why the data is there.

Will be getting SMETS2 smart meters (dual energy) installed soon, which will come with an ivie bud IHD, my question is which app is the best to monitor my consumption at home using a tablet (iOS) and away from home the phone (Android)...looking at Smarterthings & the ivie app or, is there a better application out there...TIA

(apologies if there is already a thread out there….pleae post link in response)

Userlevel 7
Badge +1

Hey @acjgo ,

Actually you won’t get an ivie Bud. You’ll probably get a Chameleon IHD7-CAD-PPMID included instead. The ivie Bud isn’t given out by any supplier.

I’ve got a whole guide for you though! :)


Userlevel 7
Badge +5

Anyone using the Hugo data feed might have seen an update recently. They now give same day readings at 4hr update intervals. Another alternative to the IHD. Accessible from the daily screen and the hour slots are clickable to show cost or kWh usage

This is something Loop have had for a while but in my opinion with less reliability than Hugo’s general feed

Userlevel 7
Badge +5

There’s a further update now from SmartThings which gives the user a carbon emissions calculator as well as other info for the interested consumer 


Userlevel 7
Badge

I was about to ask if you knew how quick these apps were at picking up tariff changes, because I noticed that Bright was showing the new rates yesterday (4 July). I went snooping and found a resource called Tariff (https://api.glowmarkt.com/api/v0-1/resource/c740303a-9915-4925-86ed-bc8b2a800dbf/tariff) which told me:

            "cid": "PWER",

            "type": "tou",

            "commodity": "ELEC",

            "from": "2023-07-04 00:00:00",

            "utility": "HILD",

            "id": 913070,

            "currentRates": {

                "rate": "29.47",

                "standingCharge": "50.3"

            }


This doesn’t tell me when DCC made it available. However, I can see that costs before that from date are still recorded at the old rate, while subsequent ones use the new one. This seems to lead to a minor discrepancy between Bright’s cost estimates and OVO’s. My meter apparently got the new rates at the same time. 

Sadly, Bright’s resources don’t seem to be accessible outside the app, unlike OVO’s.


Userlevel 7
Badge +5

Sadly, Bright’s resources don’t seem to be accessible outside the app, unlike OVO’s.


You can get api access if you have signed up to a Bright/Glowmarkt account. 
 

You can also get csv data 


Userlevel 7
Badge

Thanks! However, that involves writing code - and Fortran doesn’t cut it any more ;) However, those Hildebrand pages are very helpful and make data retrieval much simpler. 

There’s a wee bit of doubt in my mind about the Bright app, which may also affect the others. The data seem to rely solely on the Hh figures available from DCC. (OVO) billing disregards these figures completely and bases its results on meter readings. Since there is the chance of an occasional discrepancy* between the two sets of data, I’d rather use the readings for longer-term analysis and projections, but they don’t seem to be available through these channels. One systemic difference is the UTC/BST variation; in summertime, usage between 00:00 and 01:00 is allocated to the wrong day, at least for me. This might vary with meter type, though. Do you have any thoughts on this?


*  For example, neither OVO nor Bright managed to pick up Hh data for 18 June, although they are there according to n3ergy:

OVO missing Hh data for 18 June


Bright missing Hh data for 18 June
n3ergy Hh data for 18 June (via https://energy.guylipman.com/)

OVO’s total usage for the month is of course correct (± the first and last hours of the month) because it only depends on the readings, but Bright’s is a day’s-worth - 4.5kWh -  too low. 

Userlevel 7
Badge +5

I would assume that any 3rd party access to data via DCC would have the same issues, should there be missing slots.
Perhaps as my data is linked directly to the meter via their IHD it is more reliable but I realise that isn’t an option for everyone. 
Both Bright and Hugo have been useful in regaining any lost data although as I mentioned, since acquiring the Hildebrand IHD, I don’t remember any missing data, even on 1st July 😬. 
Having been in touch with Hildebrand they do acknowledge that their time slots can be out, especially after changes to BST. As it is not their main source of income, any update is a background task for their software team. 

Userlevel 7
Badge +2

The regulations don't allow the third party apps access to the daily meter readings currently.

So it is impossible for the 3rd parties to accurately duplicate what the energy suppliers charge currently

There is a proposal to change this. 


Userlevel 7
Badge +5

The regulations don't allow the third party apps access to the daily meter readings currently.

So it is impossible for the 3rd parties to accurately duplicate what the energy suppliers charge currently

There is a proposal to change this. 


Hence why I think that my Hildebrand IHD connecting directly to the meter and also linked to the Bright app gives me the best alternative option

Userlevel 7
Badge

The regulations don't allow the third party apps access to the daily meter readings currently.

Strange - I wonder why not? 

If the half-hourly data were completely reliable, it would be possible to reconstruct the readings given a starting point. But they’re not, so it isn’t. Rats!

Userlevel 2
Badge +1

Are any of the apps able to display the Export figures from a Smart Meter?

An associated question is which companies pay SEG payments by reading the Smart Meter directly? I believe Octopus does, but all the rest seem to need manual readings to be submitted, which seems rather backward to me.

Userlevel 7
Badge +2

The regulations don't allow the third party apps access to the daily meter readings currently.

Strange - I wonder why not? 

If the half-hourly data were completely reliable, it would be possible to reconstruct the readings given a starting point. But they’re not, so it isn’t. Rats!

I understand initially due to data protection and not envisioning the need. 

In hindsight of course it seems a strange thing to do. 

Given the dramatic changes in the industry over the last few years it is a bit surprising a proposal wasn't put forward to change it earlier.

We may get to the point the vast majority of tariff are in fact based on the 30min data.... Even zonal/nodal pricing rather than just regional....

Userlevel 7
Badge +5

Are any of the apps able to display the Export figures from a Smart Meter?

An associated question is which companies pay SEG payments by reading the Smart Meter directly? I believe Octopus does, but all the rest seem to need manual readings to be submitted, which seems rather backward to me.

Theoretically yes but this needs to be enabled from the meter via SMHAN (so I’m told).

Having said that, I’ve never seen this myself in any of the data feeds so far. There are other questions on this on the Glowmarkt forum (data from the Bright app)

https://forum.glowmarkt.com/index.php?p=/discussion/106/export-meter-reading
(you might need to create an account to view)


For the SEG data, I’m not sure which companies use a direct feed. I know that for FIT, the generation reading is needed, hence a manual reading from a separate generation meter

Reply