Add 30min/hourly cost data to the usage page

Related products: OVO app

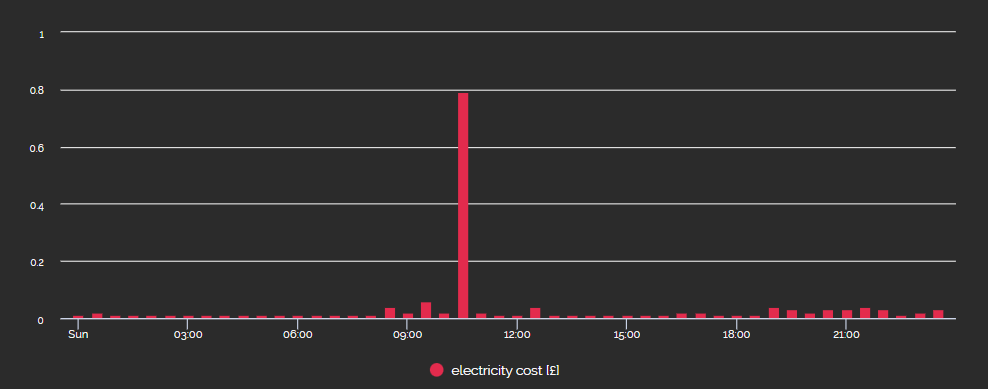
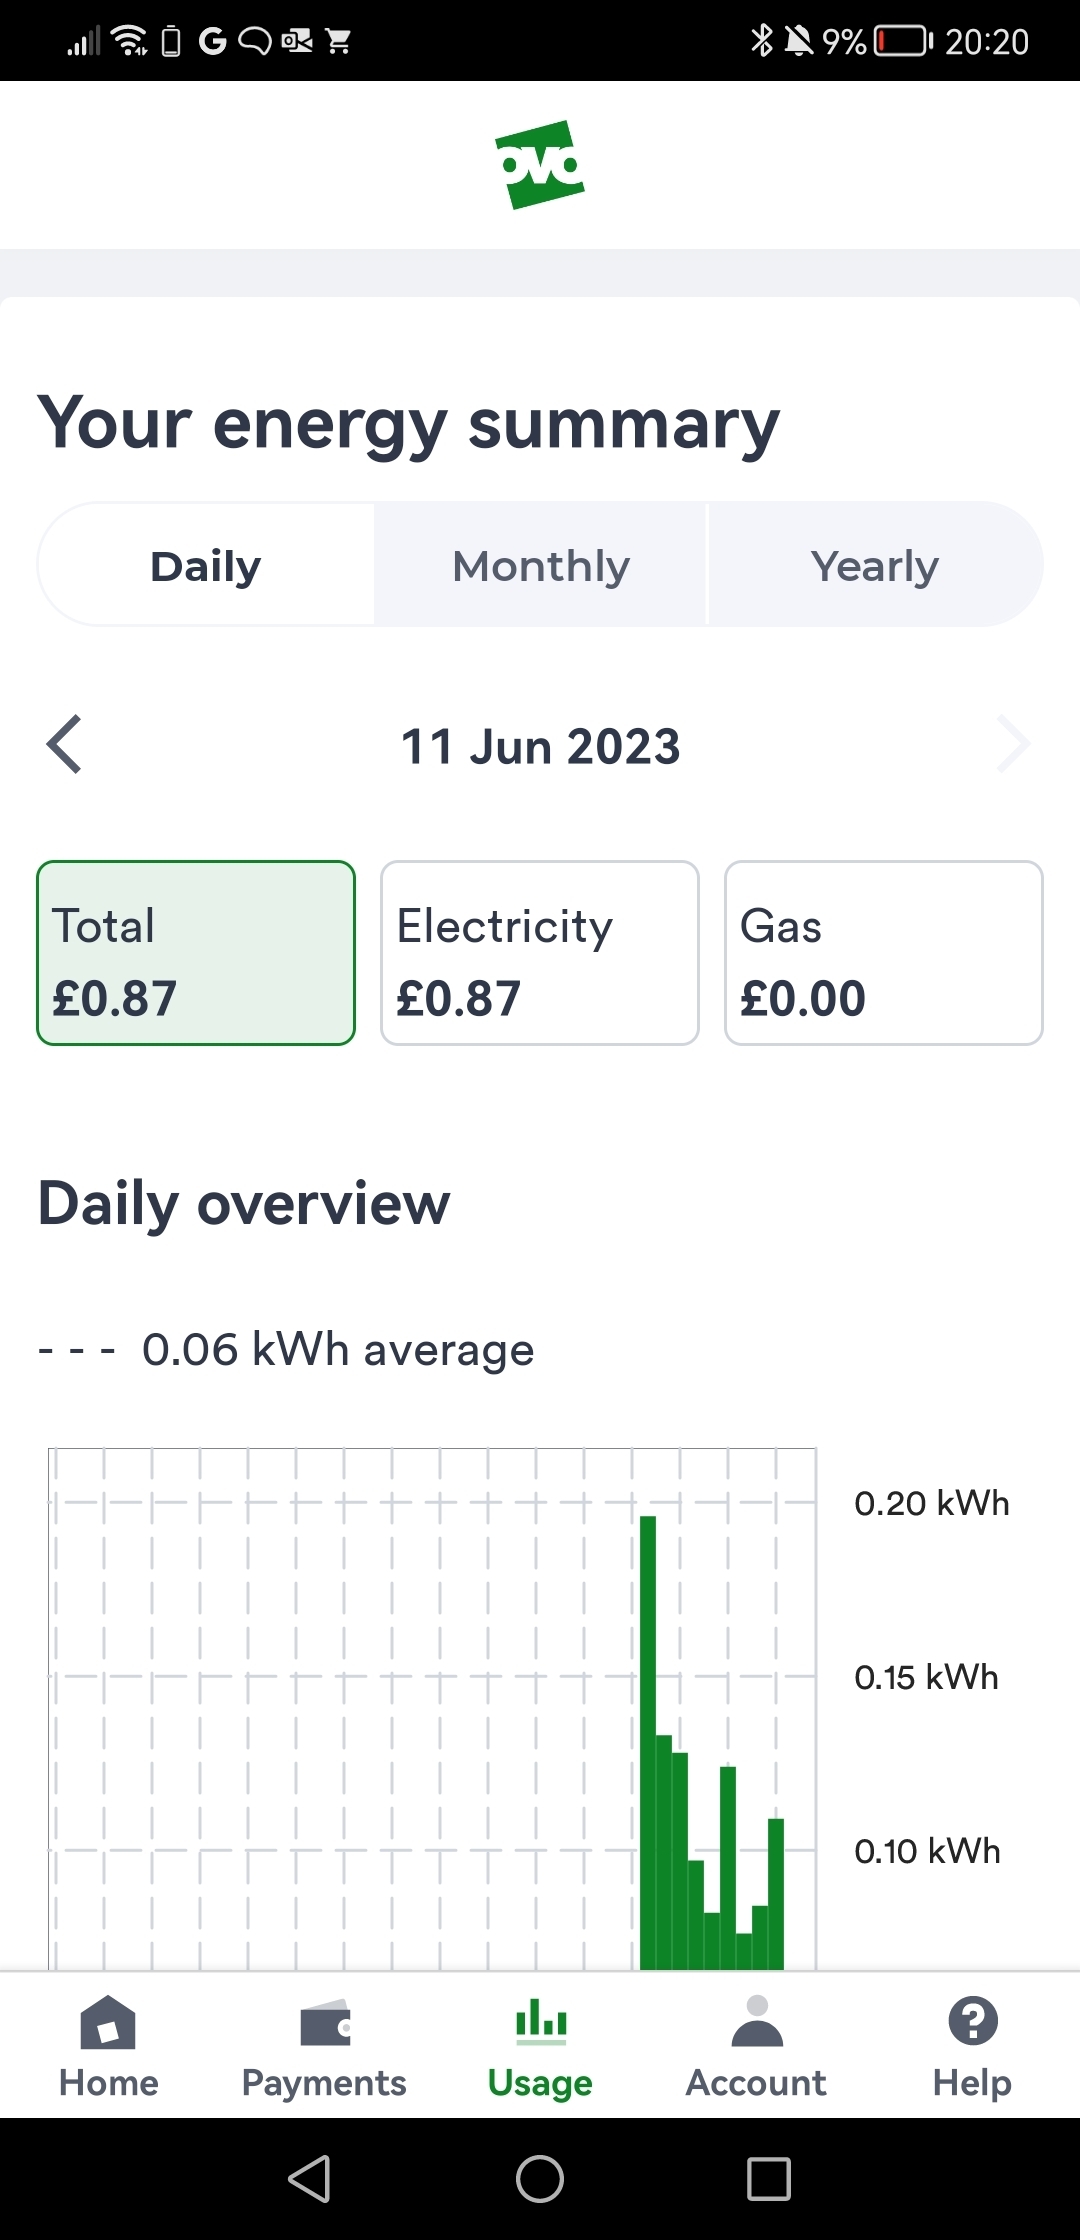
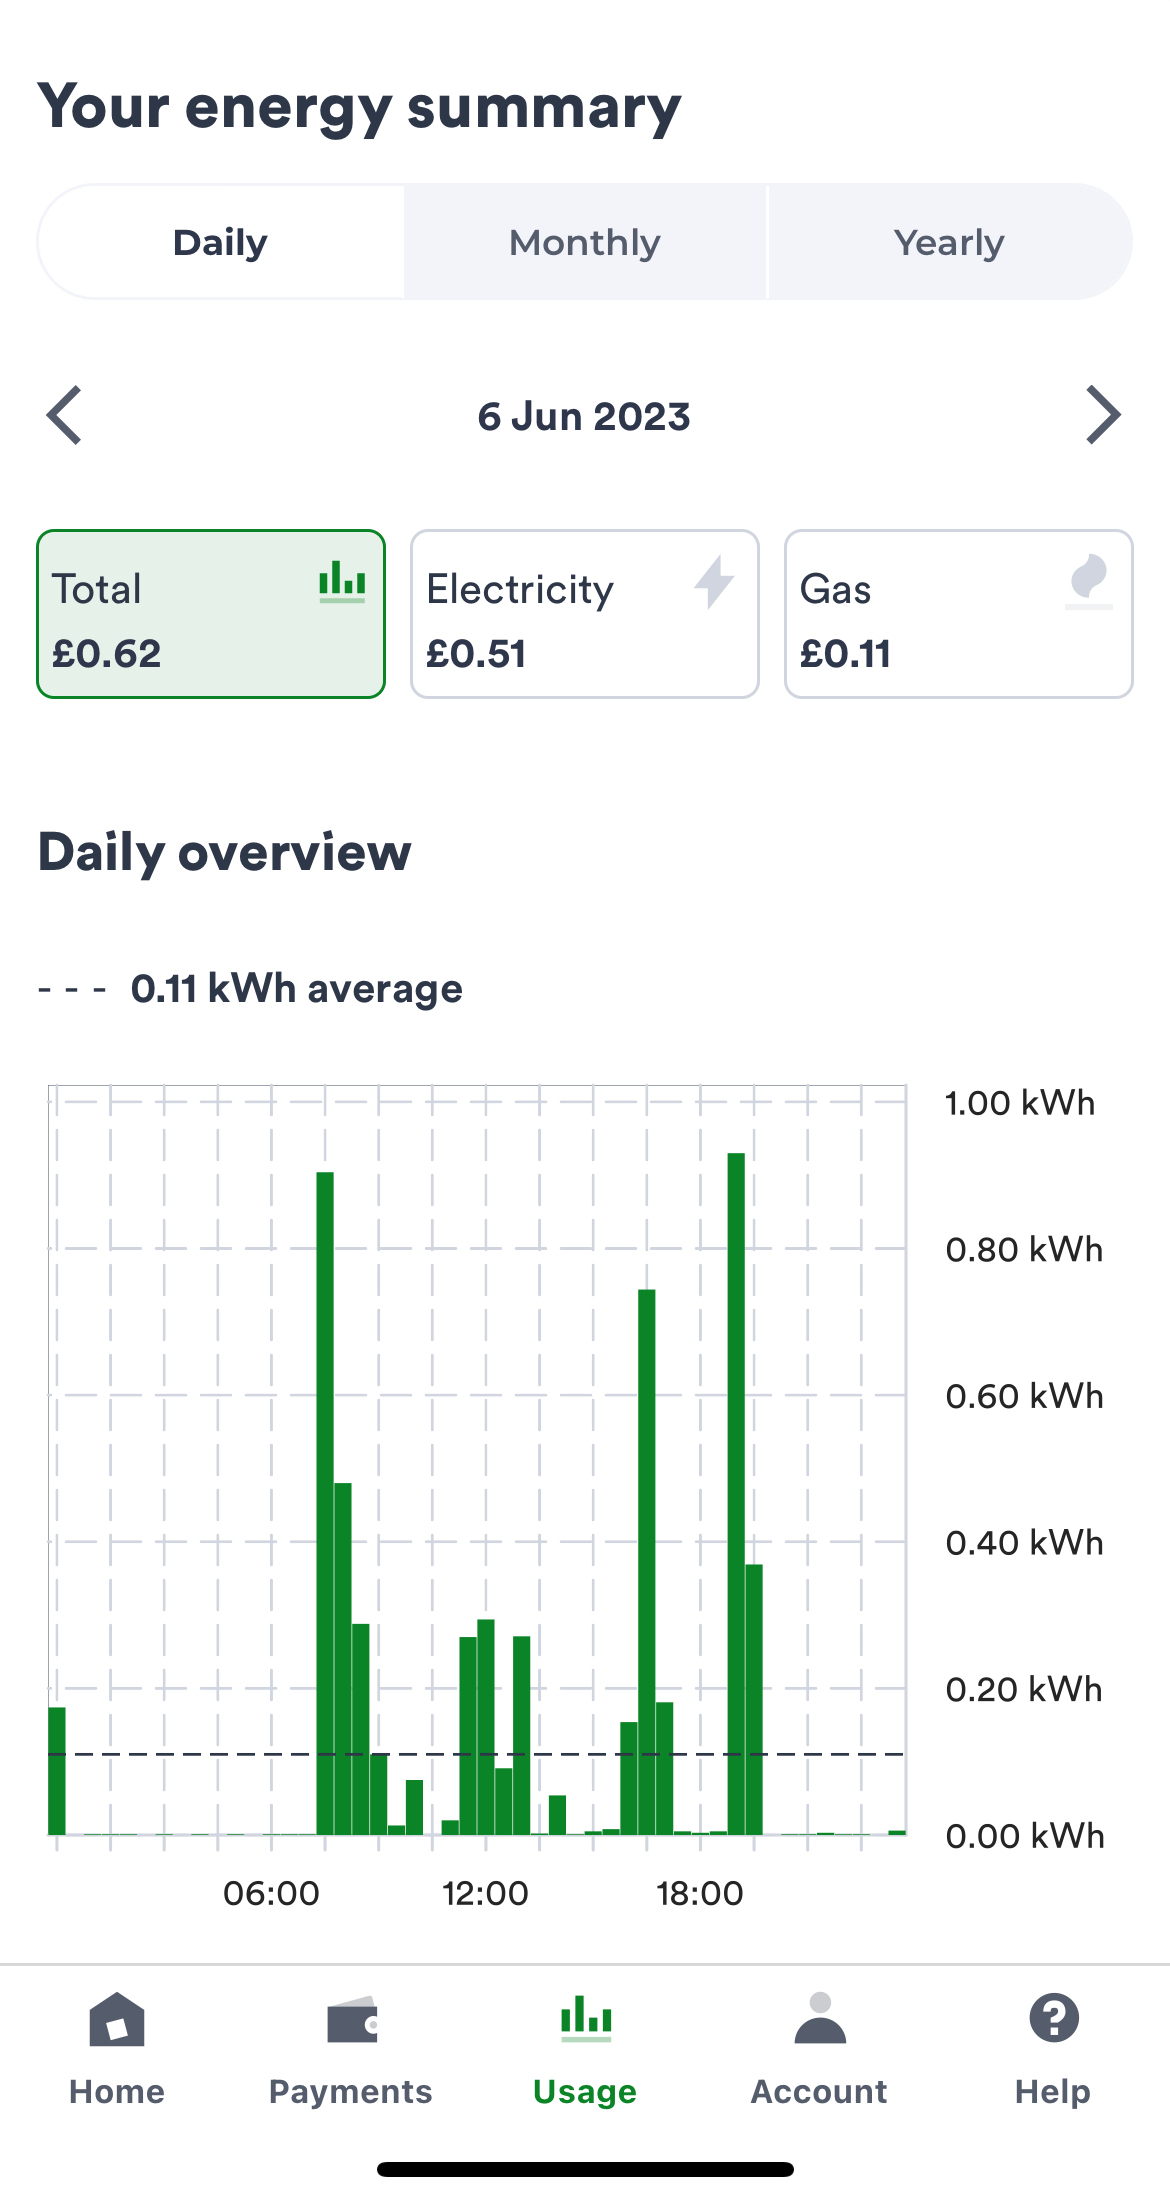
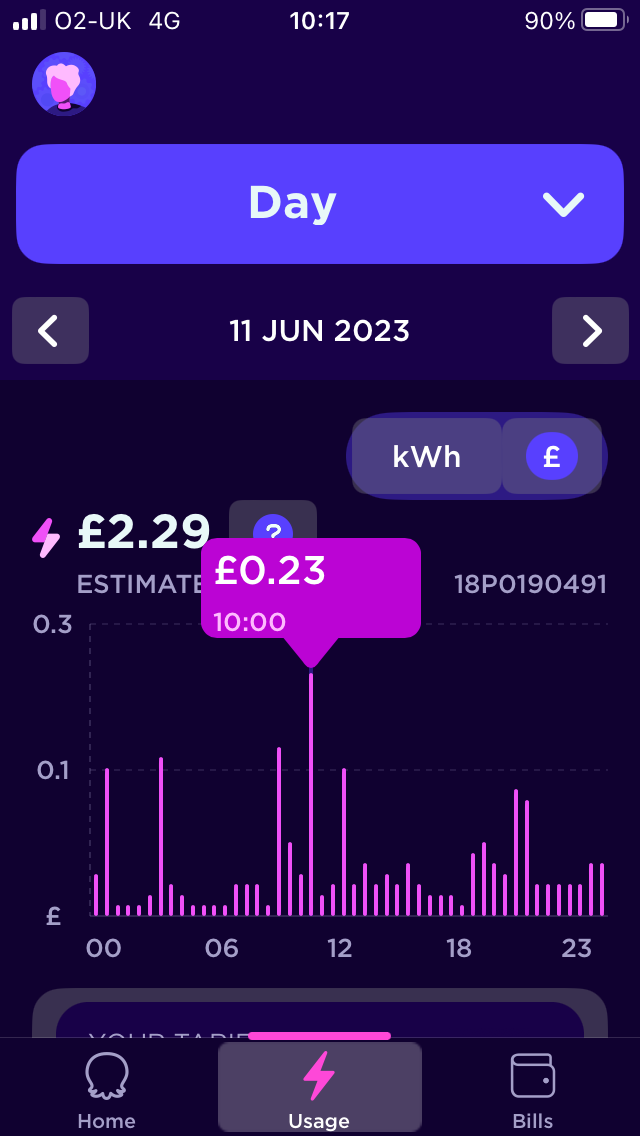
The daily usage page on the website and the app doesn't currently show cost data for the 30min/hourly slots. It only displays kWh data for the slots. 

It would be useful to show cost data. 

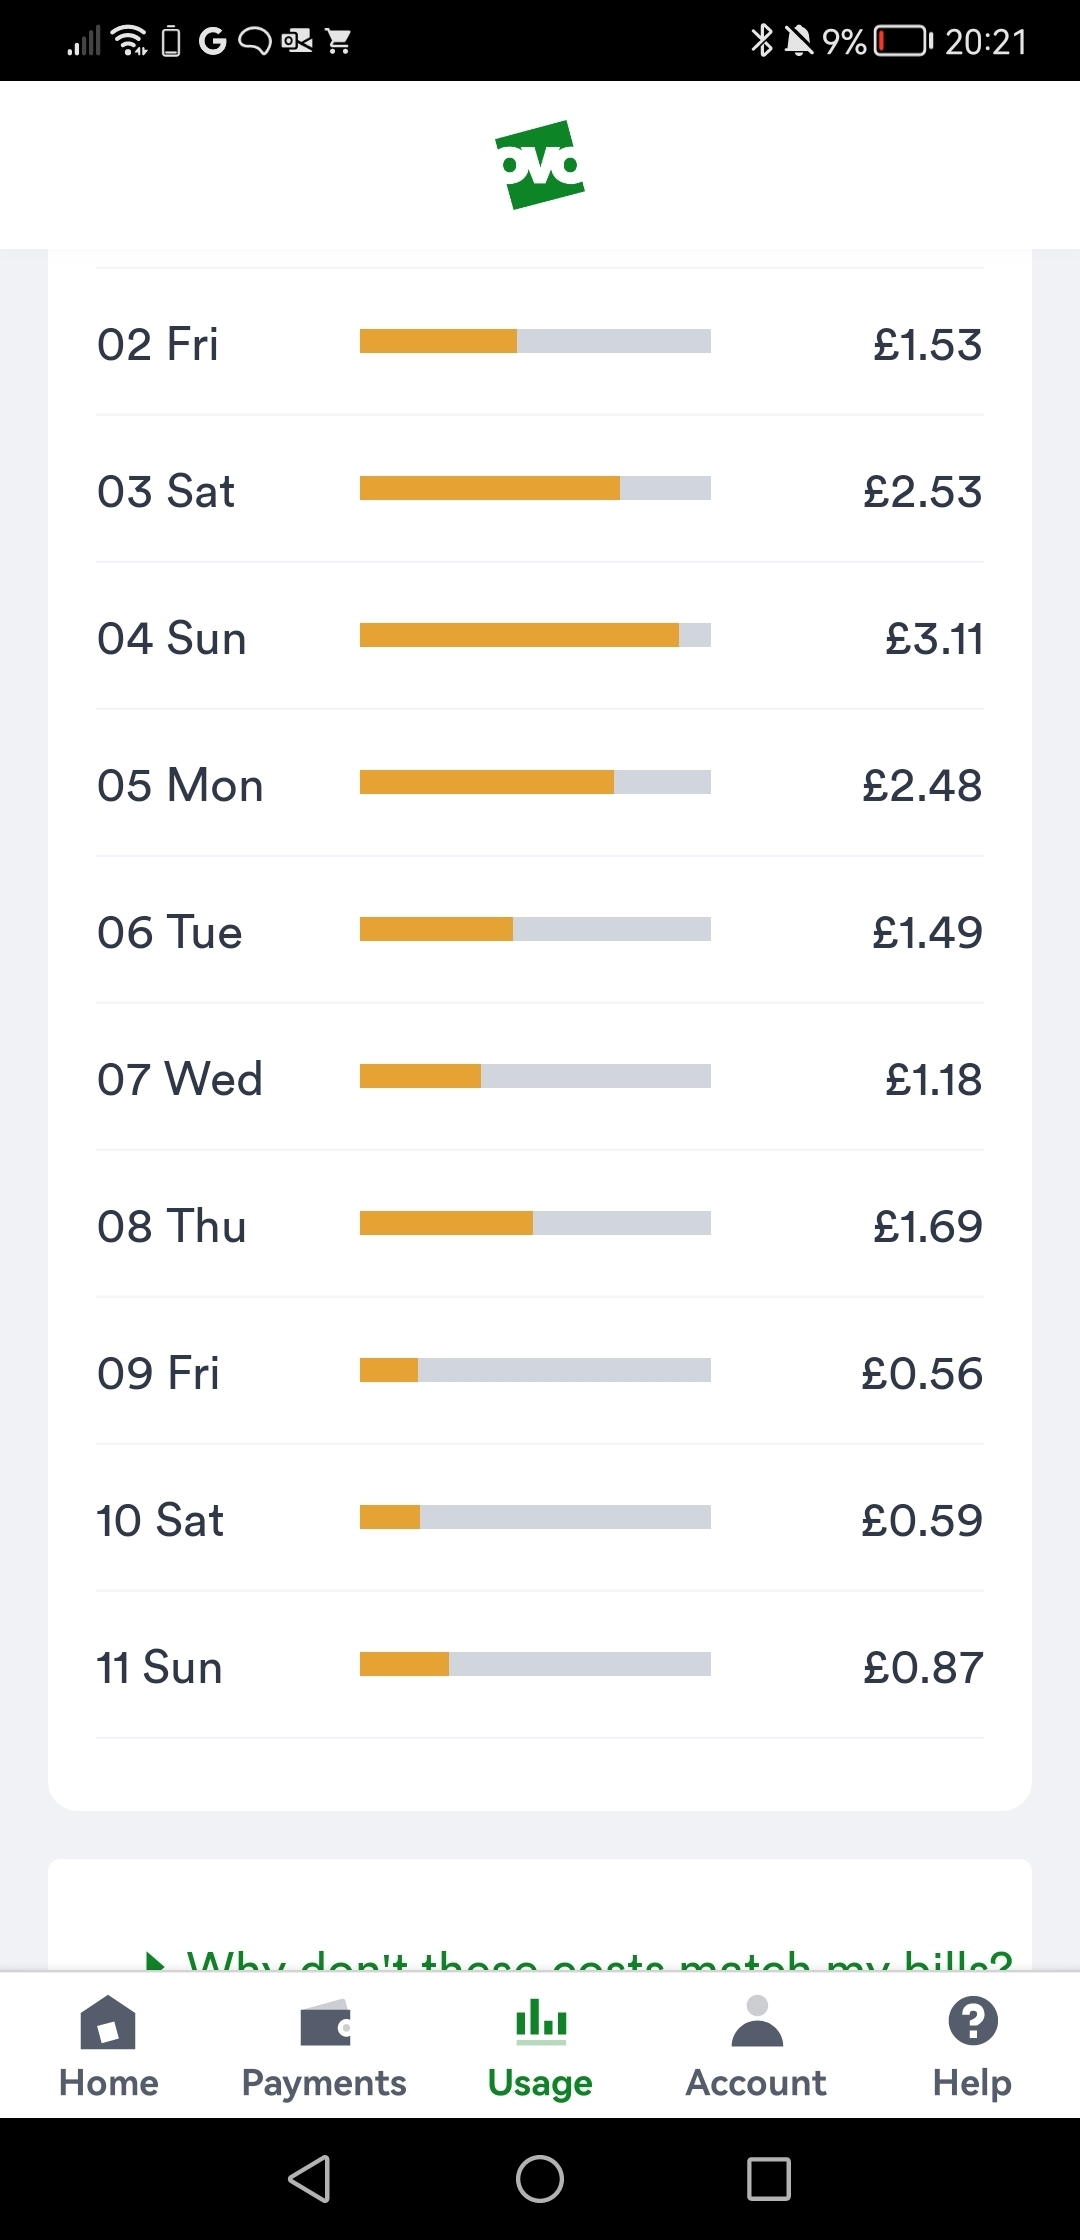
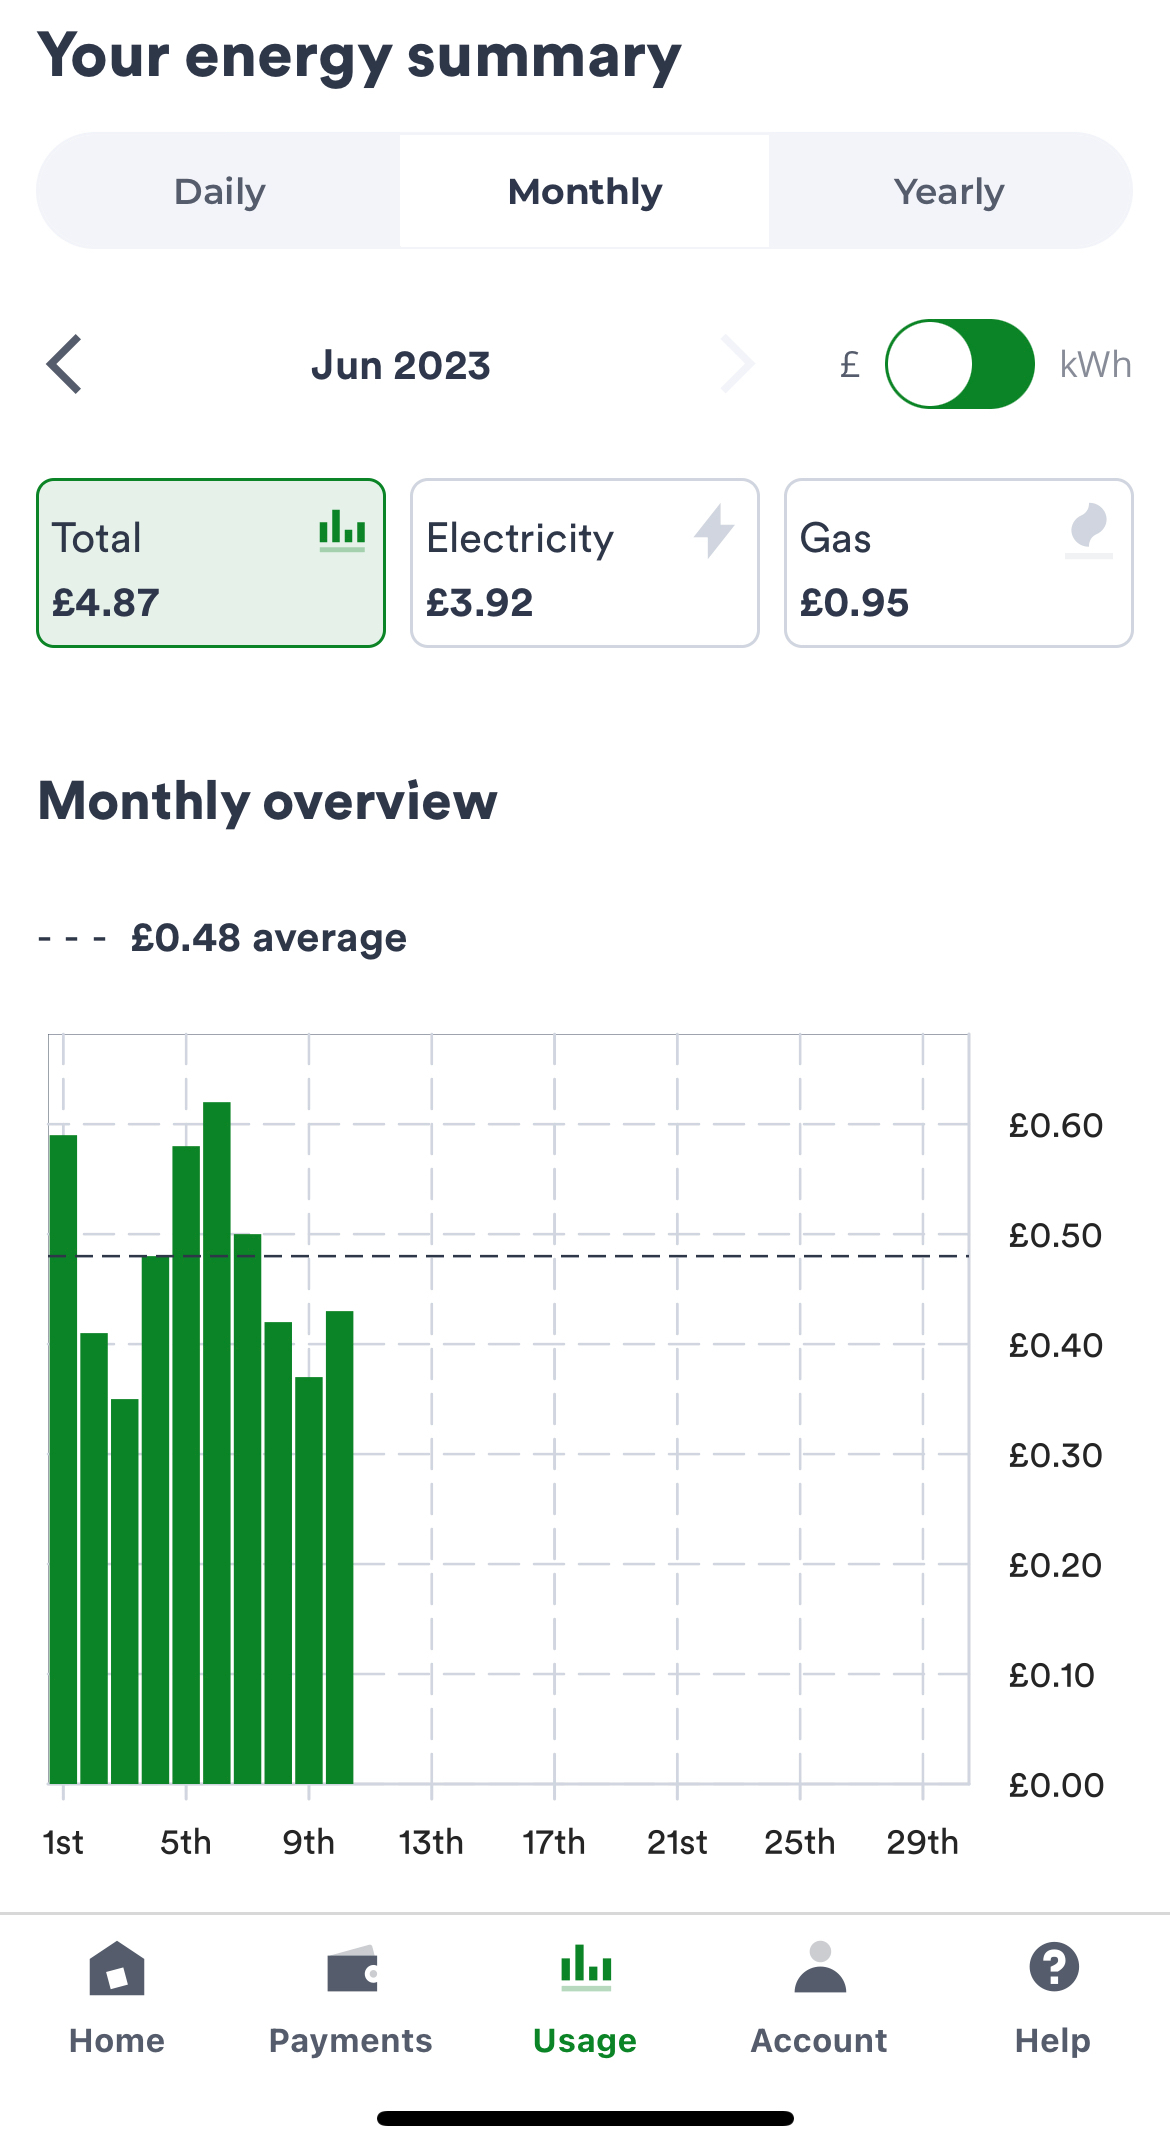
It is available on the monthly and yearly page. 


Thanks for this one, @Jeffus - I’m confident we’ll be able to get some quick insight into the reasoning behind this lack of costs for 30 min intervals. This looks like a choice rather then a functionality improvement. Perhaps the costs at that time interval are just too small to make it insightful. 


I’ll change the status of this to ‘Open for votes’ so our product teams are aware and I’ll be back with an update when I have it. 


Updated idea statusNewOpen for votes

Thanks for this one, @Jeffus - I’m confident we’ll be able to get some quick insight into the reasoning behind this lack of costs for 30 min intervals. This looks like a choice rather then a functionality improvement. Perhaps the costs at that time interval are just too small to make it insightful. 


I’ll change the status of this to ‘Open for votes’ so our product teams are aware and I’ll be back with an update when I have it. 

@Tim_OVO i agree the costs use to be not too bad.

Unfortunately with prices rising, personally i think 30min prices over winter are going to be absolutely critical for a lot of us to keep an eye on, particularly for heating costs, whether that is gas or electricity. I will certainly be keeping an eye on ours. 

I wonder how many others will be? 


@Jeffus I’m voting for this one, but (re your other recent post) it would also be useful to have a note to say what the chart of prices does or doesn’t include, eg standing charge/vat etc. Also the numbers really ought to add up, so all 48 half hour numbers should equal the number for the day !!!


@Jeffus I’m voting for this one, but (re your other recent post) it would also be useful to have a note to say what the chart of prices does or doesn’t include, eg standing charge/vat etc. Also the numbers really ought to add up, so all 48 half hour numbers should equal the number for the day !!!

I think the numbers not adding up was a long running grip of another poster who has since left the forum…

I don't pretend to understand all the issues. 

Basically the bills are driven off the meter readings page

https://account.ovoenergy.com/meter-readings


Hey @juliamc,


Thanks for that contribution, that’s a really good idea!


It does seem that the usage graph not including other costs like standing charge, VAT etc. has caused confusion for some other customers. 


I think the purpose of the usage graph is to display just that, usage. So a disclaimer might be helpful… 


Then customers can use their live billing (if they are on half hourly readings) to keep up to date with their overall costs. 


Keep up the great ideas!


Hey @juliamc,


Thanks for that contribution, that’s a really good idea!


It does seem that the usage graph not including other costs like standing charge, VAT etc. has caused confusion for some other customers. 


I think the purpose of the usage graph is to display just that, usage. So a disclaimer might be helpful… 


Then customers can use their live billing (if they are on half hourly readings) to keep up to date with their overall costs. 


Keep up the great ideas!

The fact that the in home display includes VAT and standing charge but the Usage page doesn't often confuses people.

There are proposals to do away with standing charges completely, simply including the standing charge cost in the unit cost.

OVO and others have campaigned for this. It would be really good for low energy users who pay a high proportion of their costs in standing charges. 


Hey @Jeffus,


That’s really great input there.


It’ll be interesting to see if the scrapping of standing charge is brought in, probably not anytime soon with the Energy Crisis taking priority? 


You’re right it would be beneficial for those who are low users. Just a thought I've had... if the cost is absorbed by higher unit rates would it still mean they are paying standing charge just in a different form? 


What do we think?


There did use to be tariff with no or low standing charges so it is not a new concept

Basically low users would end up paying less overall and high users would end up paying more.


Any update on this from the product team @Tim_OVO ?

I don't think they have ever commented on it?

It is a regular query that appears on the forum


Just reviewing this idea, of course most of the third party apps do show 30 min data and generally you can choose to show kWh or cost. On the Hugo app, although the chart doesn’t show standing charges or vat, you can switch these on or off in the overall daily view


Just reviewing this idea, of course most of the third party apps do show 30 min data and generally you can choose to show kWh or cost. On the Hugo app, although the chart doesn’t show standing charges or vat, you can switch these on or off in the overall daily view

Yep, interesting that the other apps do

They also have experience in the National Grid Balancing scheme, which was rather limited directly with OVO unfortunately this year.

Be interesting to see how these 3rd party apps evolve in terms of the service they offer. 


Quick check, this feature is now available for users of the OVO app, is that correct, @BPLightlog @Blastoise186?


I’ve seen a screenshot from Blastoise over the weekend that shows a daily cost and HH cost...


I can see cost on the OVO app for daily use - just not same day


It seems to be partially implemented. Bear with me!


No @Tim_OVO 

This was about seeing the cost on the 30min slots. As @Blastoise186 says this isn't available.


What is available is a total for the day on the daily tab. 

Given we may see a lot of time of use tariffs going forward, it would be good to see this at some stage, hence the votes.

It also quite regularly confuses posters not being able to see it, we get posts ever month i suspect. 


I can see little point in trying to display half-hourly costs, at least for electricity. It would involve another level of calculation involving at least two look-ups (unit price and TOU) for little benefit with a higher potential for error. The ‘average’ household consumes about 8kWh a day costing about £2.50 at current prices, so one could imagine a scale reaching up to an order of magnitude higher. You would have to be using at least 35W to register 1p on a cost chart. I can’t see what could be read from a chart like that that isn’t clear from the usage chart.

The Bright app does display half-hourly costs; here are Sunday’s:  


I’m not sure what this tells me that I didn’t already know. No upvote from me, I’m afraid; I’d rather the devs got on with something that matters.


The only point in this (although I tend to agree with Firedog) is as he’s pointed out, others do offer this information (Bright, Hugo, SmartThings, ivie) .. some even enhancing their data feeds recently. I did begin to watch my 30 min data via the Hildebrand IHD and Bright app but have reduced my usage recently. Whether this will increase again during winter who knows. But if the others can offer the information, why not the supplier?


I can see little point in trying to display half-hourly costs, at least for electricity. It would involve another level of calculation involving at least two look-ups (unit price and TOU) for little benefit with a higher potential for error. The ‘average’ household consumes about 8kWh a day costing about £2.50 at current prices, so one could imagine a scale reaching up to an order of magnitude higher. You would have to be using at least 35W to register 1p on a cost chart. I can’t see what could be read from a chart like that that isn’t clear from the usage chart.

The Bright app does display half-hourly costs; here are Sunday’s:  


I’m not sure what this tells me that I didn’t already know. No upvote from me, I’m afraid; I’d rather the devs got on with something that matters.


Fair comments. 

My thoughts were very different. 

With the move to electric vehicles and heat pumps picking up speed, the average usage of 8kWh will become meaningless in just a few years time for millions of people.

Even for us it is already meaningless for some of the not too cold days as we have switched from using our gas boiler quite so much and moved to using an electric heater if we just need a bit of heat in a room for a couple of hours. 

The number of new fossil fuel cars and new/replacement gas boilers is being dramatically limited by the government each year even before the outright ban. Manufacturers are being limited on the percentage of fossil fuel equipment they can sell going forward. 

If OVO continue to loose customers eyes to 3rd party apps they seriously run the risk of unexpectedly loosing customers. Uswitch and Bright have already built prototype  apps to do this, where they use customer 30min data to find the cheapest tariff or negotiate a cheap tariff. I have seen something similar happen in other sectors i have worked in. These 3rd apps don't just want our data, they ultimately all want us as customers and to take us away from OVO. They are already requesting a change in the rules to get 100% of the data off meters that suppliers can see. They have already been part of the National Grid balancing schemes over winter. This is just the start of their agenda. 

OVO run the potential risk of getting caught off guard at some stage in the future. Not for certain, but it is a risk. 

I do think suppliers need to keep up with their functionality while it is relatively easy and there isn't much tariff competition and these apps are relatively unknown. 

Also I would prefer i didn't need to look at any 3rd party apps, so if ovo offered the functionality that would be great. 

Is it a big deal at the moment, perhaps not, could it be in the future? Maybe. 

I would prefer to see ovo ahead of the game now. To have the best IT platform and operational processes. 


If the app just showed daily £ cost usage I would be happy, I don’t need ½ hour or hourly usage 


If the app just showed daily £ cost usage I would be happy, I don’t need ½ hour or hourly usage 

You can see yesterdays on the app on the daily and monthly tab. So 87p for me for Sunday. 


If the app just showed daily £ cost usage I would be happy, I don’t need ½ hour or hourly usage 

You should already be able to see that @adammcgrath either by day

Or via the month tab 

Just look across to the scale for the relevant day


Mine only shows kWh usage and not £ cost


Does half hourly cost appear if you touch each bar on graph? This is available on ‘you know who’.

The heat pump was running the hot water cycle at 10am btw!!


No, not on the OVO display but that’s how most others do it