




Comparison of heating sizing methods (simple to complex)
Many thanks for the suggestions for alternative ways of estimating heating demand and hence heat pump size. I have tried a few and the results are in!
Our Bryant’s Maldren house has a floor area of around 122 m2 and last year our gas usage (water plus heating) was around 9600 kWh.
In all of these methods the “Heat Transfer Coefficient” or HTC is the fundamental value that is calculated, basically how much power is needed to raise the temperature of the house by 1 °C.
Rule of thumb methods
The Michael de Podesta’s video provides an excellent introduction not only to his rule of thumb method but also heat loss calculations in general. It’s well worth watching. Thanks to
Michael de Podesta Rule of thumb
This is one of the easiest methods
- Heat Transfer Coefficient = Annual Usage / 57.3 (For the North West)
- 9600 / 57.3 = 168 W/K
This is actually calculated using:
- Annual Usage / Degree Days * 1000 / 24
Using average degree day from 1976 to 1995 may not be representative of last year’s temperatures. If I use my local degree day for 2023 then I get
- 9600 /1826 * 1000 / 24 = 220 W/K
Heat Geek Cheat Sheet
You can read full details at Heat Loss Calculation: Heat Pump & Boiler Sizing Guide (heatgeek.com)
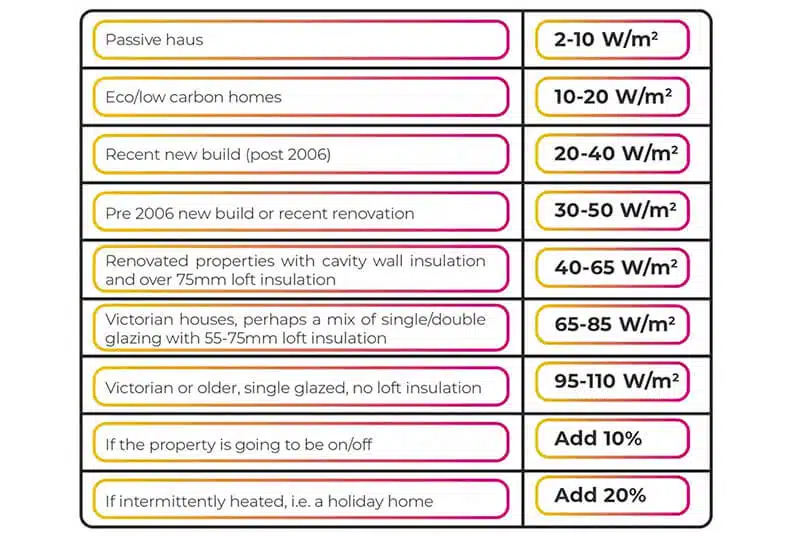
For our house (pre 2006) this equates
- Lower limit: 30 W/ m2 * 122 = 3.7 kW (155 W/K)
- Upper Limit: 50 W/ m2 * 122 = 6.1 kW (254 W/K)
Experimental Methods
These entail taking measurements of energy usage and outside temperature over a LONG period of time.
I have added an article Estimating Heat Pump or Boiler size using usage data and temperature | The OVO Forum (ovoenergy.com) which explains in detail how to use gas usage data from your smart meter (or even recoded manually) and local temperature or degree day data.
Weekly Gas Usage
For many (many!) years have I have collected our usage data so I can compare weekly (over many years), daily, over the past year, and even hourly (over the last winter).
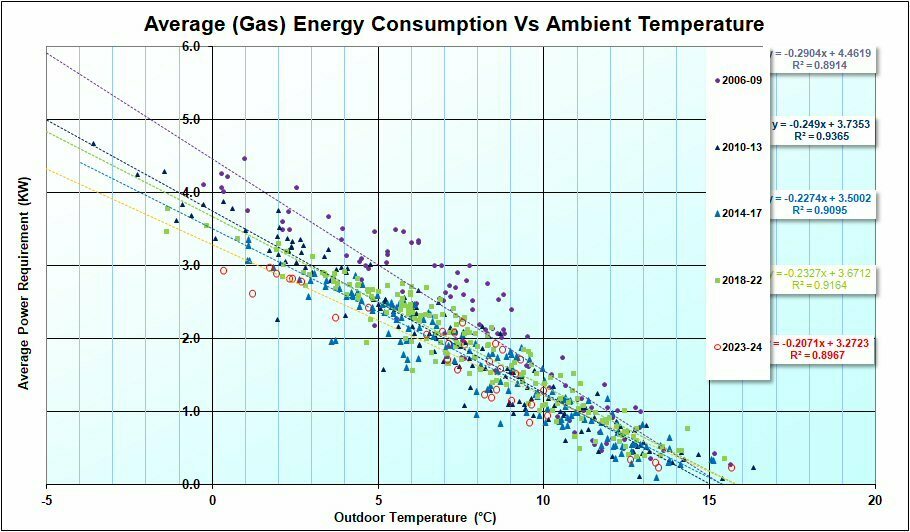
I originally used this data to see how well (or not) various energy saving measures worked.
The slope of the graph(s) provides the heat transfer coefficient of the house 207 W/K, and also the power demand at -3 °C (3.28 + -3 * 0.207) 3.9 kW.
Since this takes the daily usage and divides by 24 hr, this is probably too low. Should it really be over the 16 hours that the heating was on? But the early morning load will be dominated by replacing heat lost overnight so in reality it will be somewhere between the two.
- 24 Hour basis:
- Heat Transfer Coefficient: 207 W/K
- Power at -3 °C: 3.9 kW
- Heating only basis (16 hr):
- Heat Transfer Coefficient: 311 W/K
- Power at -3 °C: 5.85 kW
Daily Gas Usage

This data is averaged over a day.
- 24 Hour basis:
- Heat Transfer Coefficient: 115 W/K
- Power at -3 °C: 3.43 kW
- Heating only basis (16 hr):
- Heat Transfer Coefficient: 221 W/K
- Power at -3 °C: 5.34 kW
Gas used during a known stable period 17:00 to 22:00 hrs
With a smart meter it is possible obtain data for 30 minute periods, so it is possible to look at demand and temperature over a small period of time when the house temperature is stable.
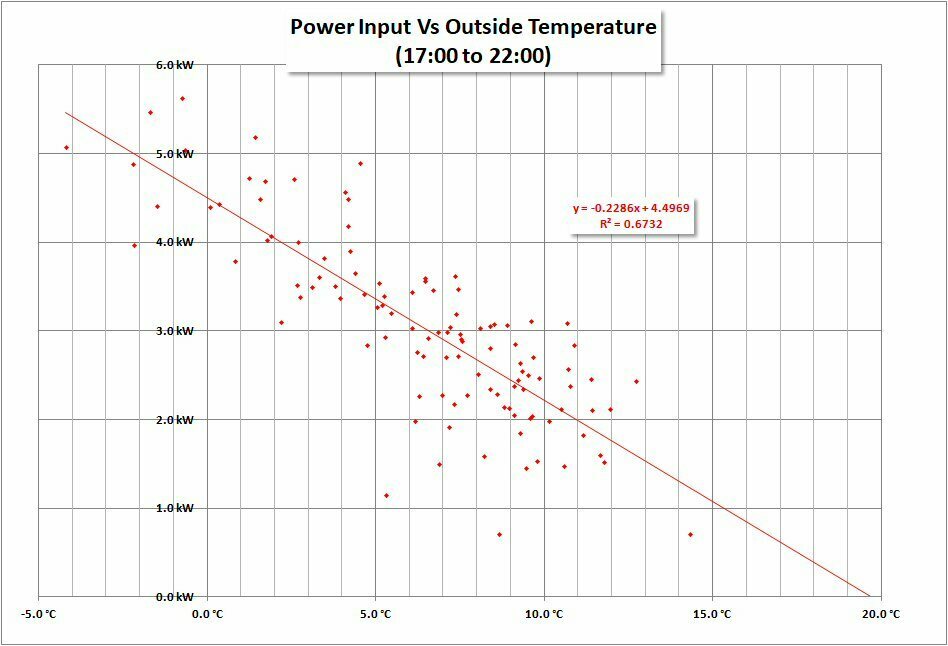
This data was collected over defined 5 hour period.
- Heat Transfer Coefficient: 229 W/K
- Power at -3 °C: 5.19 kW
Detailed Thermal Calculation
MCS Spreadsheet
I did try to complete the MCS calculator *edited by moderator*, however whether it was my version of Excel, or the version I downloaded, or maybe operator error I’m not sure but several selections returned #N/A so after trying a few rooms I sadly gave up! The results for the rooms I tried were broadly in line with the other two methods mentioned below, or maybe a little on the high side. (I did have problems with the floor calculations).
Heat Punk
Thanks to
Compared to filling in spreadsheets this was a delight to use! A few niggles with trying to find the appropriate walls and roofing but I was on a steep learning curve! Being able to draw the rooms, position them relative to each other, repeat for each floor, and then align the upper floor with the ground floor is ideal for calculating room to room heat conduction. It also allows for unheated rooms, such as conservatories.
The heat pump section is excellent and allows you to check if your chosen device is suitable.
HeatPunk calculated a design power requirement of 7.48 kW at -3 °C.
I couldn’t find the Heat Transfer Coefficient in the various reports, however working backward I think the Heat Transfer Coefficient is around 350 W/K.
My only criticism is that you cannot see the breakdown between the various losses (walls, windows, ventilation etc).
BeePee Spreadsheet
This spreadsheet actually dates back to 2007, but I have recently updated it.
I wasn’t sure how accurate it was so I compared its results with the HeatPunk calculations using the same default values for room temperature and air changes.
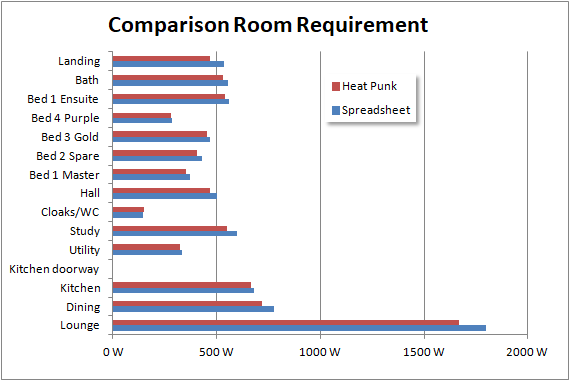

I was pleasantly surprised! My figures gave:
- Heat Transfer Coefficient: 353 W/K
- Power at -3 °C: 7.6 kW
An advantage of the HeatPunk and Spreadsheet methods is the ability to check if radiators are of sufficient size.

This appears to show that at least 6 of the 14 radiators are undersized!
However, the spreadsheet indicates an annual heating demand of 18427 kWh, compared with our annual TOTAL gas usage for 2003 of just less than 9600 kWh.
Obviously something is amiss!
The spreadsheet can also show the source of the heat losses.
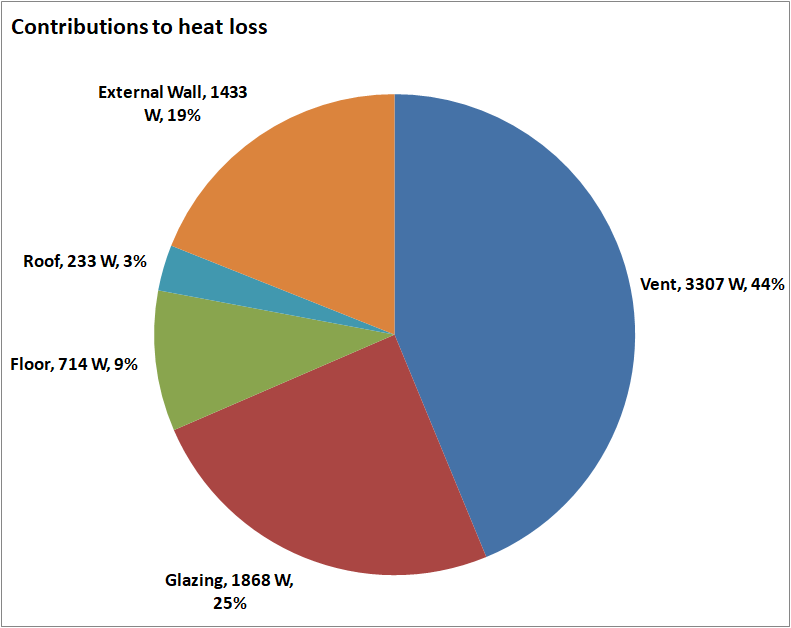
Do I believe that our house loses 44% of its heat through draughts? We do see an increase in energy usage on very windy days (5 to 10%), but 44%?
Looking at the layout of the rooms most of the air changes in the dining room will be via the lounge or kitchen so why the default 1.5 air changes per hour if the air is pre-heated.
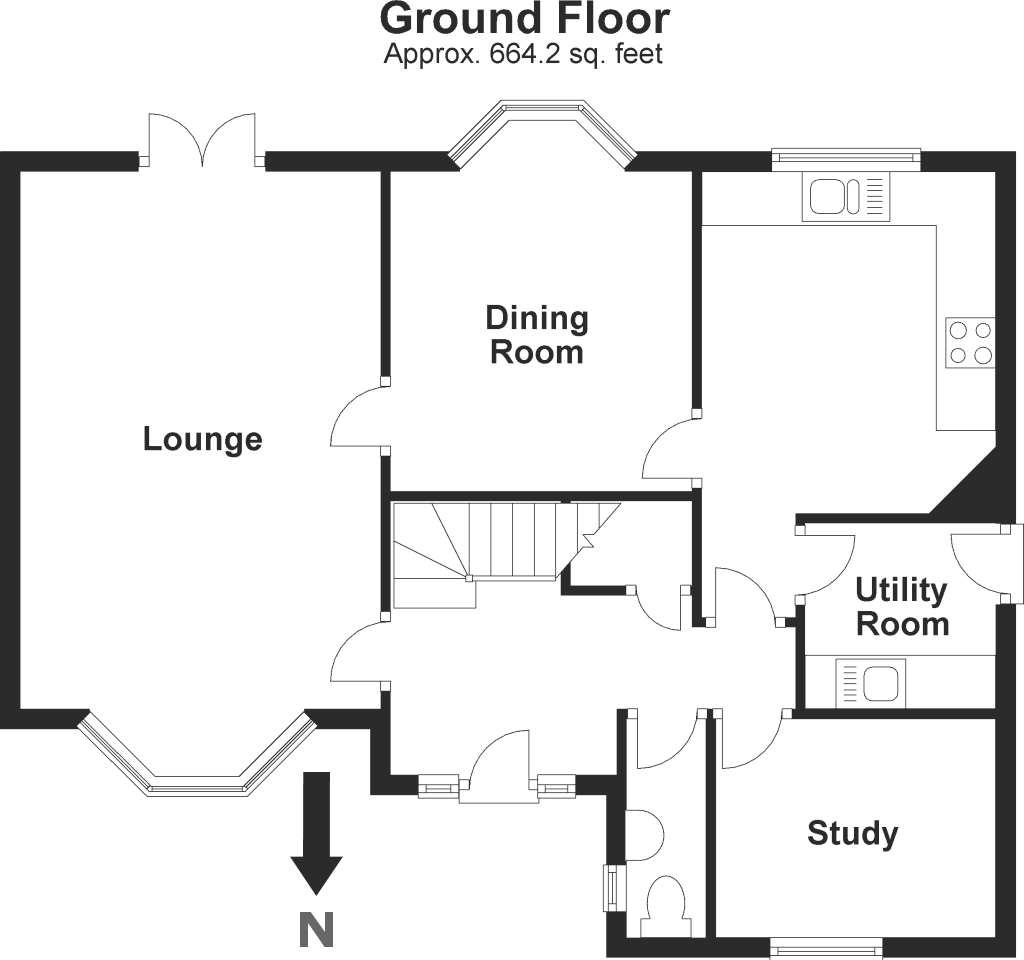
The models also assume default air temperatures for each room. If I use more “reasonable” ventilation rates, reducing its contribution from 44% to 33% this brings us down to:
- Heat Transfer Coefficient: 299 W/K
- Power at -3 °C: 6.4 kW
In Summary

Discussion
There appear to be two main discrepancies.
Heat Transfer Coefficient
Using the various plots of energy usage against temperature suggests a HTC of around 250 W/K significantly less than the calculated value of 296 W/K.
- There is no allowance for curtains: This could improve the ‘U’ value of windows from 2.8 to 2.3 W/m2K (-12 W/K).
- There is no allowance for wall cupboards (kitchen), built-in fixtures (bathroom), wardrobes (bedroom), furniture against external walls, unheated areas (conservatory) or planting against the walls. This could account for a 300 W reduction to the wall losses (-12 W/K).
- Floor losses seem to be a black art, and finding ‘U’ values for un-insulated flooring is not easy. Floor losses could be half (or double). Maybe ±200 W or ±5 W/K.
- Ventilation rates could still be on the generous side? Maybe a further 300 W or -12 W/K
If ALL worked in our favour this brings the calculated value down from 296 W/K to 255 W/K!
Degree Day Data
The MCS spreadsheet uses degree day data from the period 1976 to 1995. The Met Office Climate Portal provides more recent degree day data for the period 1981 to 2000 and 2001 to 2020. They also provide estimates based upon the amount of global warming.
- Midlands (MSC 1976 to 1995) 2197
- EGNX (DegreeDays.net East Midlands 2015-20) 2174
- Nottingham (Met Office 1981-2000) 2263
- Nottingham (Met Office 2001-2020) 2067
- Nottingham (Met Office +1.5°C warming) 1965
- My Data 2023 1826
One further factor is the “Base Temperature” used for calculating degree days. By default it is assumed that when the ambient temperature is below 15.5 °C a dwelling would require heating. Reducing the degree day base temperature would reduce the degree day value.
By fitting gas usage against degree days for a variety of base temperatures, and looking at the “coefficient of determination” or r-squared, which is basically a measure of how well the data fits, it is possible to determine (guess?) the optimum base temperature. When I did this it came out at 14.2 °C!
This lower value of “base temperature” might be because the house is now better insulated and heat from various electrical appliances (and the people in the house) now means that additional heating isn’t required until a lower temperature.
- My Local Data @15.5°C 1826
- My Local Data @15.0°C 1695
- My Local Data @14.5°C 1575
- My Local Data @14.0°C 1456
And the final result
- 250 W/K * 1456 / 1000 * 24 = 8.7 kWh for 2023 compared with an actual usage for heating of 7.3 kWh.
Close enough ??
Well if you reached here congratulations!!
If you want to try my spreadsheet (ABSOLUTELY NO WARRANTLY WHATSOEVER) you can download it from

