

Missing comparison bars on usage graphs. Data appears when cursor over the usage bar but no comparison bar (Black/Dark Grey)

Solved
Missing comparison bars on usage graphs
Best answer by Firedog
I use Edge. The lines are visible in the Stable version 121, but not in Dev or Canary 123. The lines are also visible if I manage to rotate the chart, e.g. by using split screen to make the window a lot narrower. This makes me think it’s either a Chromium thing or possibly unique to Edge 122+, because they’ve now disappeared from Stable 122. Nothing to do with a Windows update, I think.
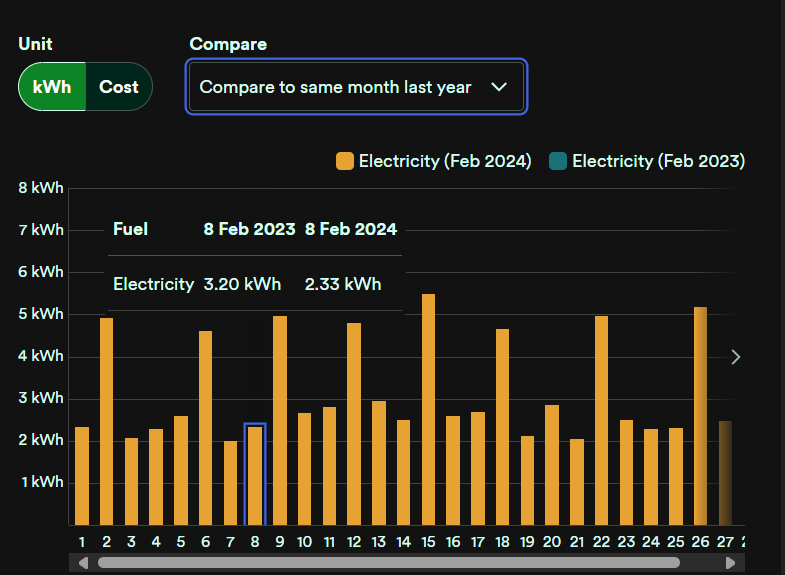
This is Stable:
Same version, narrow window:

I can’t explain it, I’m afraid. I’ll be submitting feedback to the Edge developers, but they’ll be handicapped by not having access to a page to test.


Reply
Log in to the OVO Forum
No account yet? Create an account
Enter your E-mail address. We'll send you an e-mail with instructions to reset your password.