
CO2 forecast for my region


juliamc
Carbon Catcher***
Forum|alt.badge.img+3
  • Carbon Catcher***
  • 1258 replies

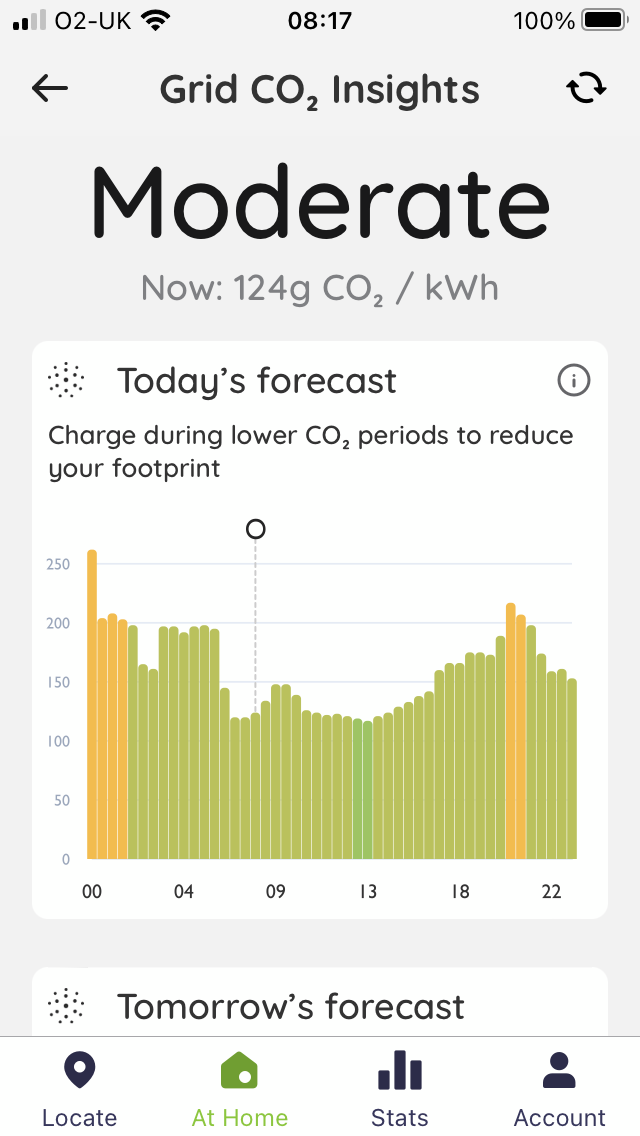
I have a PodPoint charger which doesn’t have many bells and whistles, not very smart and isn’t compatible with Charge Anytime…. However the app now has a great new lookup function which gives the CO2 forecast for Today and Tomorrow for my region. Previously I’ve only found apps that give a figure for (I assume) the whole country or just a snapshot of the regions. 

7 replies

BPLightlog
Plan Zero Hero
Forum|alt.badge.img+5
  • Plan Zero Hero
  • 2734 replies
  • June 18, 2023

Interesting @juliamc. The forecast I believe is based on a regional generation mix as this will determine your more local level. 


juliamc
Carbon Catcher***
Forum|alt.badge.img+3
  • Author
  • Carbon Catcher***
  • 1258 replies
  • June 18, 2023

Most of our mix in the South East is from imports, according to the national grid app, so presumably French nuclear.


Firedog
Plan Zero Hero
Forum|alt.badge.img
  • Plan Zero Hero
  • 2035 replies
  • June 18, 2023
juliamc wrote:

… the national grid app, ....


Does the rudimentary 24-hour animated regional forecast in that app not help a bit?


juliamc
Carbon Catcher***
Forum|alt.badge.img+3
  • Author
  • Carbon Catcher***
  • 1258 replies
  • June 18, 2023

Ooh sounds like a different one can you post a link ?


BPLightlog
Plan Zero Hero
Forum|alt.badge.img+5
  • Plan Zero Hero
  • 2734 replies
  • June 18, 2023
juliamc wrote:

Ooh sounds like a different one can you post a link ?

Same one just click on ‘When to use’


juliamc
Carbon Catcher***
Forum|alt.badge.img+3
  • Author
  • Carbon Catcher***
  • 1258 replies
  • June 18, 2023

Ah, yes. Gives 24 hrs but doesn’t say it’s for ‘my’ region. 


Firedog
Plan Zero Hero
Forum|alt.badge.img
  • Plan Zero Hero
  • 2035 replies
  • June 19, 2023
juliamc wrote:

Ooh sounds like a different one can you post a link ?


I’m using this one: Carbon Intensity. If you scroll down to Regional data, you see how well or badly each region is doing. At the top of that section, there’s a little ▶ to start a 24-hour animation for the forecast levels in each region:


Cookie policy

We use cookies to enhance and personalize your experience. If you accept you agree to our full cookie policy. Learn more about our cookies.

 
Cookie settings