Question

smart meter installed, usage now multiplied by 8 storage heating

  • February 4, 2026
  • 15 replies
  • 159 views

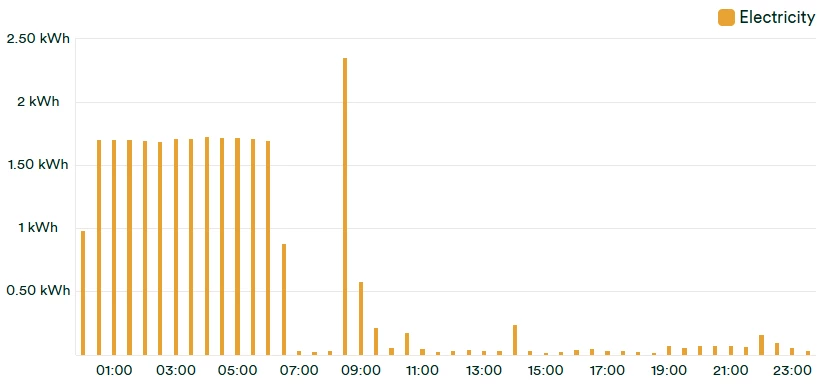
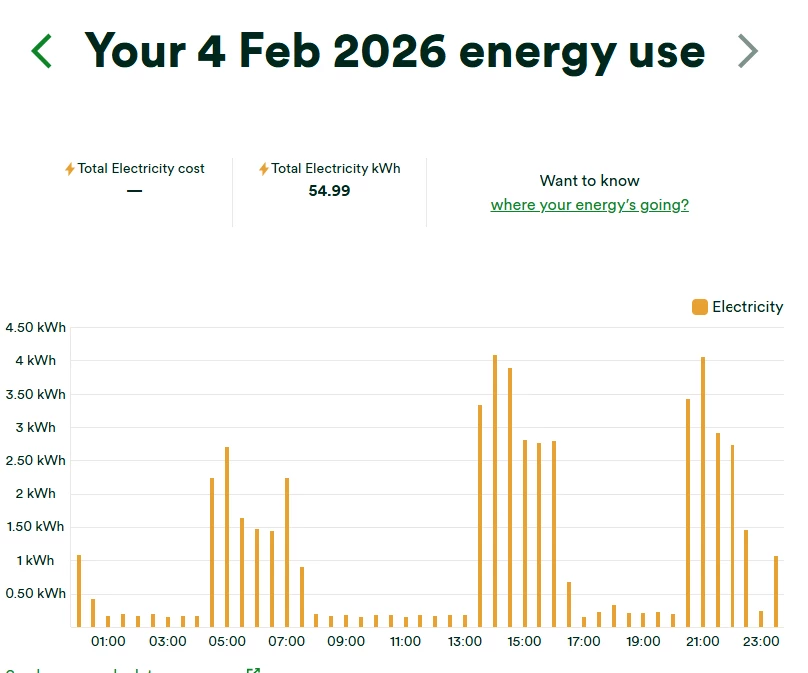
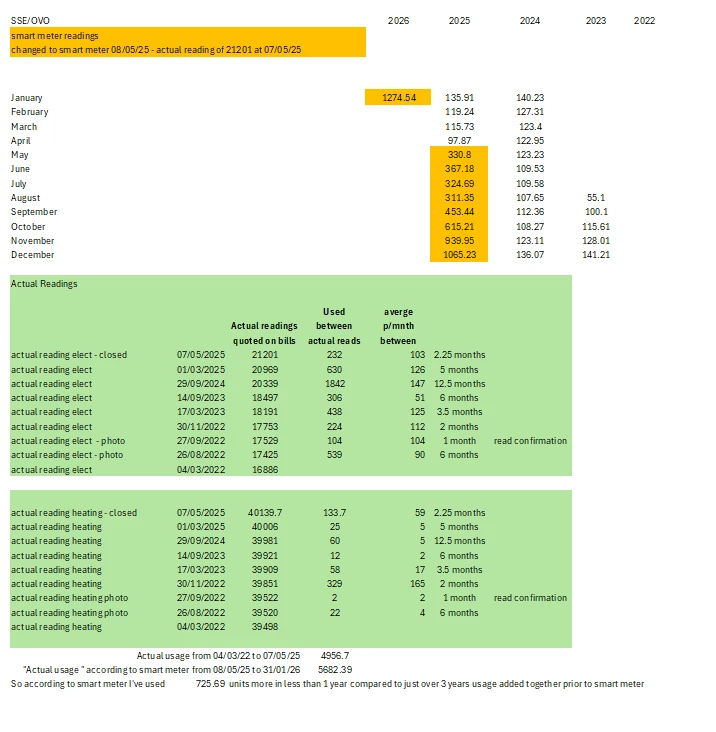
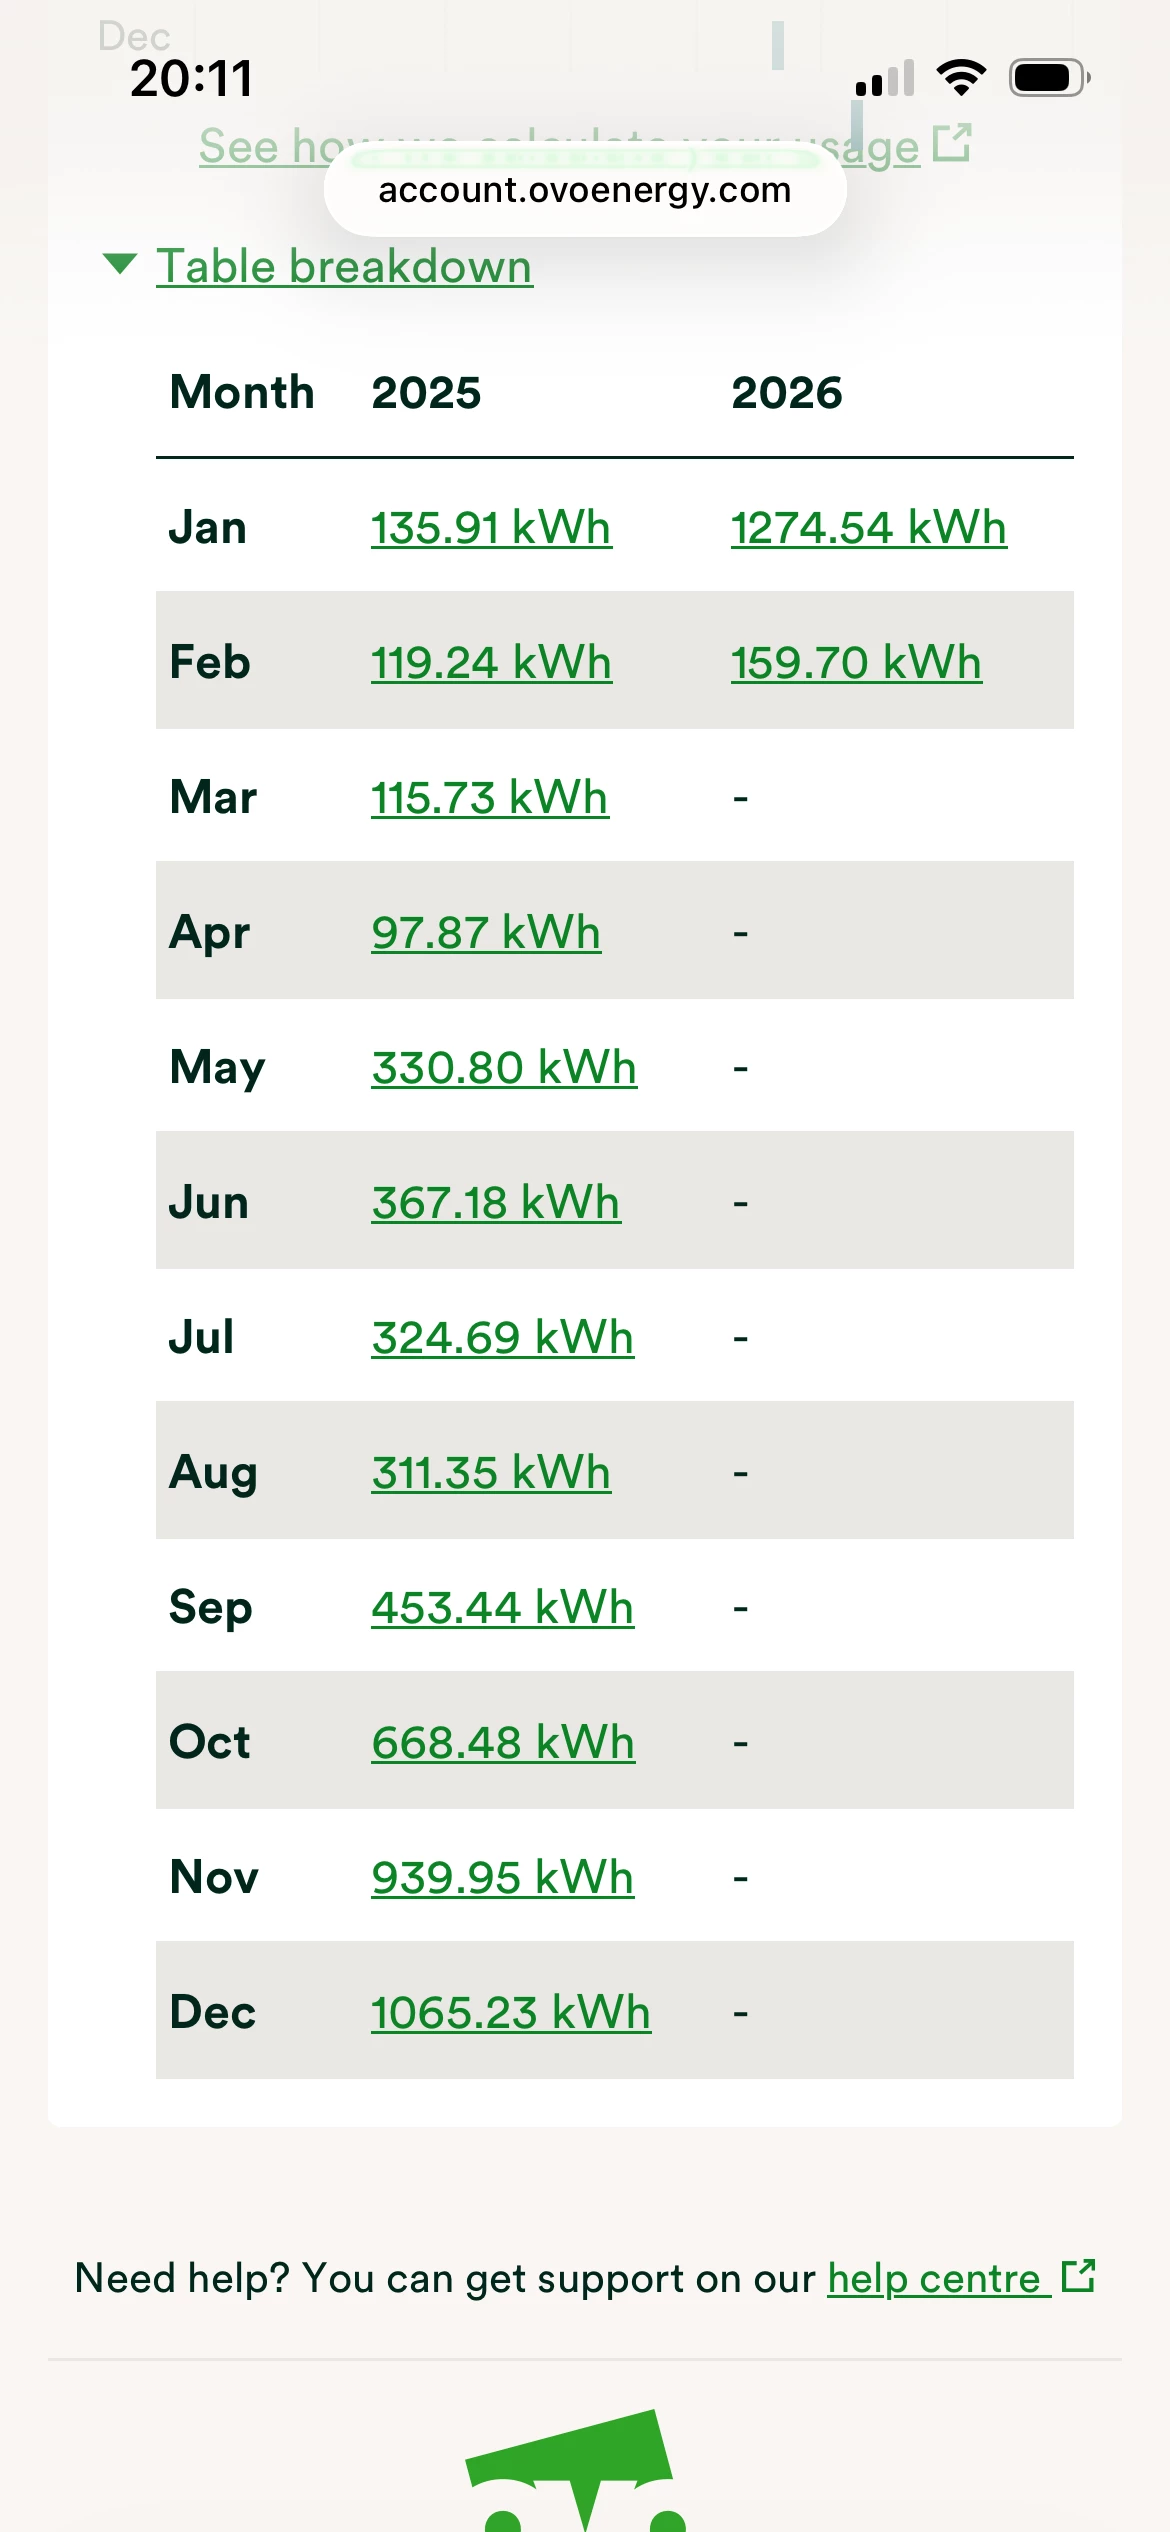
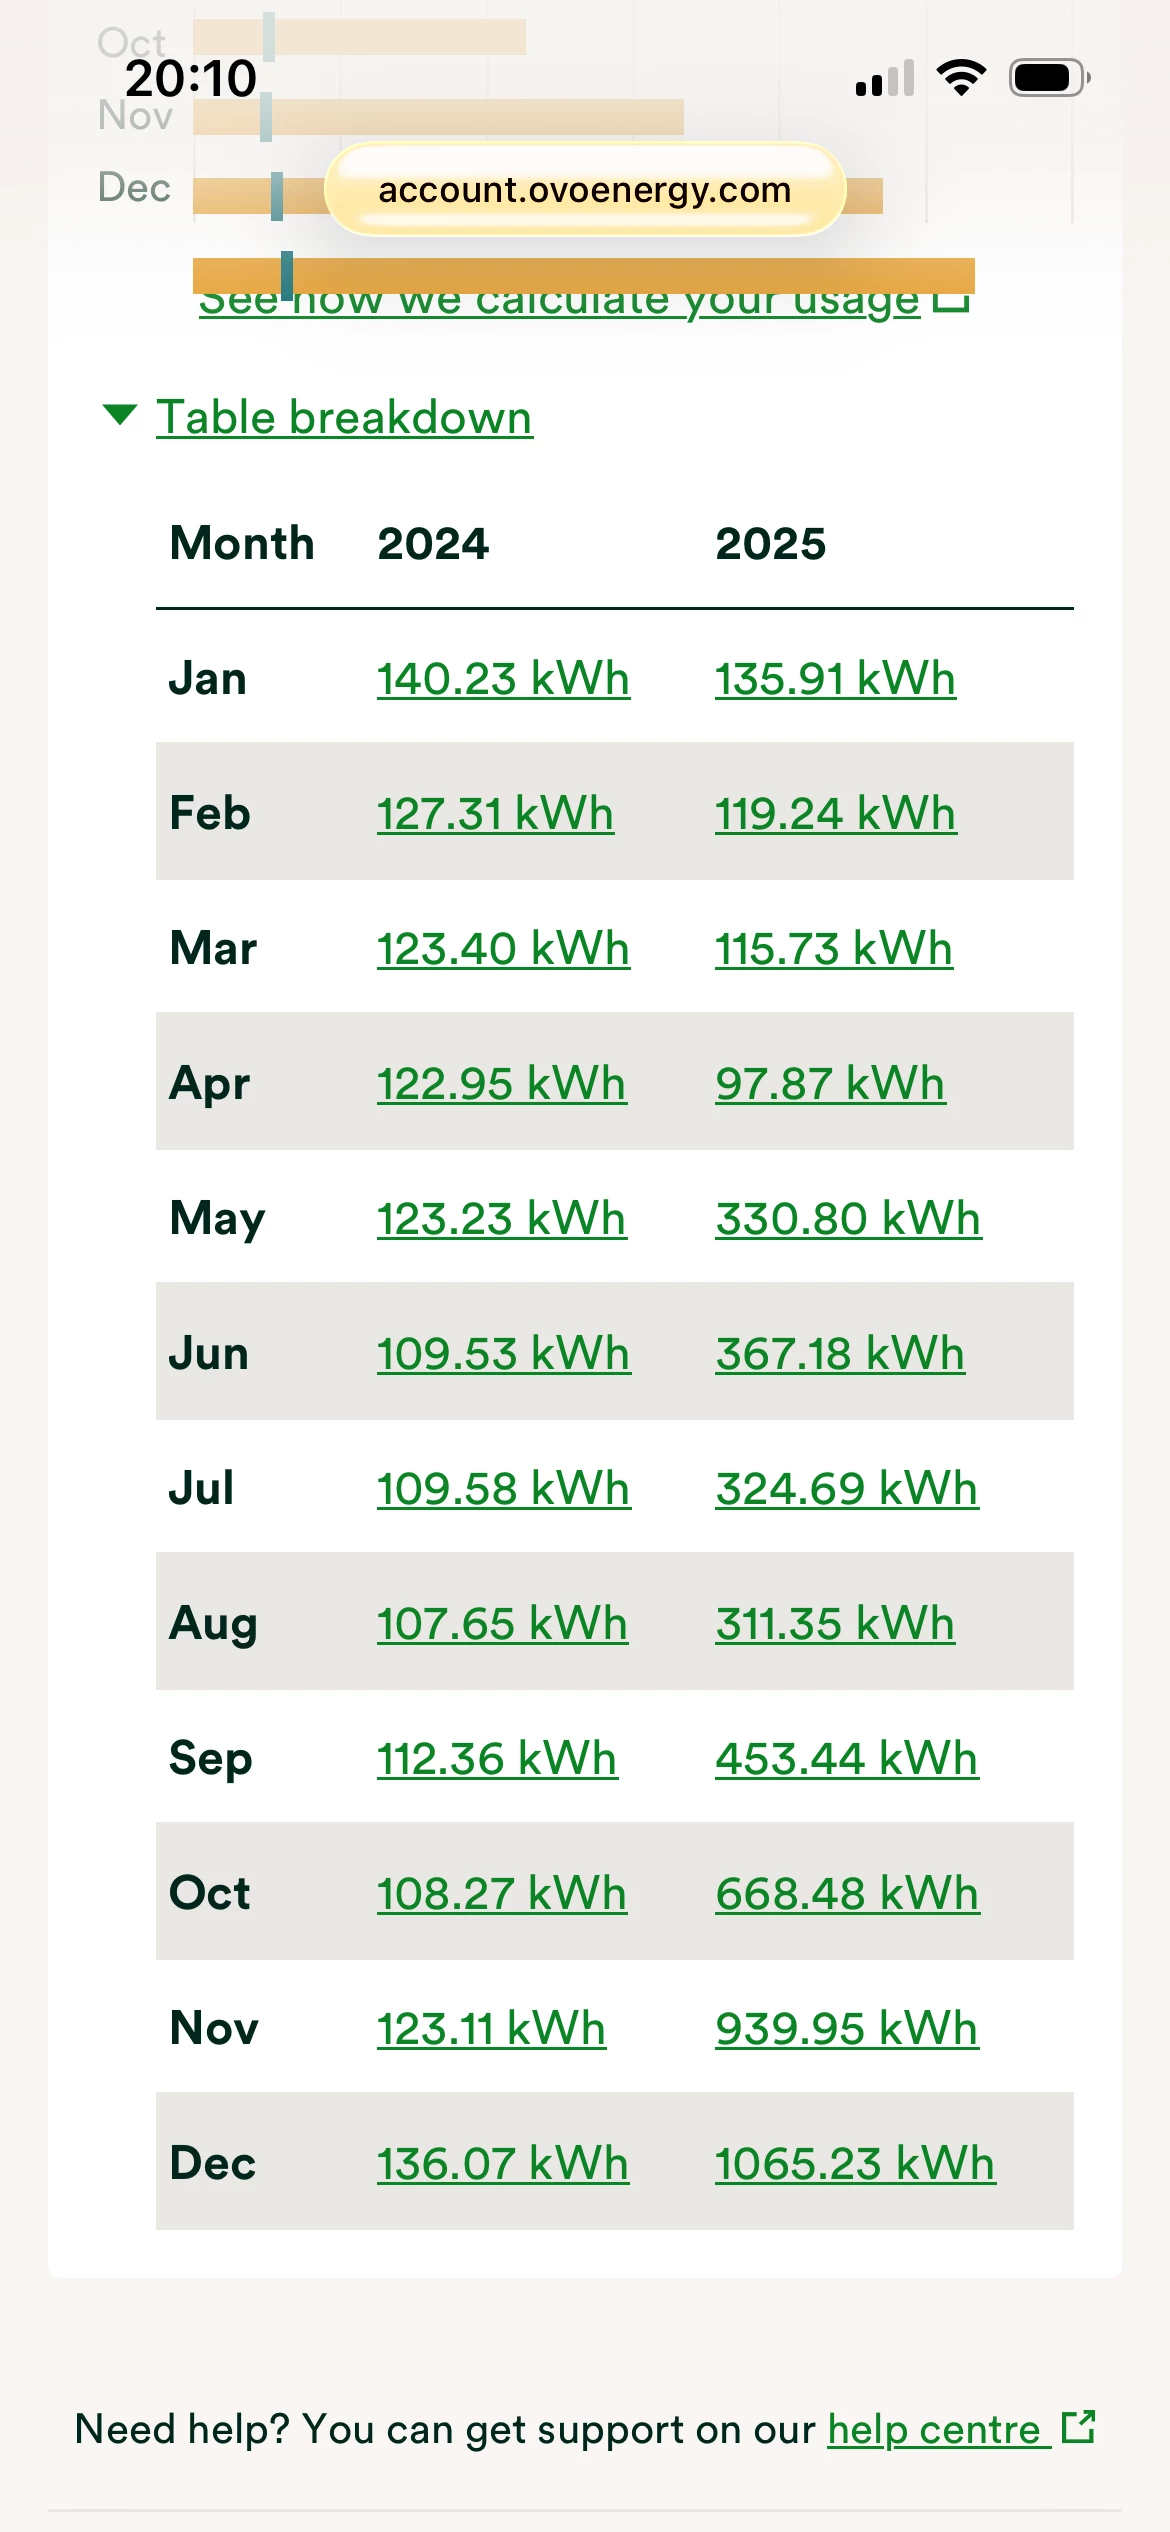
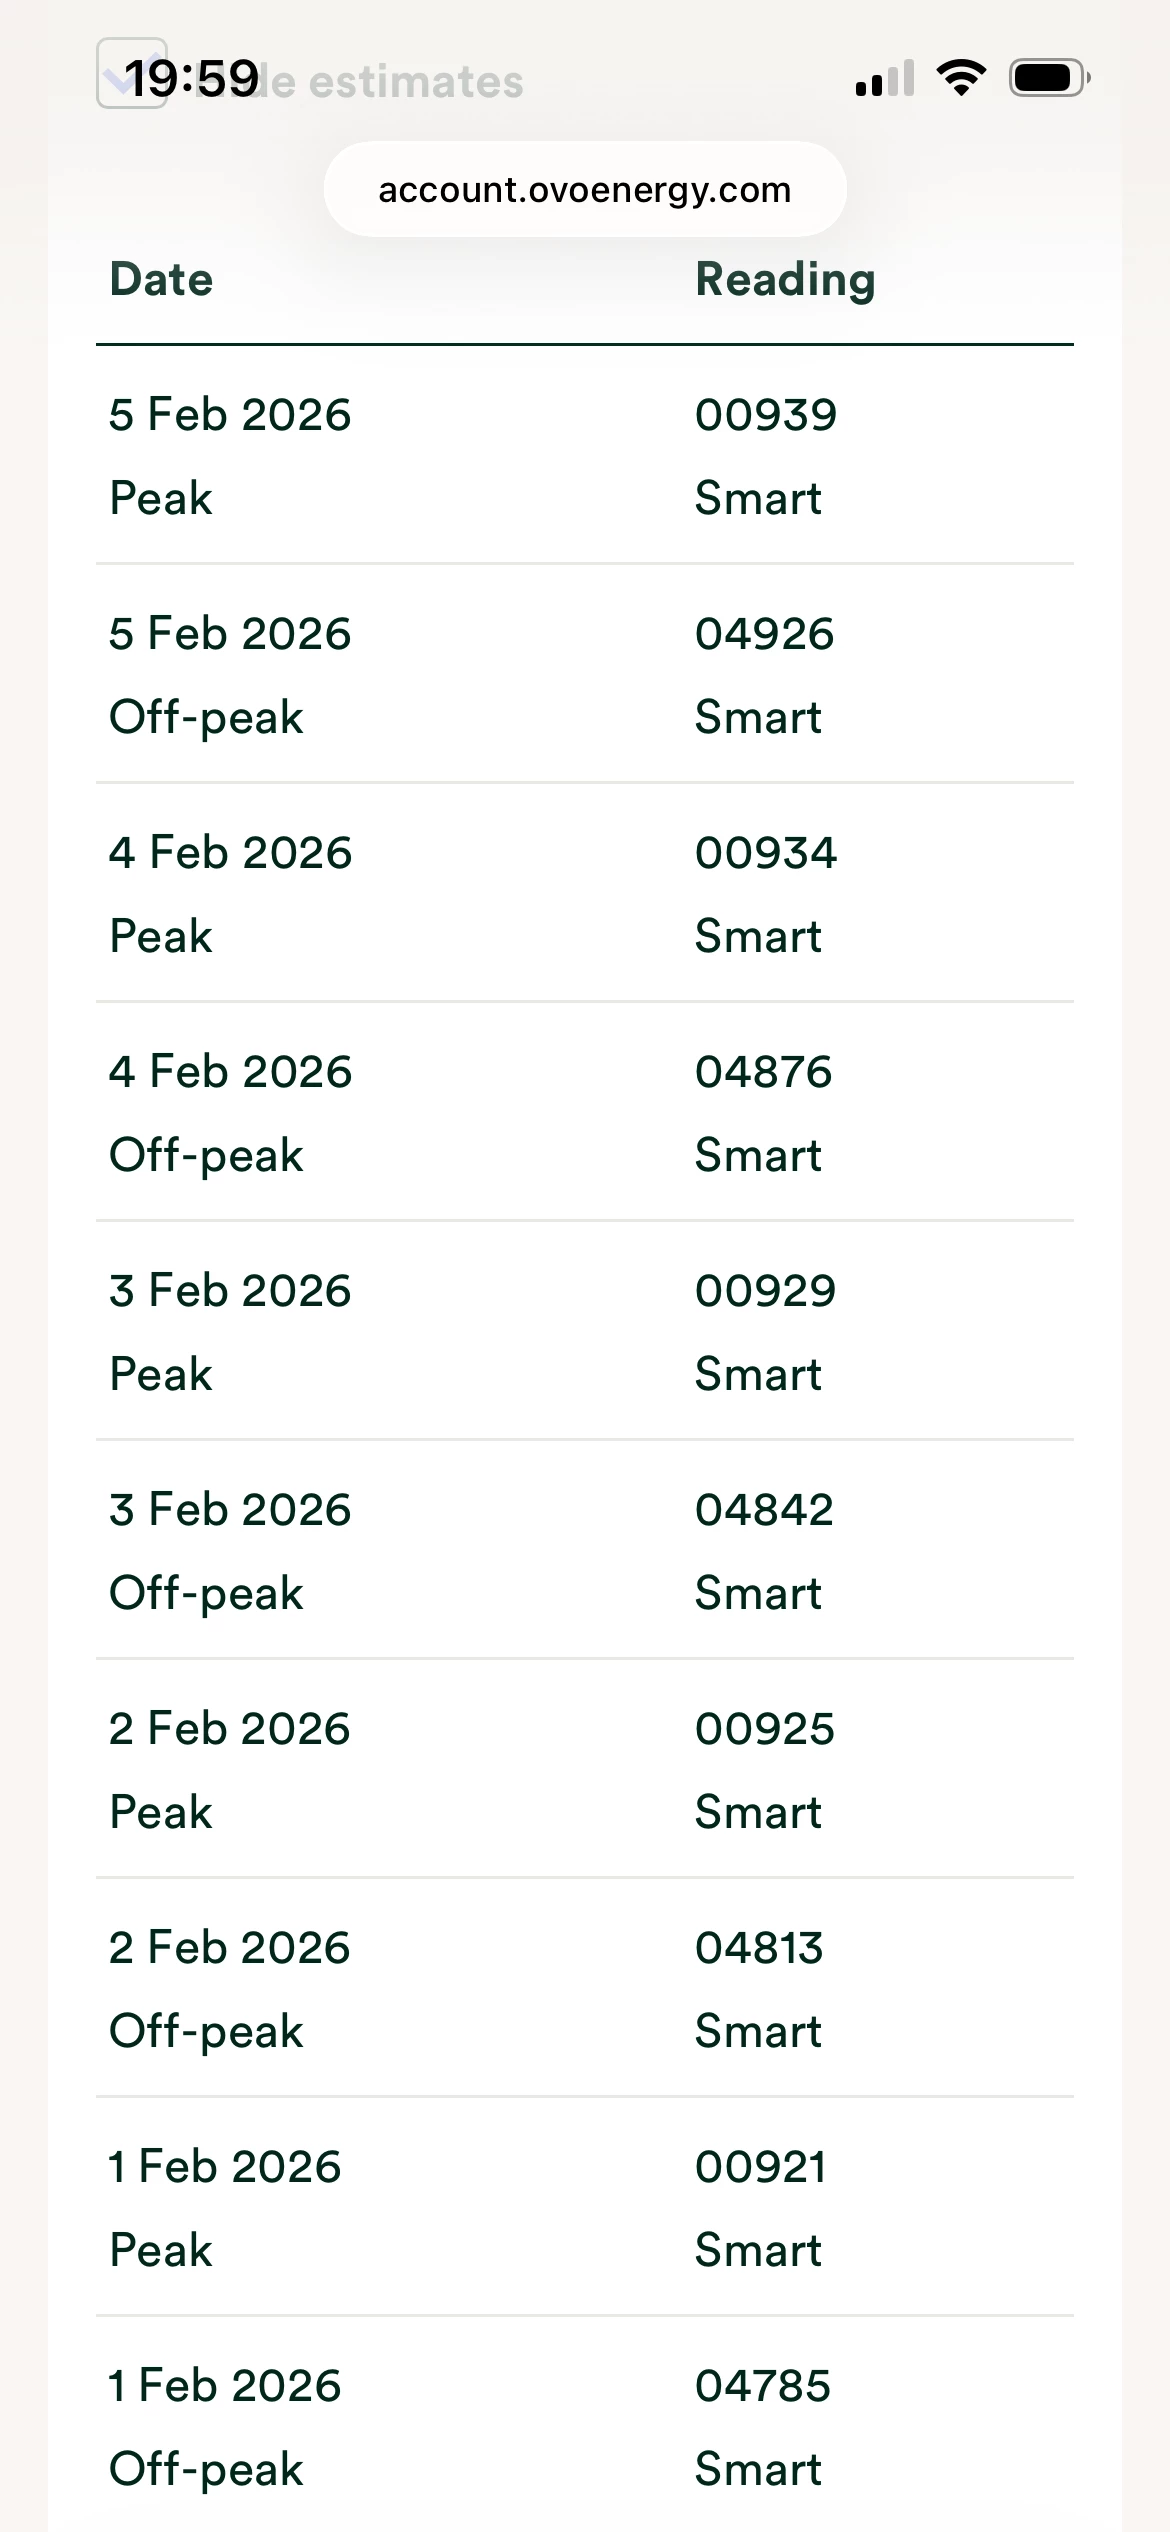
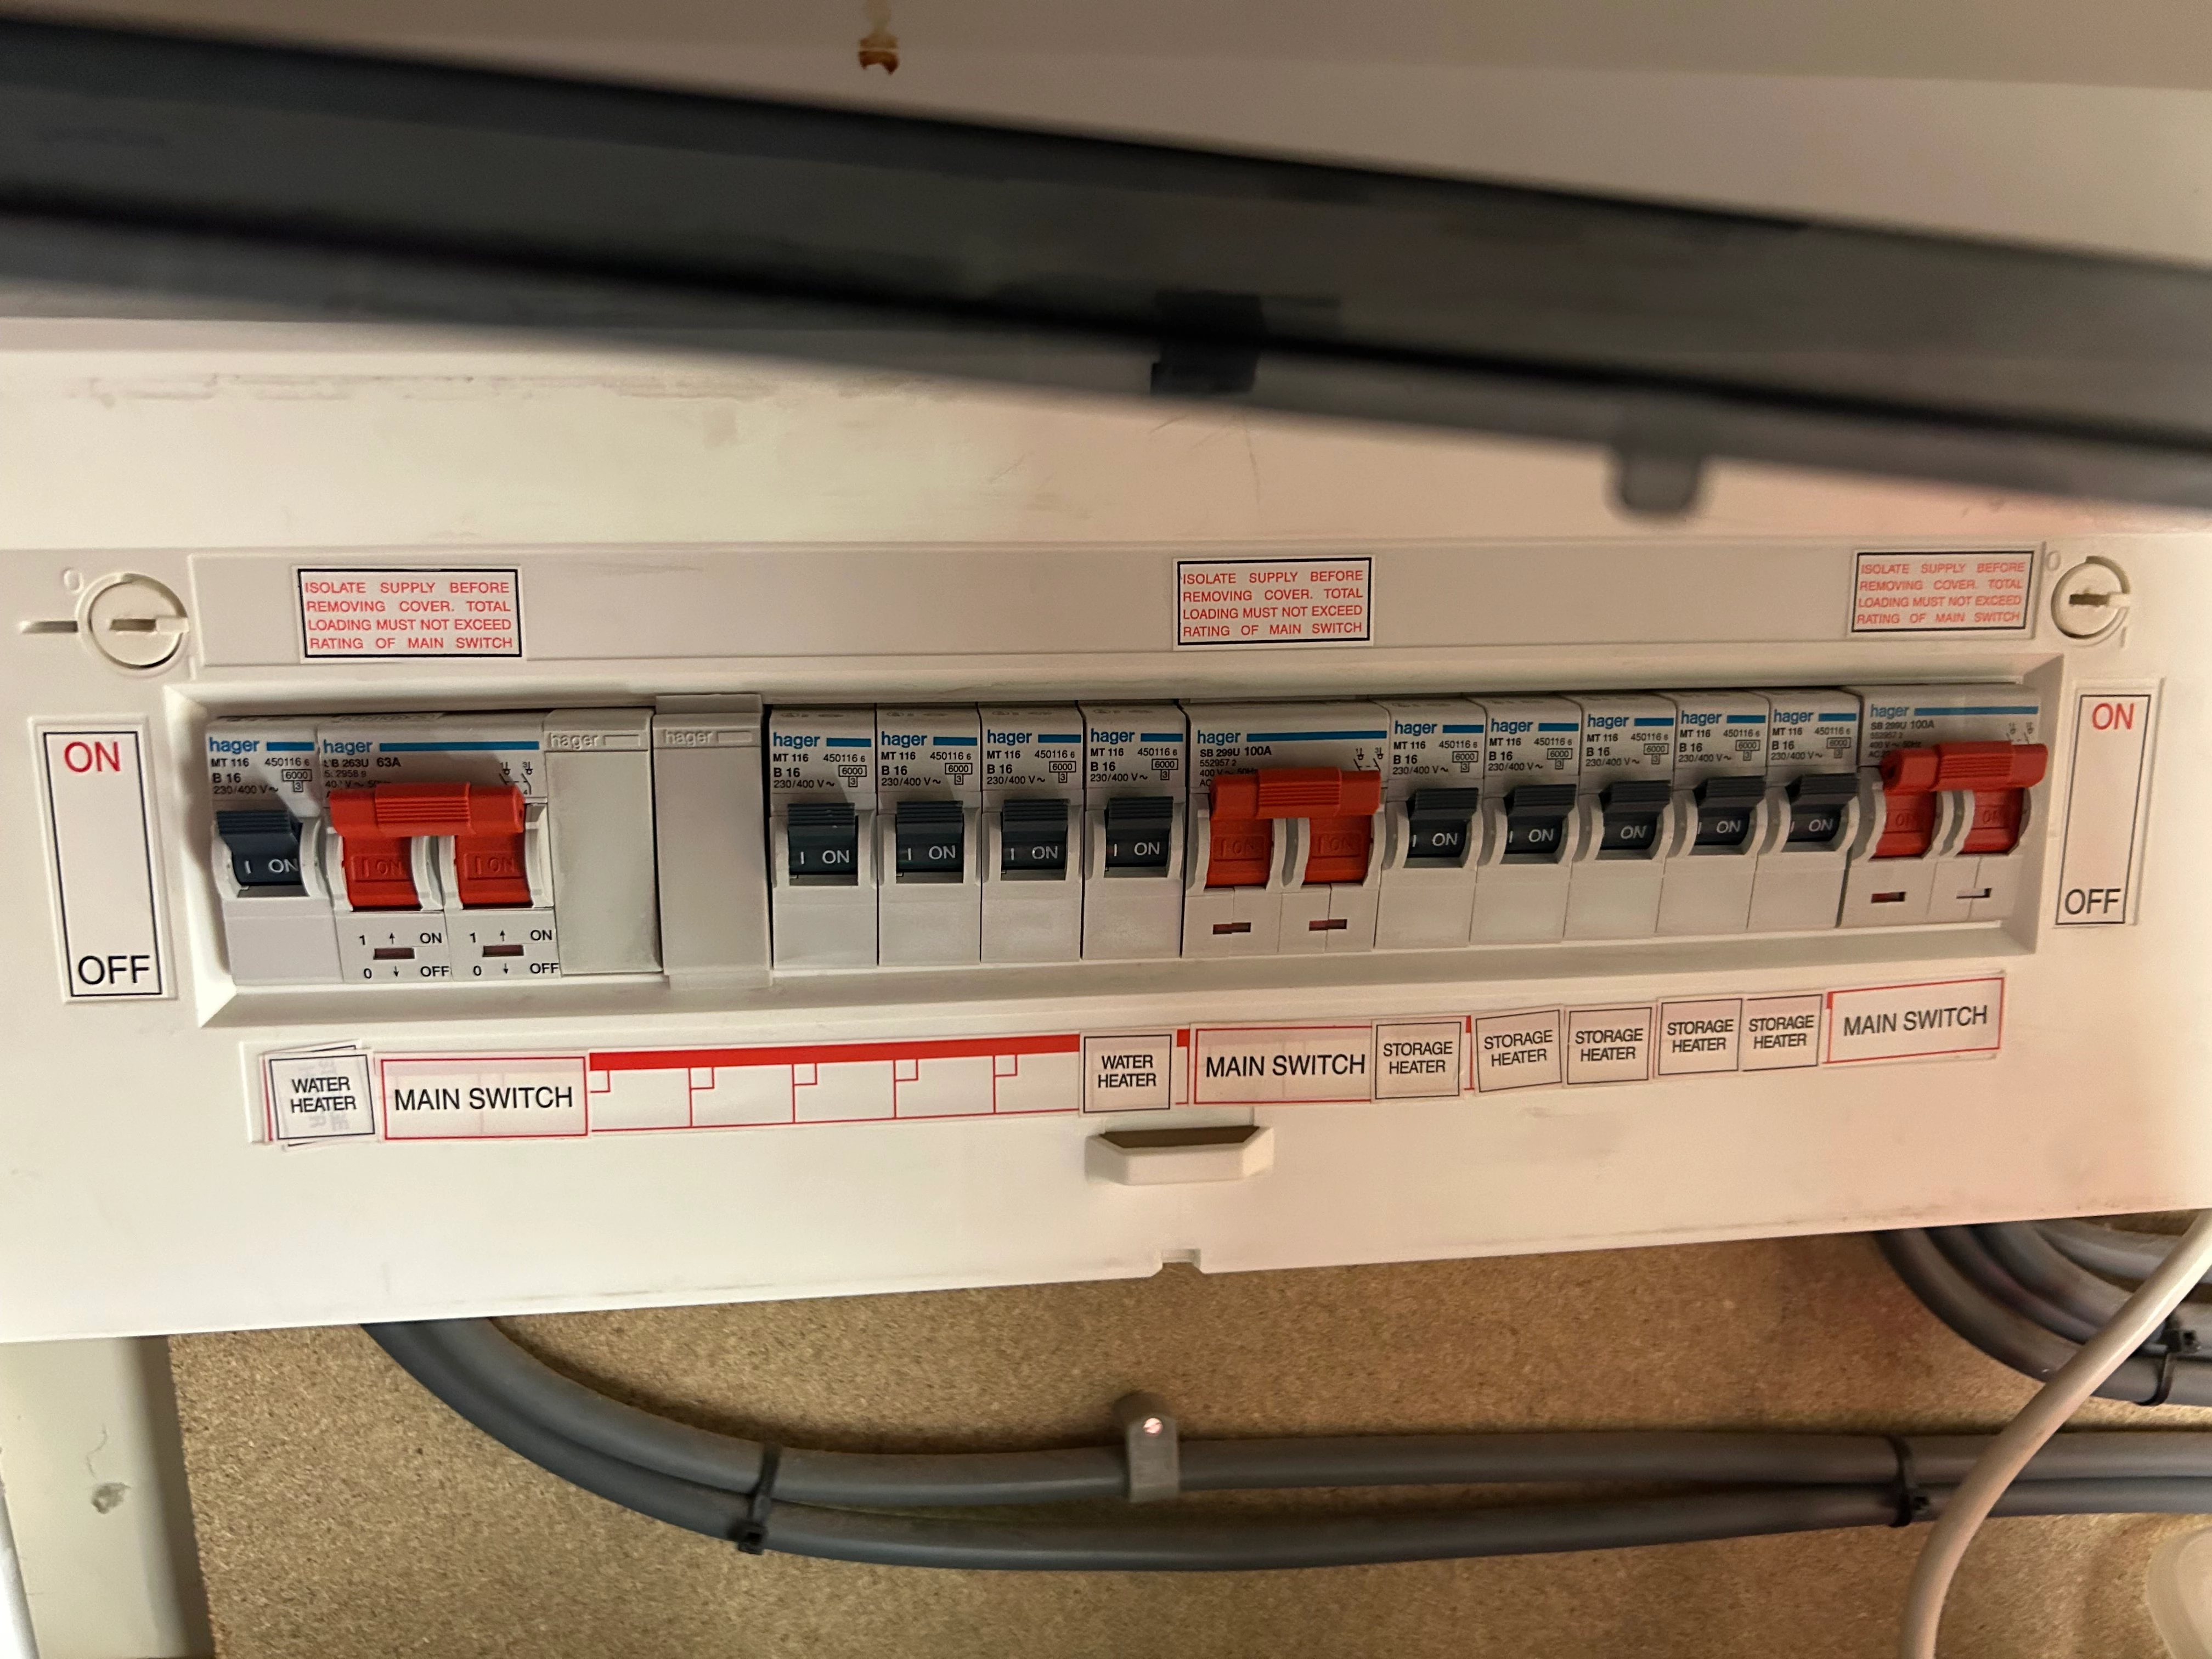
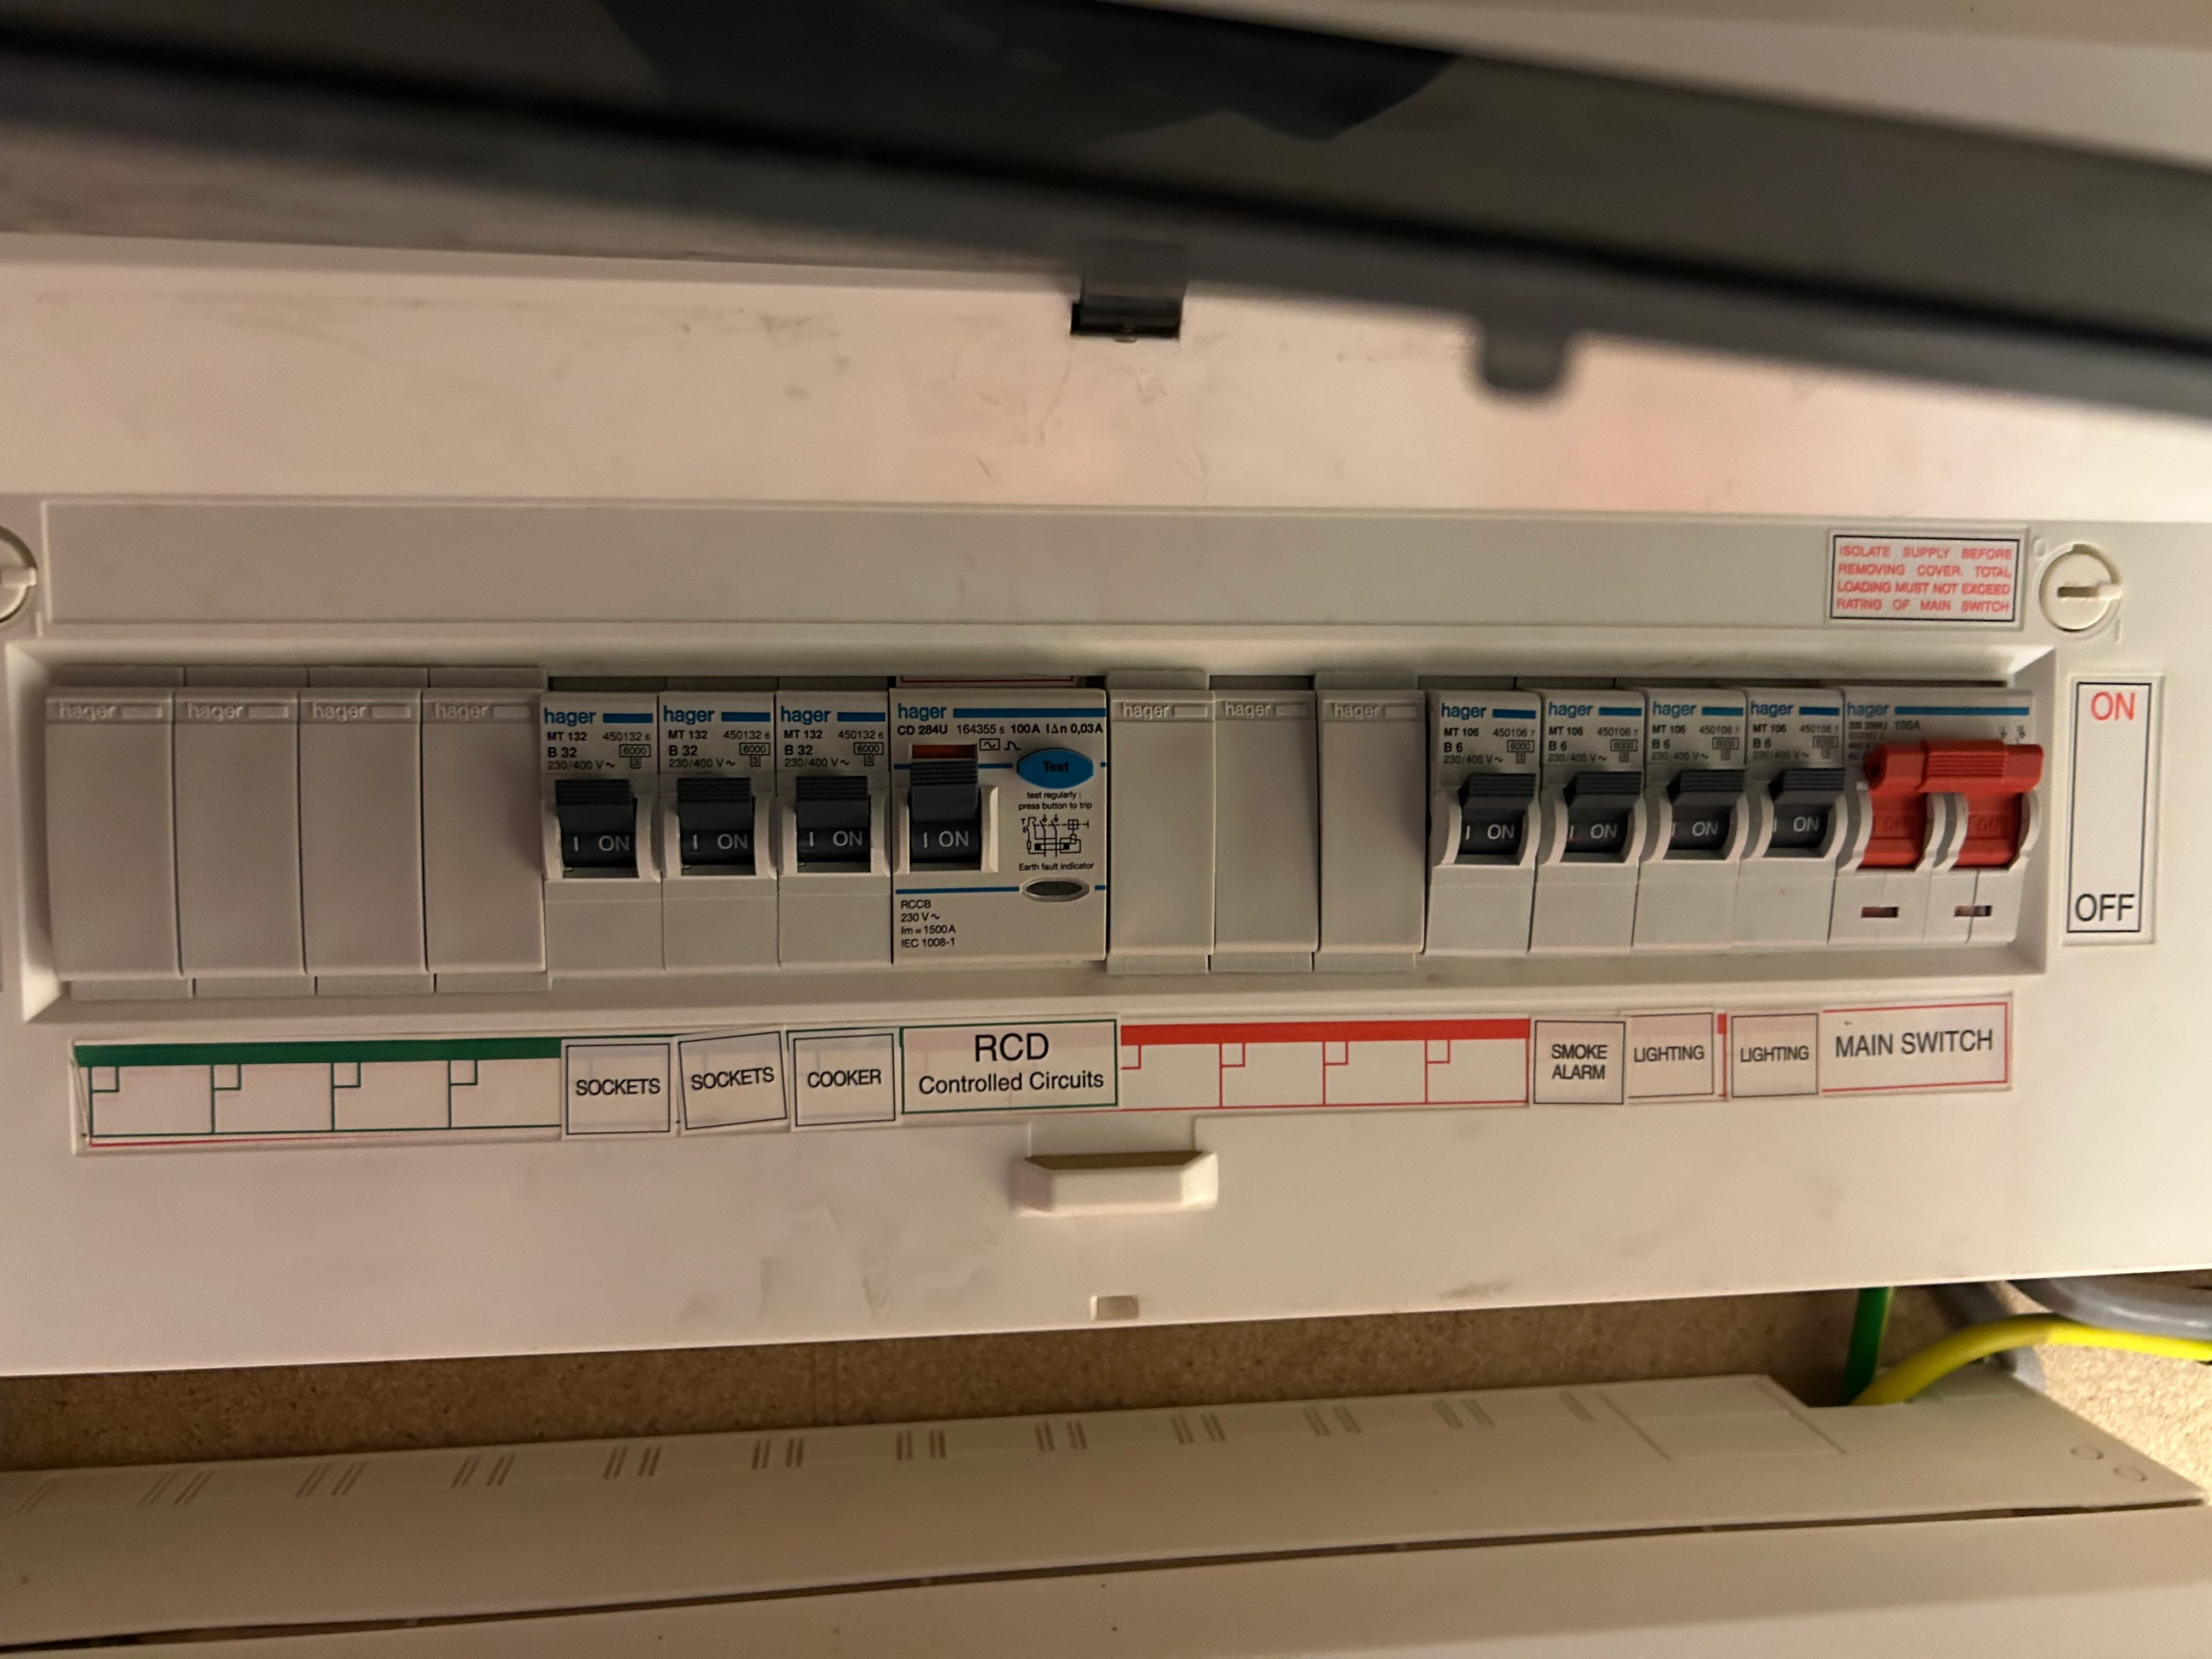
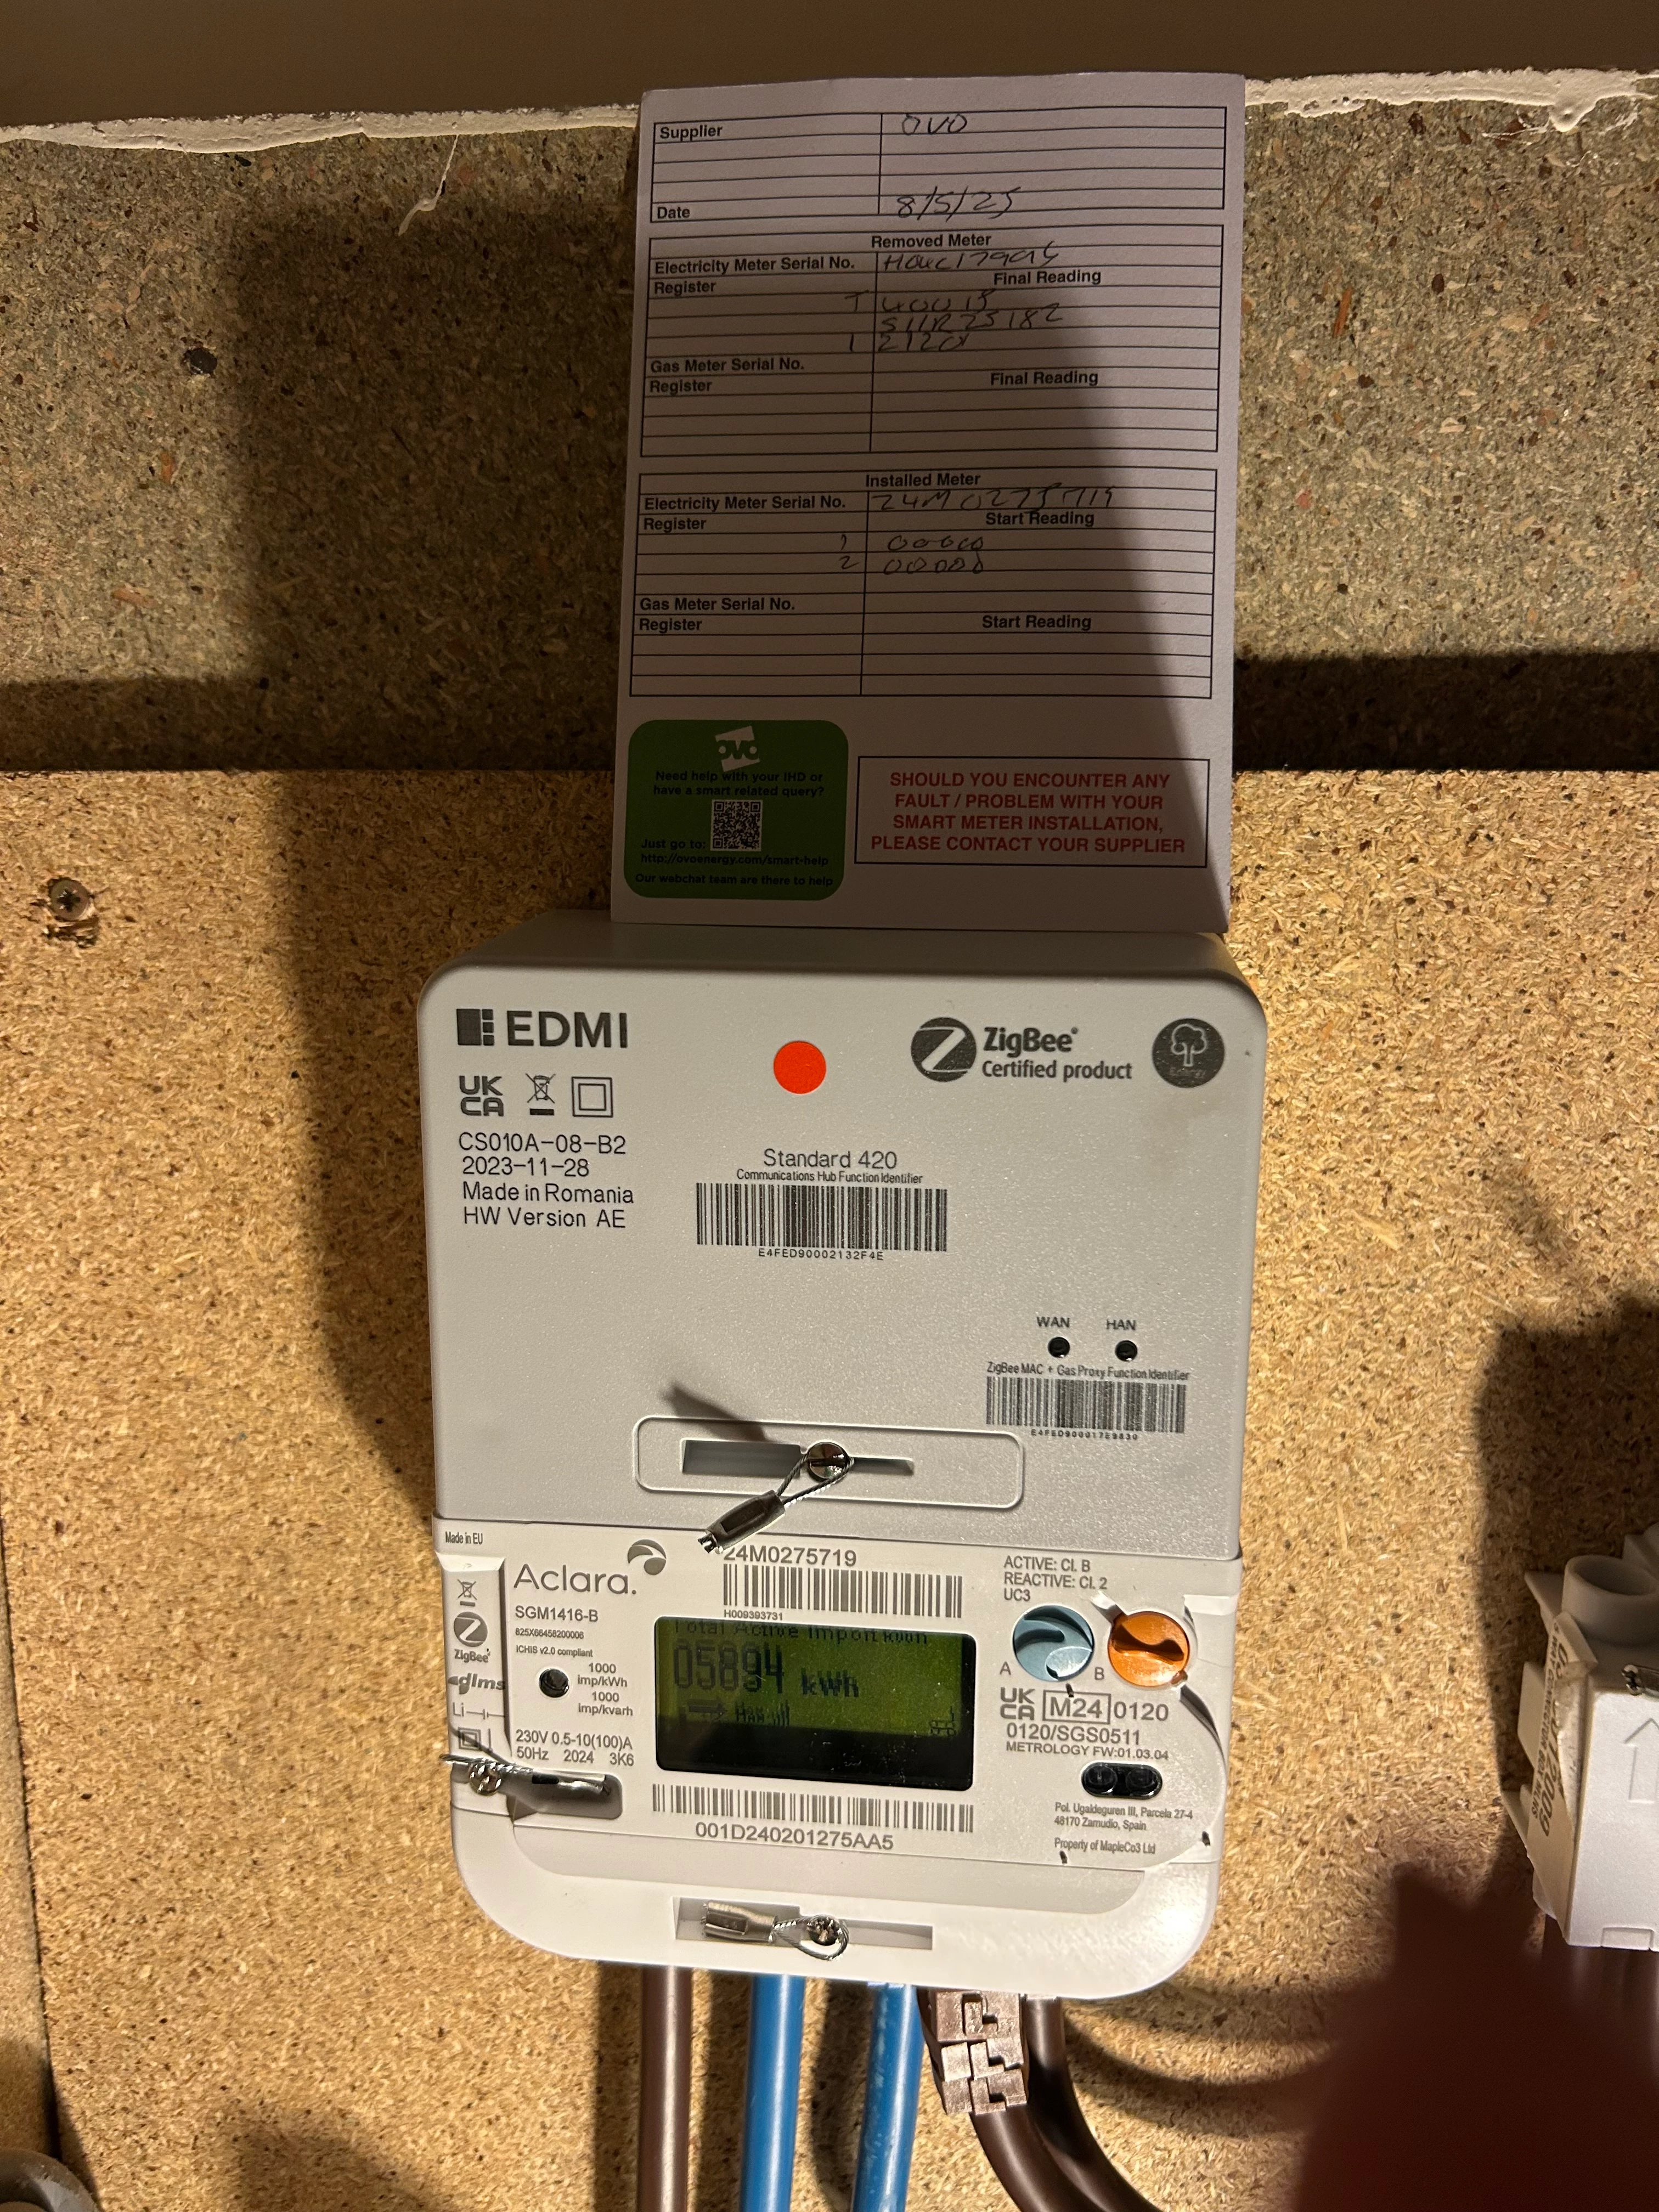
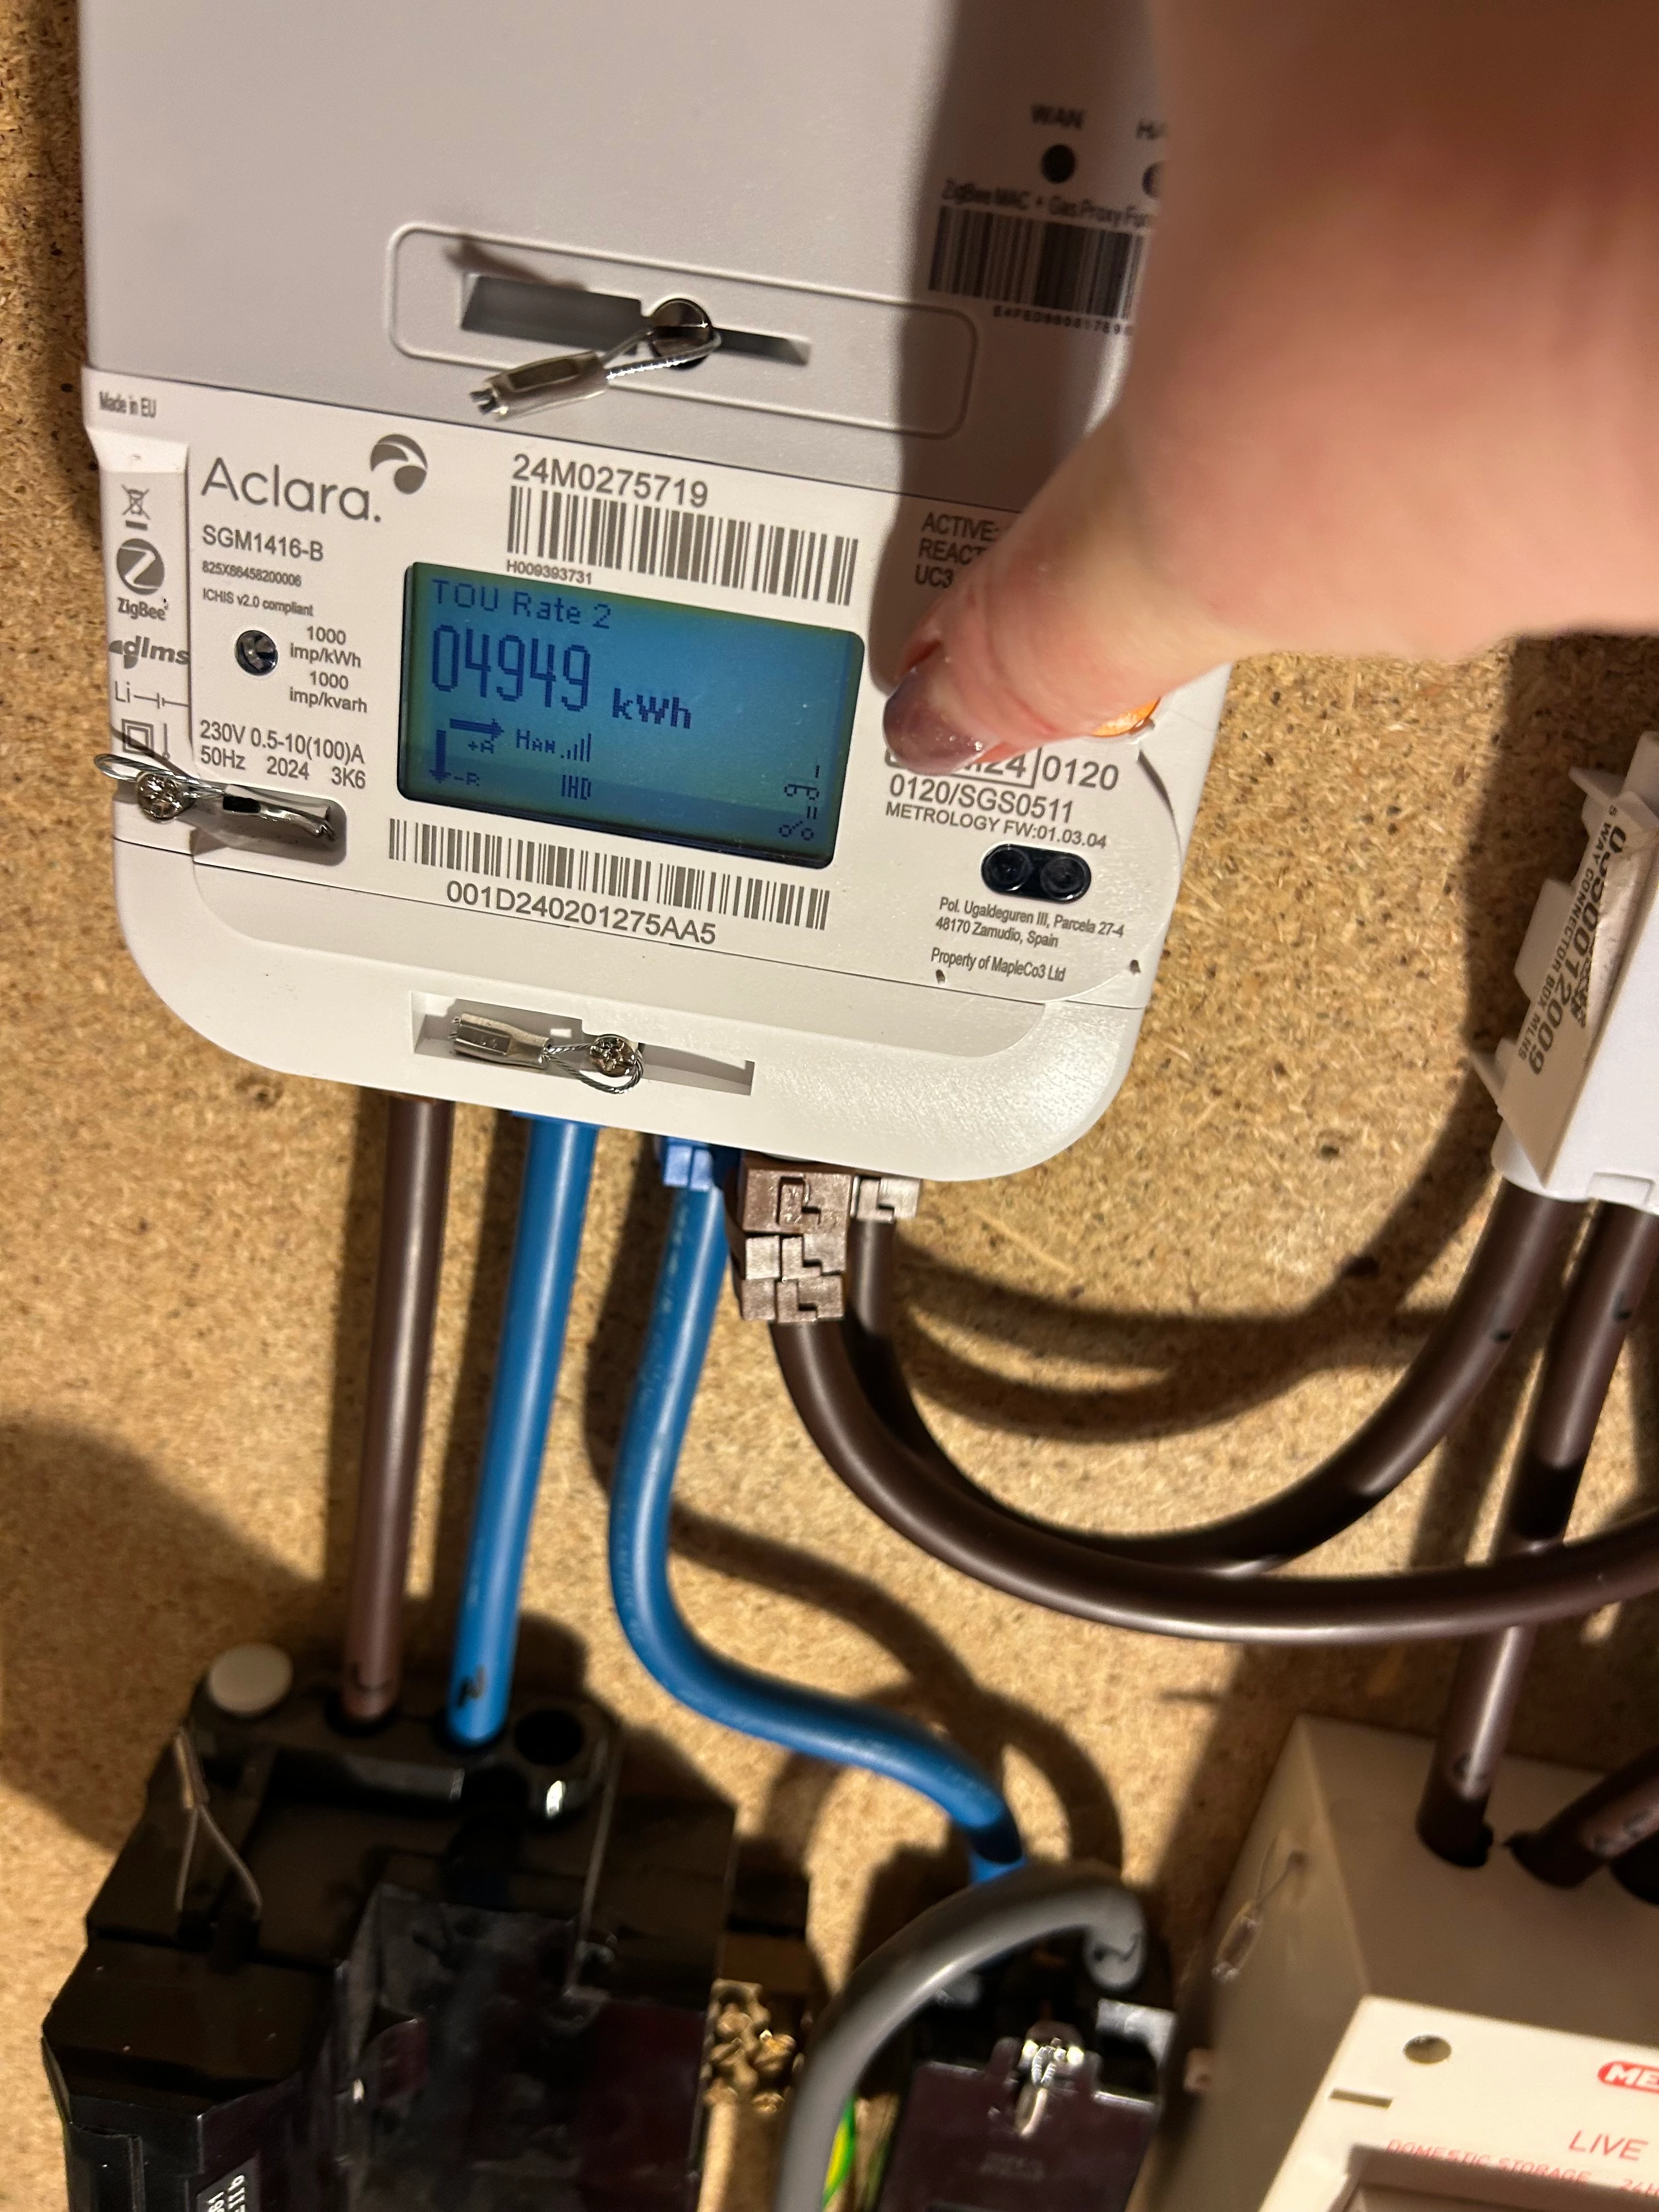
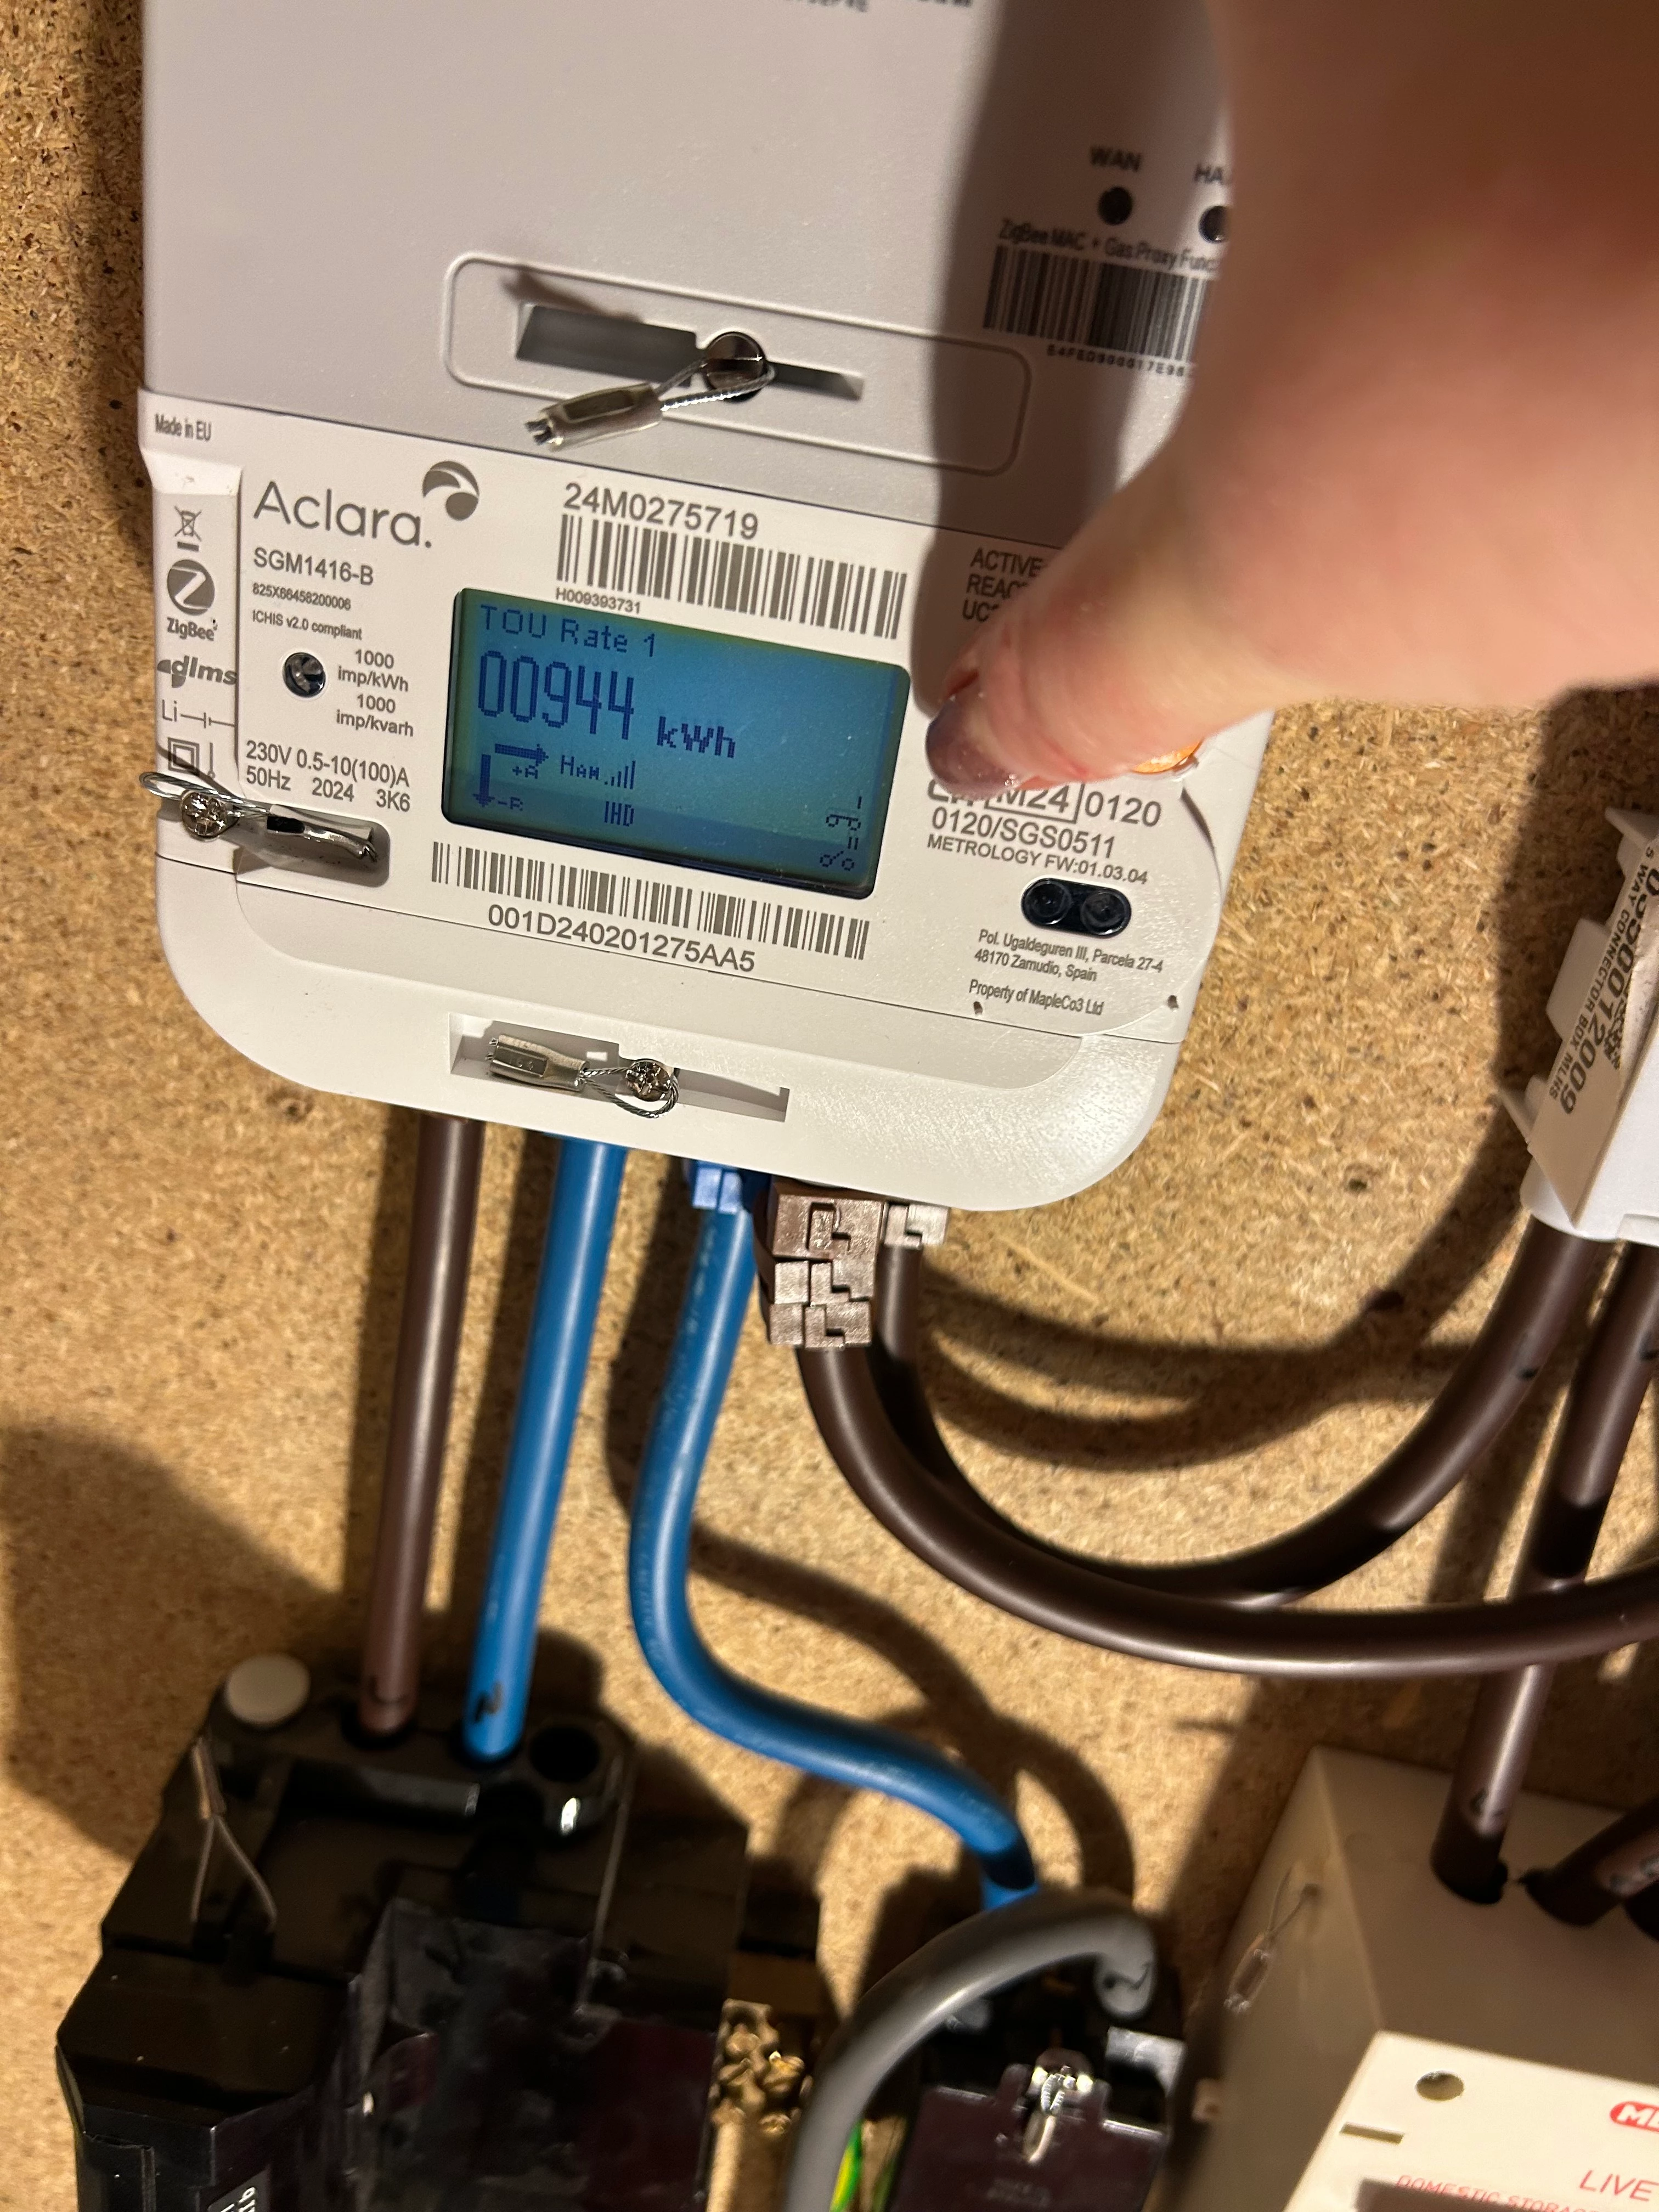
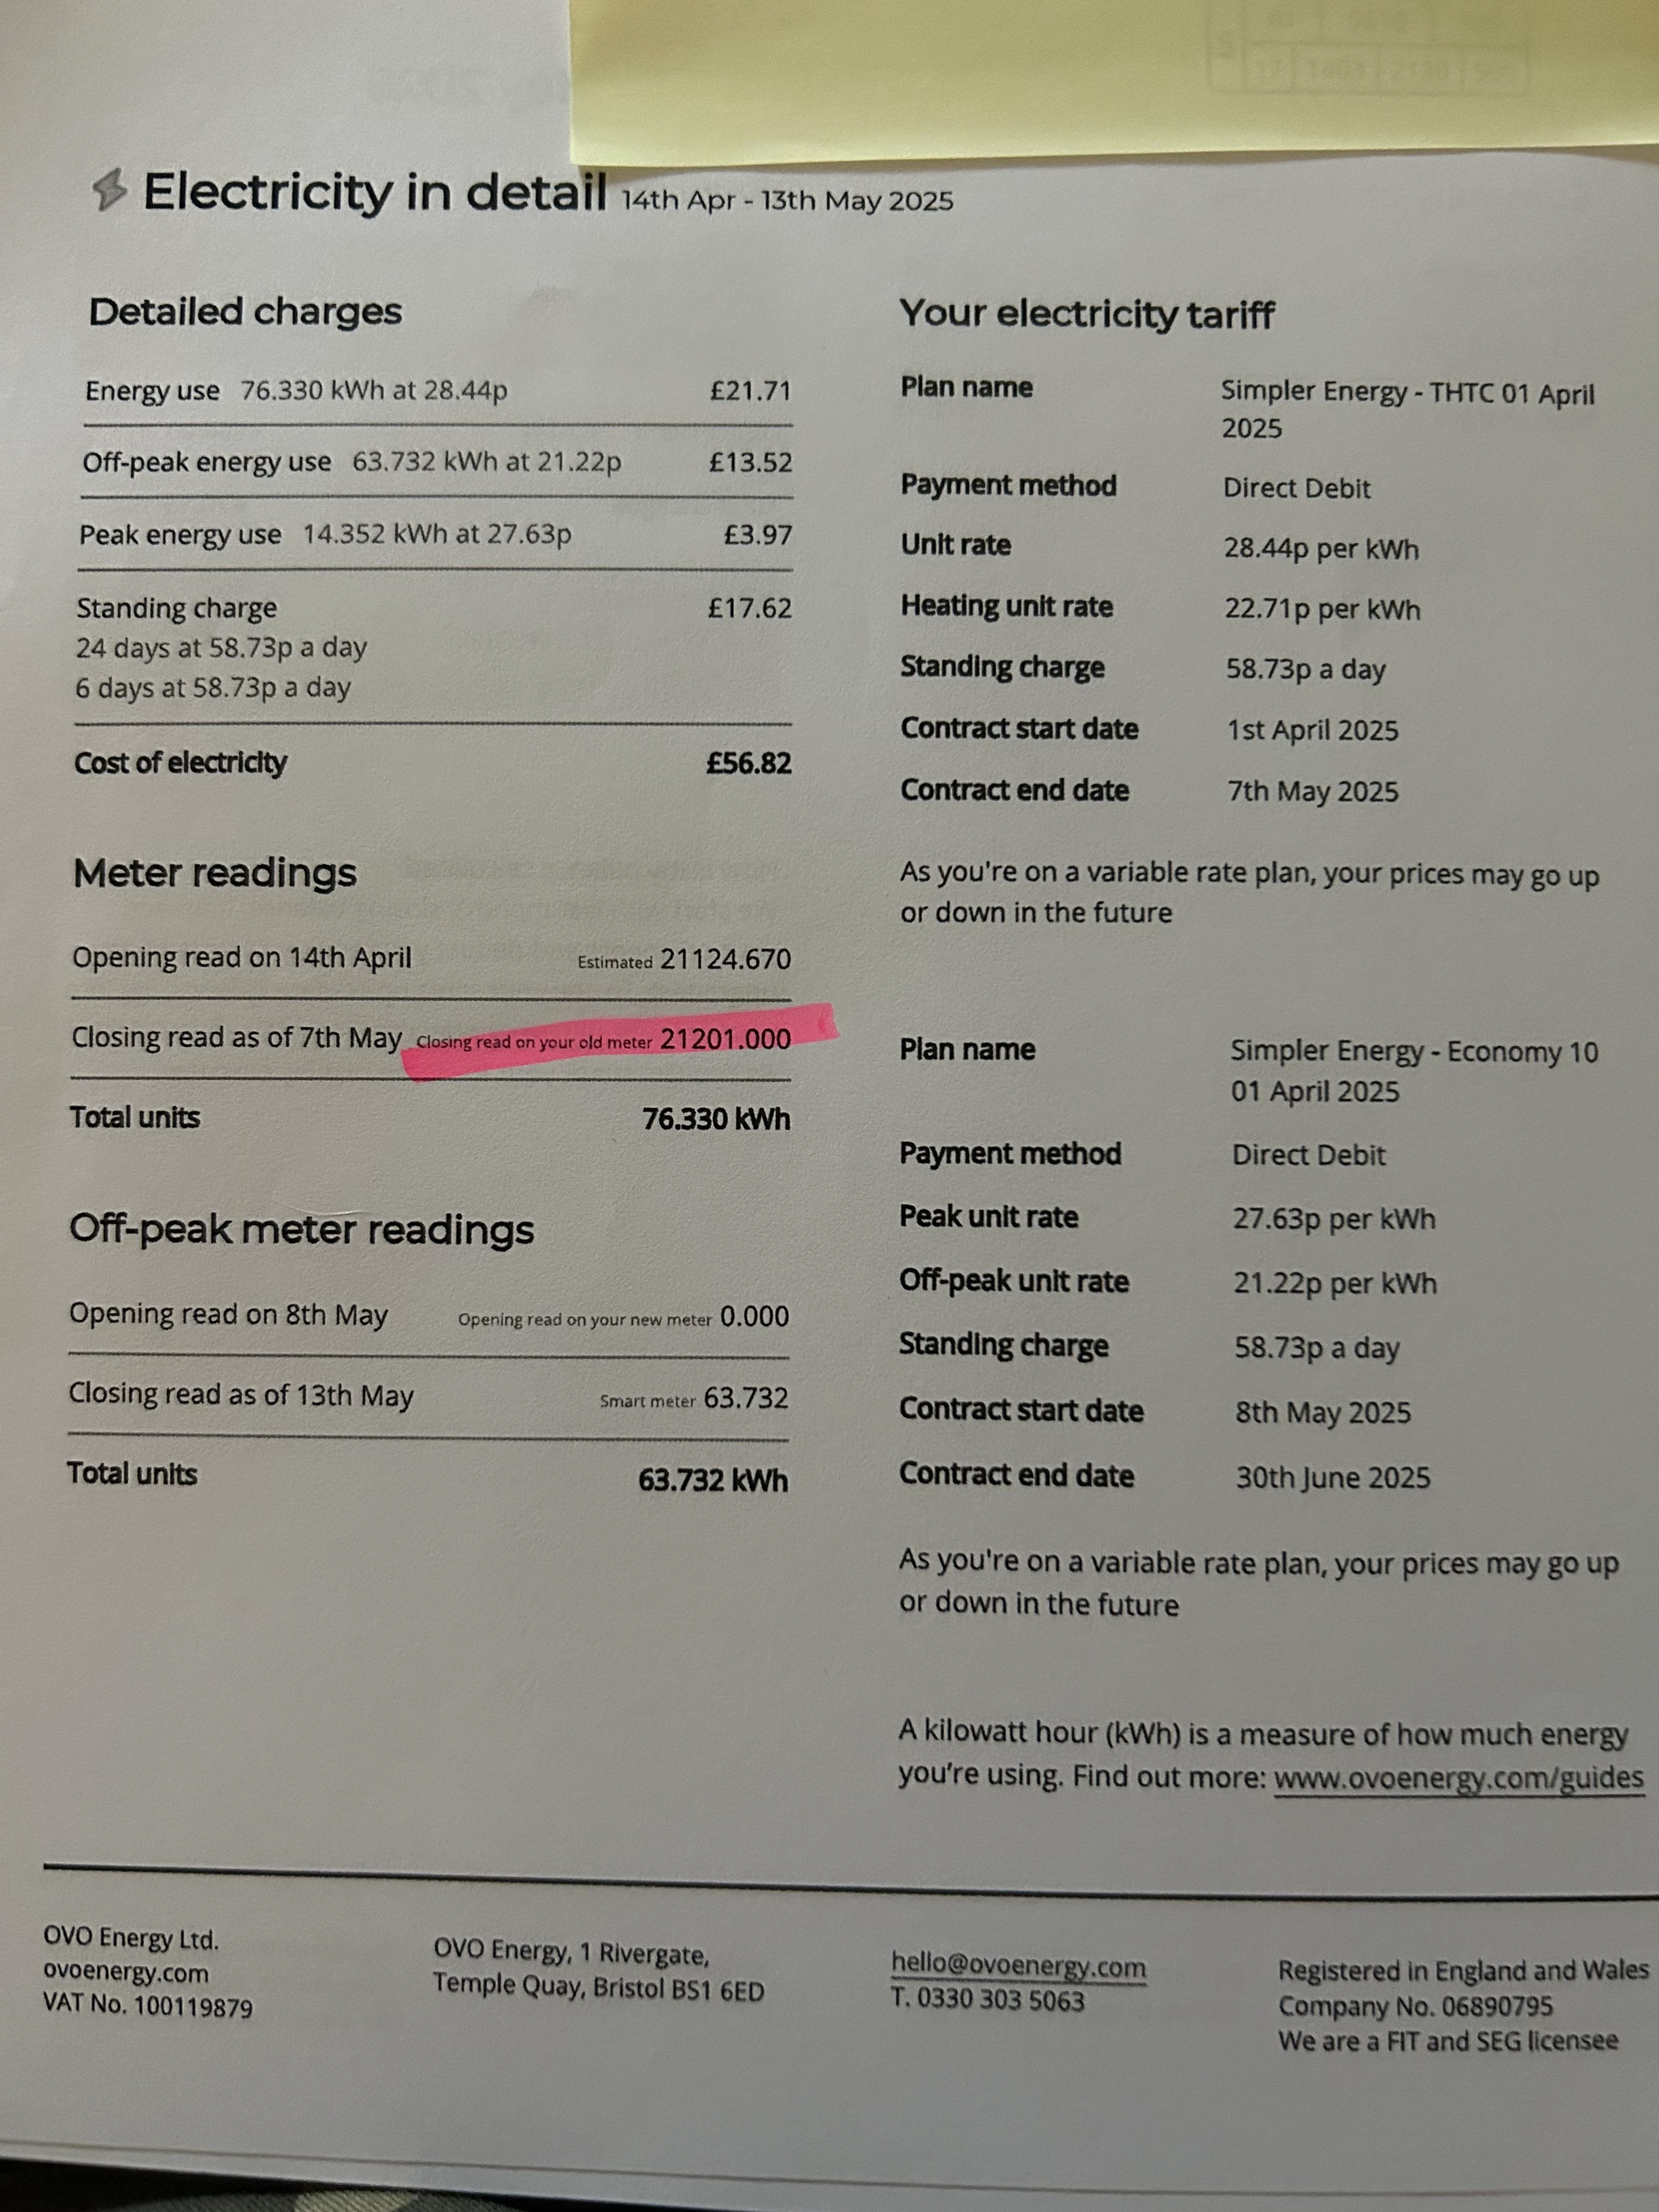
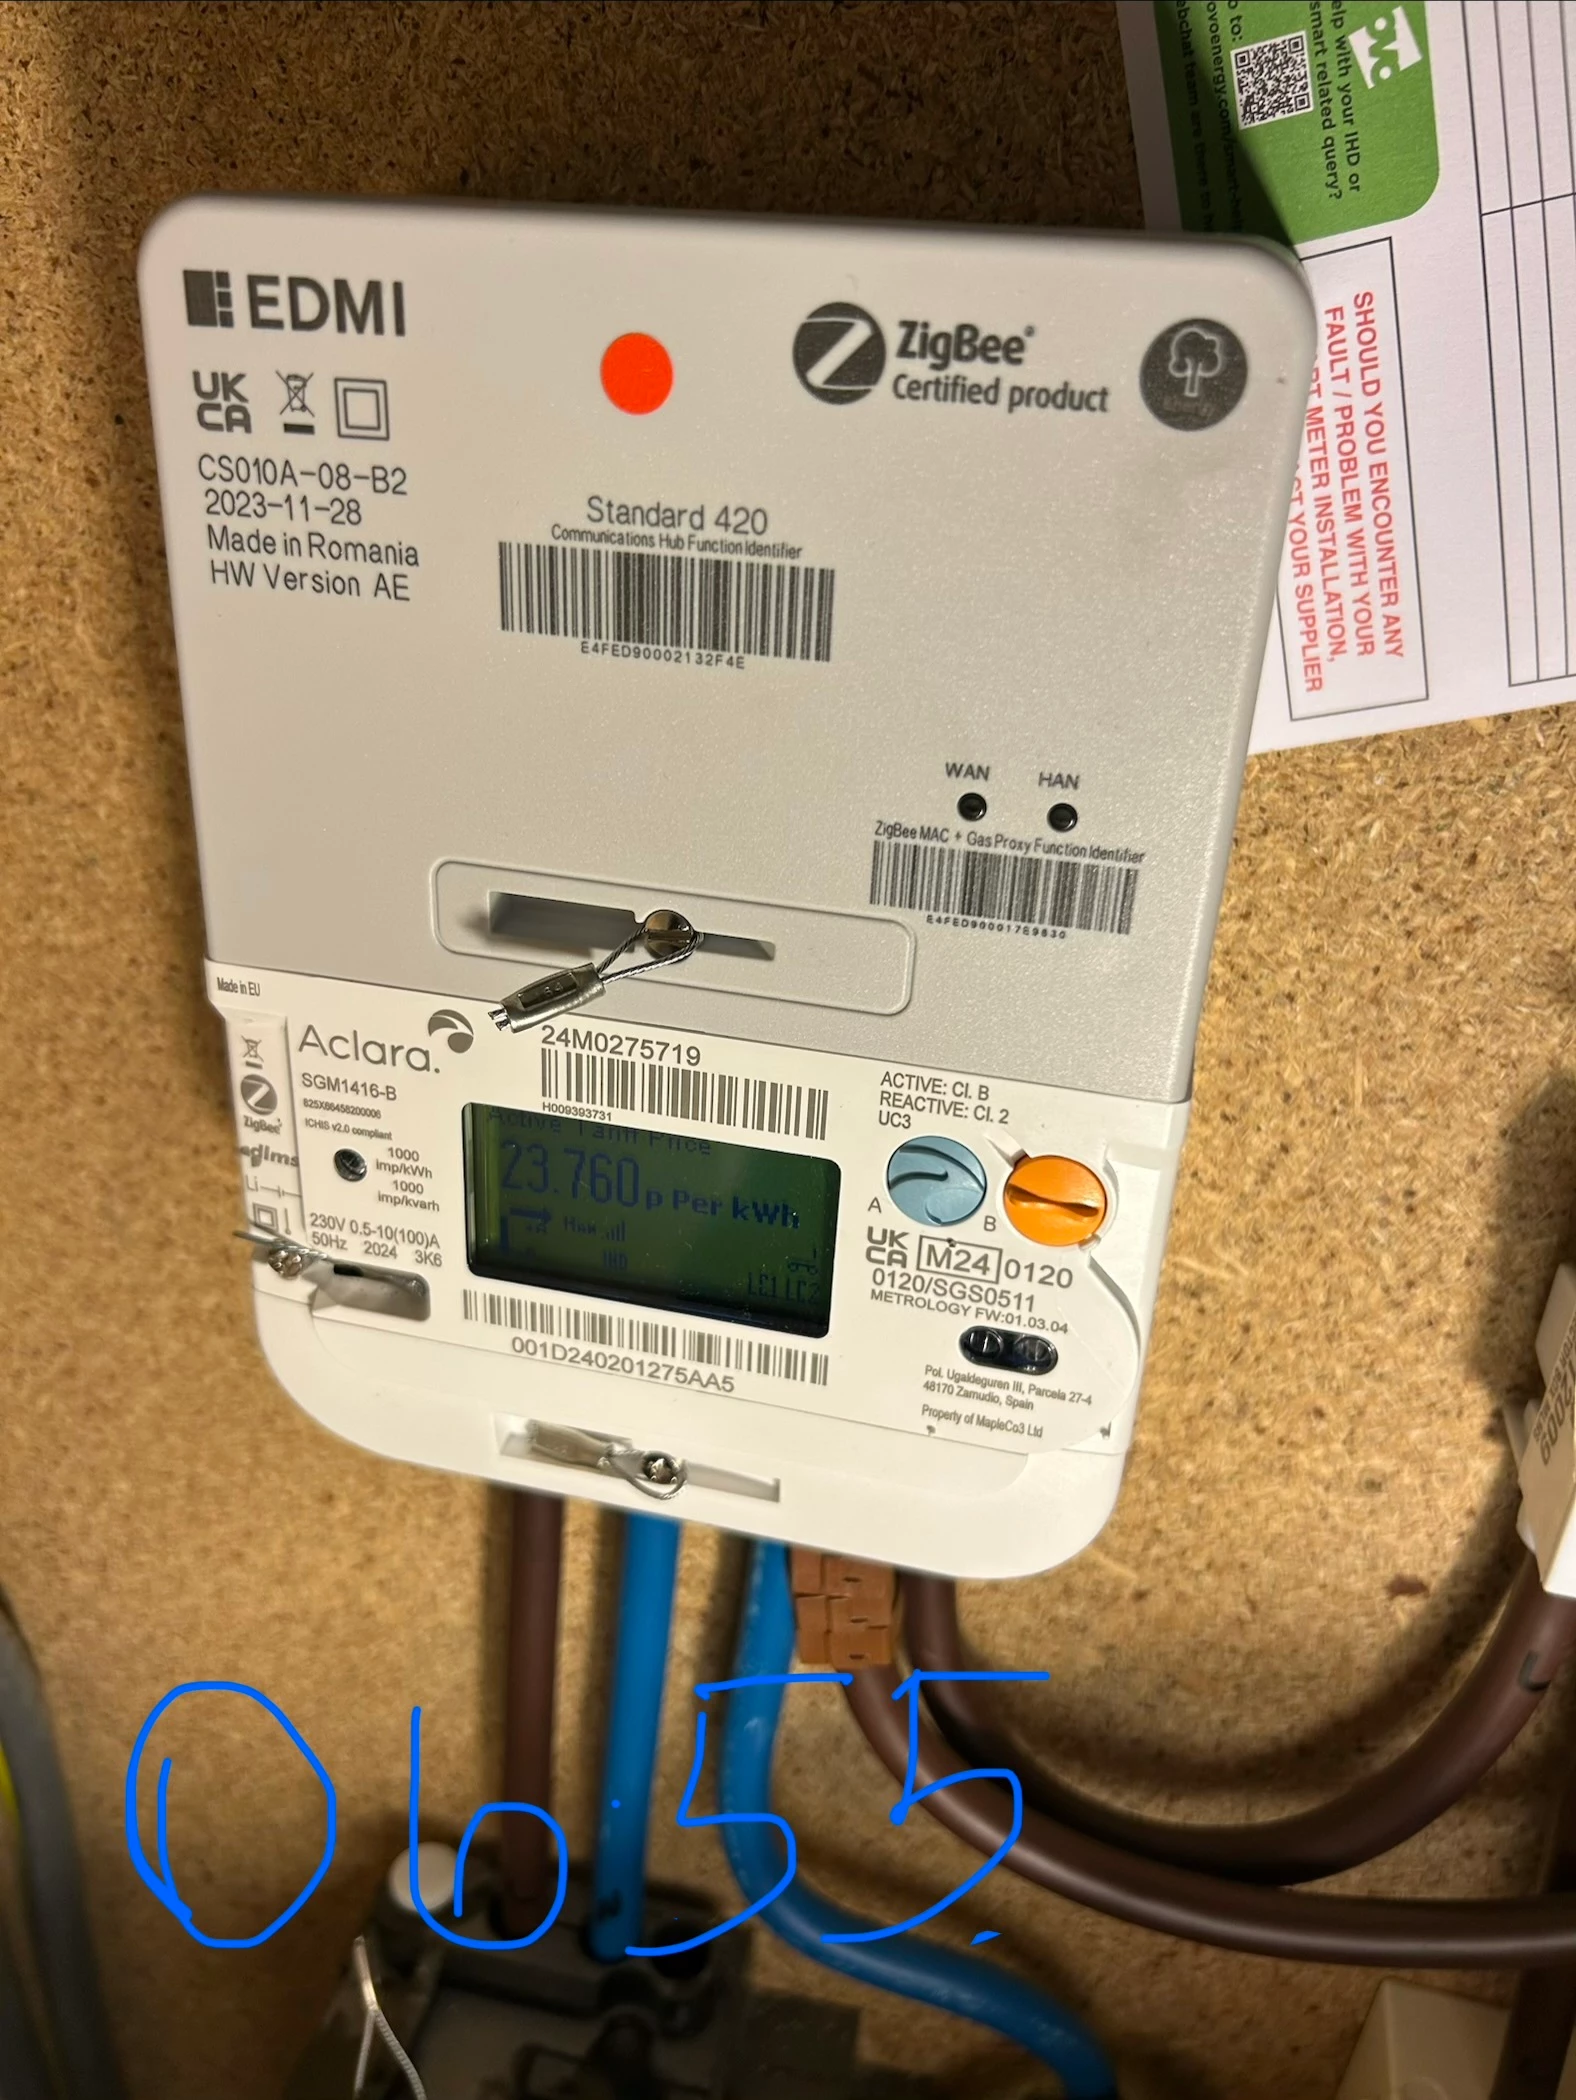
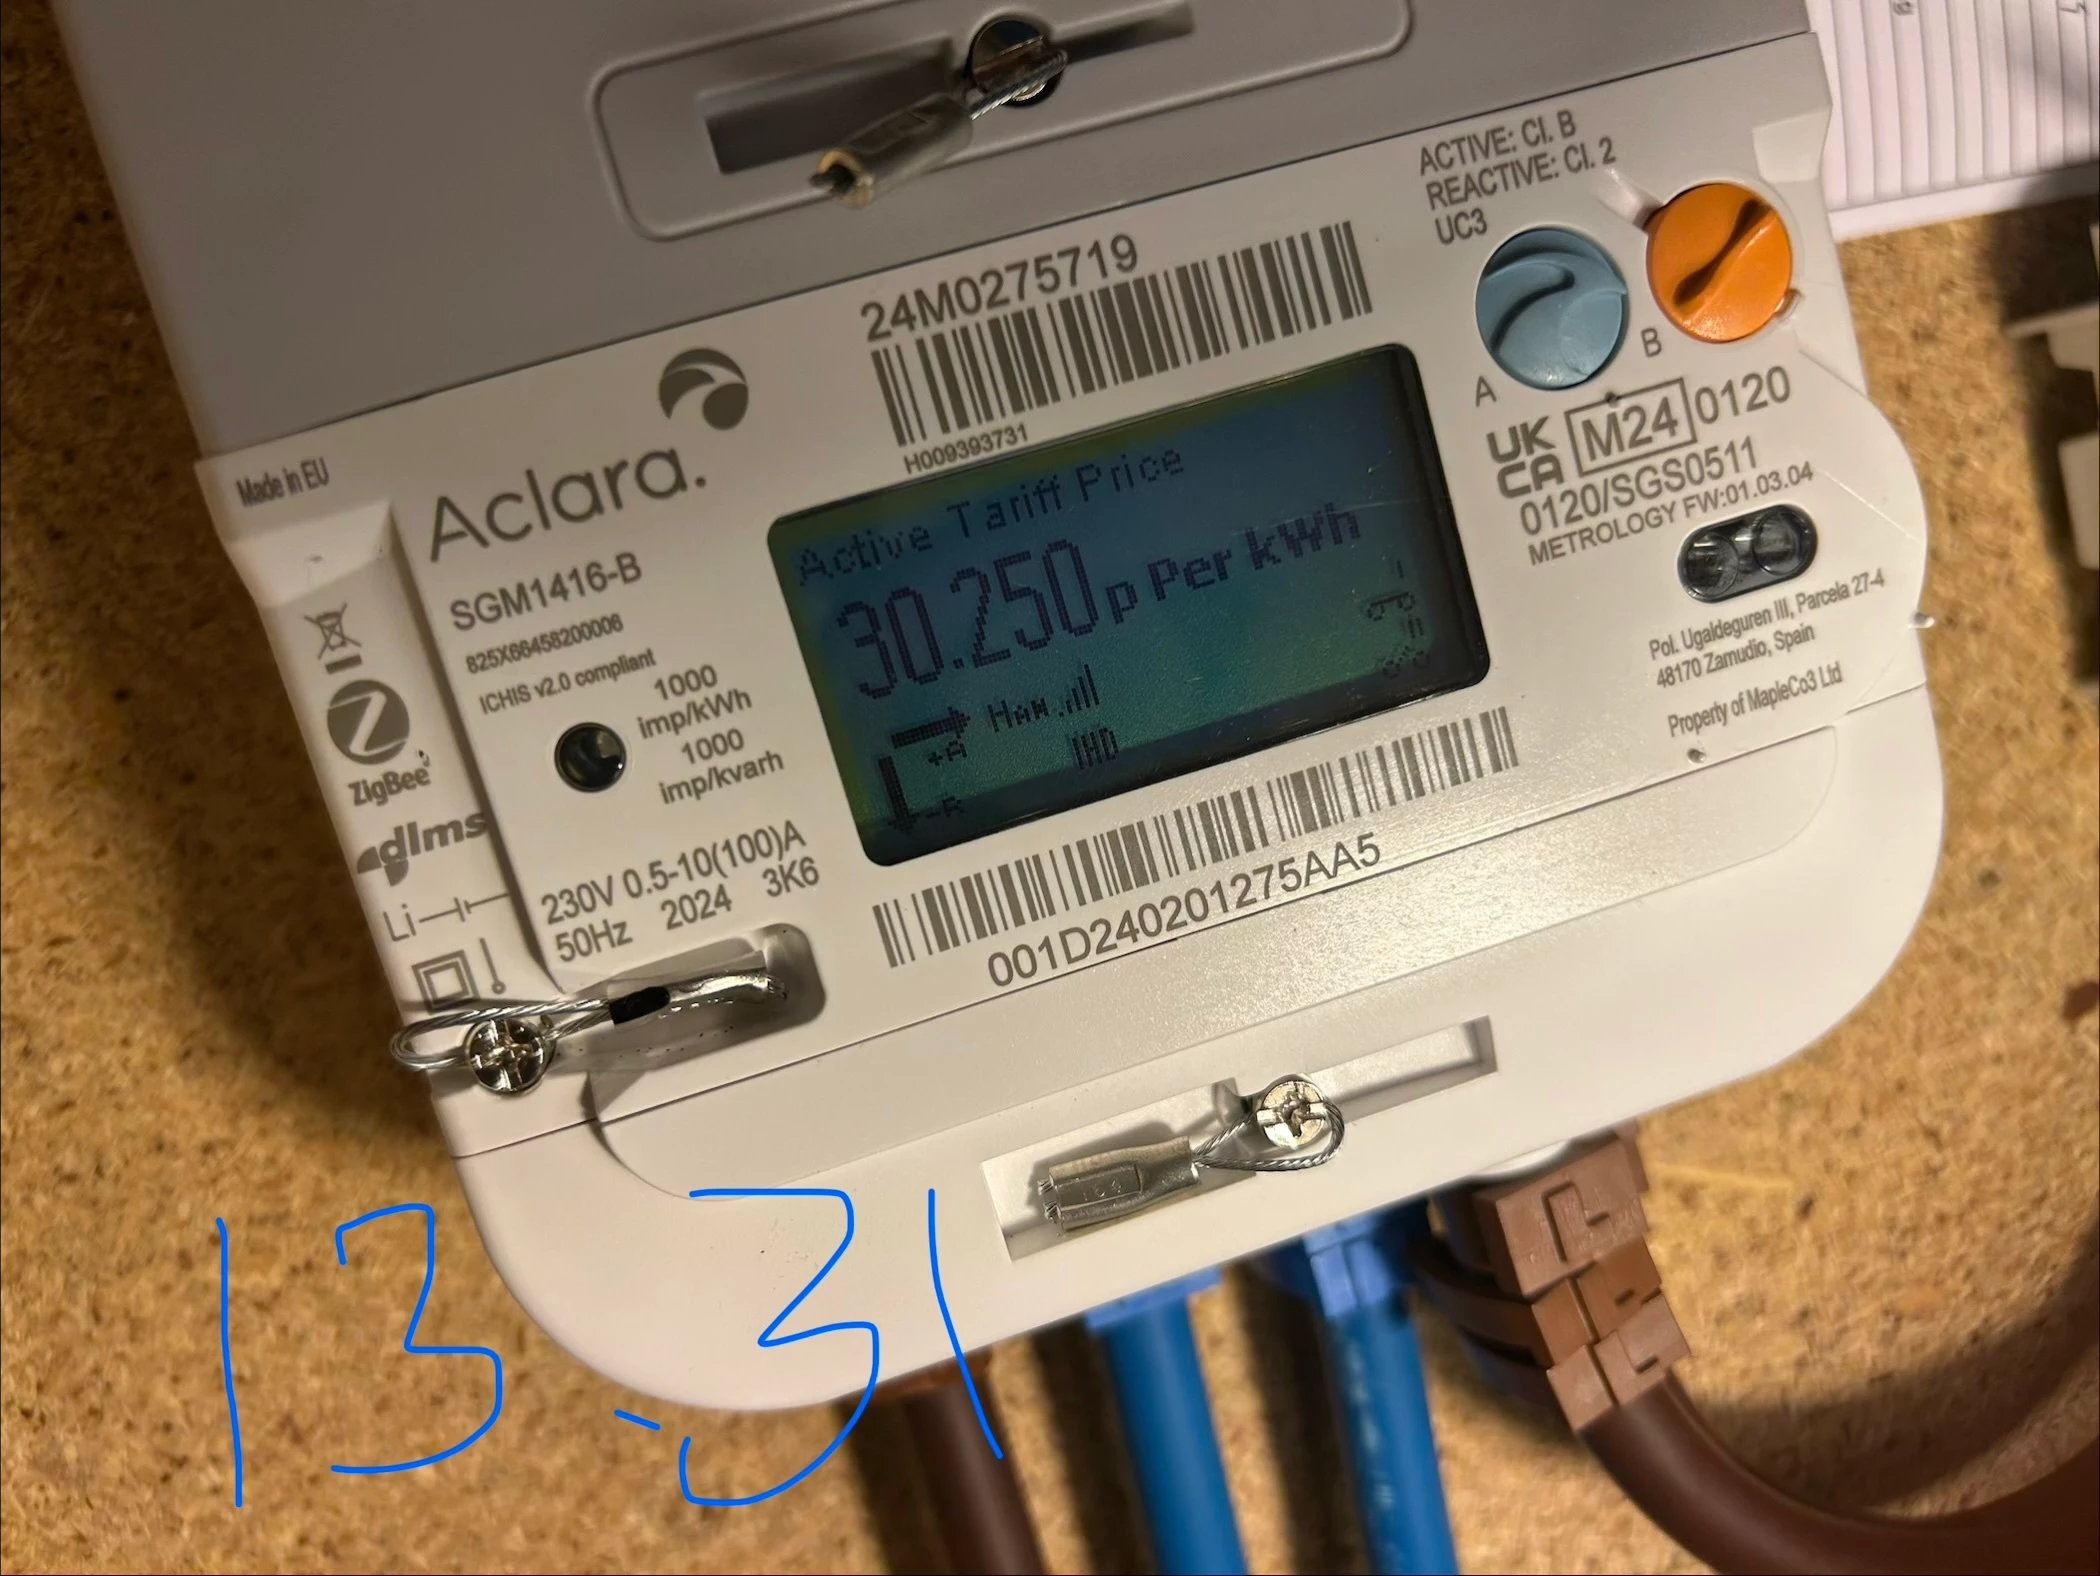
I got smart meter installed in May 25, since then usage seems too high and now in winter months Dec to Jan usage is 8 times it was the same period in previous years.!!! Something must be wrong but I’m getting nowhere when I call OVO. Silly comments like it’s a smart meter it must be right and it will go up compared to summer as heating on. No one will listen to me that this is in comparison to the same periods in prior years. My house is all electric and I have storage heating. I suspect my new “smart meter” has not been set up right for storage heating. Where can I go from here? How can I get OVO to actually look into this and check my meter configuration etc and fix whatever the problem is. I’m absolutely  disgusted with the so called customer service line and this is causing a lot of stress and worry. My dec to Jan bill is £325 compared to this period prior years only £60-£70. I hand only 3 heaters on (same every winter) 2 large storage and one small dimplex. I need help please 🙏 

15 replies

juliamc
Rank 20
Forum|alt.badge.img+8
  • Rank 20
  • February 4, 2026

Can you tell us what your usage has been for the Dec - Jan period just gone and the same period 12 months ago, but in kWh rather than £. Were your previous bills estimates or actual readings ?


Firedog
Super User
Forum|alt.badge.img+7
  • Super User
  • February 4, 2026

That sounds very disturbing. If you’re prepared to give us some details of your set-up, we can try and spot anything untoward. This is the catalogue of what we’d like to see:

  1. A screenshot of your Plan page (just the bit of it between ⚡Electricity and All prices exclude VAT ...). 
  2. A screenshot of a recent Day tab of your Usage pages so we can see when your heating equipment is running. This is what mine looks like:
      
  3. Some photos, clear enough for any markings or lettering to be legible:
    1. A close-up of the meter itself, Please touch a button before taking the picture to light up the display, and make a note of the exact time. If you could take one a few minutes before 07:00, that would be very helpful.
    2. An overview of the meter cupboard or box, or of the backboard it’s mounted on. We really need to see all the cables, ideally from the service head (often an unsightly black or grey contraption at the end of the thick cable coming from outside, with a couple of neater black, red, blue, brown or grey cables coming out of it) to the meter itself and from the meter to wherever they lead to. If any of the cables are in deep shadow, please move a bit and take another so what was in shadow becomes visible.
      If the ‘meter exchange label’ left by the meter engineer is still there, perhaps fixed to the backboard or a nearby wall, please make sure it’s also in a photo. 
    3. Close-ups of any other control equipment, e.g. for an immersion heater for hot water.
    4. Close-ups of the Consumer Unit(s) (‘fuse boxes’) with the lid propped open so any labels left by the electrician are clearly visible.   

That should do for now 🙂 If it’s all a bit daunting, do you perhaps have a friendly teenager handy who could help? (Good luck with the ‘before 07:00’ bit, in that case!).

Do you have a functioning In-Home Display (IHD) that replicates some of what the meter is doing from time to time? That may be useful for finding out precisely when your storage heaters are charging up, among many other things.


  • Author
  • Rank 2
  • February 5, 2026

Hi I have a spreadsheet (attached) which i have just updated for the past couple months.  Apparently I’ve used 5682.39 units from 08/05/25 to 31/01/26 (smart meter in 08/05) compared to 4956.70 units used from 04/03/22 to 07/05/25!!! so 725.69 units more in less than a year versus over 3 years before smart meter.

Its true i did not do actual readings every month but the spreadsheet is all actual readings over the past 3 years and if it was so far out there would have been a huge catch up in eg March & May 2025 on the actual reads before the smart meter went in.

I attach s/sheet & usage plan for yesterday as requested and will upload photos of meter tonight as requested.  Thankyou so much for looking at this for me 😊


Firedog
Super User
Forum|alt.badge.img+7
  • Super User
  • February 5, 2026

I attach s/sheet & usage plan for yesterday as requested and will upload photos of meter tonight as requested.  
 

Thank you. Every little helps !

Storage heating only makes sense if you can charge them up at a lower rate and discharge them when you need the heat but the price is higher. Your usage chart shows what looks like three periods when heavy loads - presumably the storage heaters - are active. The active timings appear to be 04:30-07:30, 13:30-16:30 and 20:30-23:30, which could be an Economy 10 arrangement in the north of Scotland (i.e. north of a line from sort of Dumbarton to Dundee). I forgot to include in the litany of requests for information one of the most important ones: where are you? The first part of the postcode is usually enough. Your Plan page will with any luck tell us what the offpeak timings should be.

Now to the guessing game. Your spreadsheet tables show two sets of readings for the old meter, but only one for the smart meter. With a Time of Use (ToU) tariff like Economy 10, the meter should be recording on two separate registers, one for peak and the other for offpeak usage. The switch from one register to the other happens automatically, and it should coincide with power being switched on to the heating equipment. Sadly, it sometimes doesn’t.

If the figures highlighted in orange are supposed to be meter readings, there’s something very wrong. Readings must increase with time; if they don’t, could it be that you have some power generation going on (e.g. solar PV panels on the roof, or perhaps a hydroelectric station in the back garden)? I see June 367, July 324 and August 311, and I have to assume, then, that these are consumption figures, perhaps taken from the Usage charts in your online account. These don’t differentiate between peak and offpeak usage.

Have a look at your meter readings history page. This will show the actual readings provided by the smart meter. For a ToU tariff, you should see both peak and offpeak readings. Are there readings for each day?

Really looking forward to seeing some photos ...


  • Author
  • Rank 2
  • February 5, 2026

Hi, I’m in north Scotland, between Dundee and Aberdeen. No solar or anything. Orange numbers are kWh usage that month not readings (I can see I say readings on s/s but I meant usage. TBH I’m not pretty knowledgeable on the storage heating. The readings on my account do seem to have peak and off peak but something must wrong. I attach photos as requested. 
Thankyou so much


Ben_OVO
Community Manager
Forum|alt.badge.img+4
  • Community Manager
  • February 6, 2026

@Ginny2026 thanks very much for sending in all this info. Please could you also send a screenshot of the ‘Plan’ details, showing the name of your tariff, and your rates?


I don’t have access to check your account on the Forum, and it sounds like some deep investigation is necessary here. Have you logged a complaint at all? If so, you should have a complaints reference number. If you’ve received this, but haven’t heard anything back, please get in touch with our Support Team and request the complaint be escalated.


You mention nobody is listening to you when you speak to Support - I’m so sorry to hear this. We’ve got some great people working customer accounts here, and it sounds like you’ve had some bad luck. Get back in touch again, request the escalation, and request that this is looked into thoroughly. If you’ve got a complaint raised then it can’t be closed until the issue is resolved. If you’ve had one raised and it’s been closed as ‘resolved’, then this is incorrect.


Our complaints process can be found here: https://www.ovoenergy.com/feedback.


Please let us know how it goes - I hope it’s something easily fixable once the right person has looked at it.


Firedog
Super User
Forum|alt.badge.img+7
  • Super User
  • February 6, 2026

Brilliant, thank you so much for all those helpful pictures.

There are a couple of good signs:

  • It’s a fine meter (mine is exactly the same), and it’s clearly calling home with both readings and usage data as it should. 
  • The tariff is switching between peak and offpeak, with usage being recorded on the appropriate registers. Since the meter was installed, something like 84% of the energy it’s measured has been at the offpeak rate.
  • The tariff price shown (30.250p/kWh) is the Simpler Energy peak rate for Economy 10 in Northern Scotland (28.81p/kWh ex VAT). 
  • The tiny symbol in the bottom right-hand corner of the display shows that the photo was taken during a peak-rate period, when no power is being delivered to the switched circuit that feeds the storage heating equipment. 


What you should try to establish now is that the tariff is changing from peak to offpeak and back again at the right times, and that the power is being switched to the heating equipment at the same times. While the nominal offpeak starting times are 04:30, 13:30 and 20:30, they will in fact be a few (usually less than 15) minutes later. You should take note of just how many minutes the start is delayed by - it will always be the same, so you know when it’s safe to turn the stove on or have a quick electric shower, say. It’s not just the start time that’s delayed - the end time is, too, so you get the full whack of offpeak hours in total.

To pin down your meter’s ‘Randomized Offset’, to give it its official title, you could settle down next to the meter at 13:30 or 16:30 or 20:30 - whichever change time is least inconvenient for you. The display you found for Active Tariff Price will do; you may also be able to find one showing the Active TOU by using button ‘B’ to cycle through the various menus. Both the Price and the Number will change instantaneously when the tariff changes: Price will probably be either 30.250 or 23.770, Number either 1 (peak) or 2 (offpeak). Note the exact time of the change.

The tiny switch icon is supposed to change at exactly the same time, from o´o (open, no power) to something else, possibly LC1 or LC2 or LC1LC2 or perhaps just o¯o (closed, power on). Check that it does, or note the exact time when it does change.


Back soon to look into why your consumption has apparently increased so much ...


Firedog
Super User
Forum|alt.badge.img+7
  • Super User
  • February 6, 2026

Back soon to look into why your consumption has apparently increased so much …
 

Here we go.

You noticed that the (monthly) consumption is very much higher since the meter exchange (MEX) in May 2025, and you have figures from your online account to prove it.

I’d like to know what meter(s) and tariff you had before MEX. There’s a scenario which explains this apparent discrepancy in what you’re seeing, but you’ll have to tell us whether this pure speculation on my part is anything like reality:

  • Your smart meter was installed to replace the existing RTS system prior to the RTS signal switch-off scheduled for 30 June 2025; 
  • The tariff you were on during the RTS era was THTC, where the storage heaters were powered by offpeak electricity for a number of hours each day allocated by the network operator (SSEN) and controlled by the RTS; 
  • There was a second ‘heating’ meter which provided less expensive power to heating equipment other than storage heaters;
  • Although there is only one cable bringing power into the house, the two meters will have been recorded as two different supplies, each with its own identifier - its MPAN, a term sometimes used also to refer to the ‘S’ (for Supply) panel you should see on bills; 
  • After the old meters were removed and the smart meter installed, the ‘heating’ meter’s MPAN was deleted from the national database, while the other MPAN soldiers on as the identifier for the smart meter;
  • Your online account shows the available data for this single MPAN going back some time before the meter exchange. It doesn’t (and indeed probably can’t) show any historical data for the late ‘heating’ meter.

A quick look at bills from the time before MEX should show whether there were in fact two meters, one for 24-hour heating, the other for offpeak storage heating and peak everything else. 

If this guess is just wrong, I hope you can tell us just what metering system was replaced by the smart meter. I’m only speculating that you’re comparing the house’s whole energy use now to only part of the pre-MEX usage.

Once we know, we can start suggesting how to bring the usage - and so the cost - down a bit.


juliamc
Rank 20
Forum|alt.badge.img+8
  • Rank 20
  • February 6, 2026

Amazing reply as ever Firedog !!! Just clicking “Like” isn’t enough.


Firedog
Super User
Forum|alt.badge.img+7
  • Super User
  • February 7, 2026

@juliamc  All that glisters … 😐

@Ginny2026  I’ve had another look at what you’ve posted so far, and see that a lot of the speculation in my last post was misplaced - so sorry 😳 

Your spreadsheets do show readings from two meters, so you had one for heating and one for everything else. The Heating meter’s closing reading was 40139.7, and in the five months October 2024 to February 2025, it recorded a total consumption of only 25 kWh. This suggests that the bulk of the house’s energy consumption for heating was being recorded somewhere else. With storage heaters, I’d have expected their usage to be at night, on a reduced rate and recorded on a separate offpeak register. This isn’t apparent from your spreadsheet figures.

The closing reading for the non-heating meter was 21201, but we can’t tell whether that represented one register, one of two registers or the sum of two registers. The (almost illegible 😡) MEX label has this reading marked 1, so that could indicate that it was the one for the Tier 1 (peak?) register. Again, the total consumption recorded here for the five coldest winter months was 630 kWh, or about 4 kWh per day. Your storage heaters consume more than that in a single hour as shown by the usage chart you shared.  I can only conclude that your spreadsheet doesn’t include figures for the bulk of your energy consumption prior to MEX, that used for space heating and probably hot water too.

This should all be clarified by a look at your last bills before MEX. They should show usage at three different rates (peak, offpeak and heating), assuming you were on a sensible RTS tariff. Please have a look, and share here if you will (after obscuring any sensitive personal information, of course).

I hope you have the opportunity over the weekend to pin down your meter’s precise times for changing the tariff and switching on the heaters. 


  • Author
  • Rank 2
  • February 8, 2026

Hi firedog! You are amazing. Thankyou so much for spending the time on this. I’m afraid I’m finding it all very stressful so can only face looking at it periodically. Photos attached of meter at 6.55am, 13.31 and 13.36 today. 

Yes I had 2 meters and only switched due to the signal switch off (felt had no choice). A copy of bill over switch over that shows both tariffs pre smart meter and after smart meter. Yeah the green portion of my spreadsheet is the consumption on both old meters added together so should include all usage. Thanks again Ginny


  • Author
  • Rank 2
  • February 8, 2026

@Ginny2026 thanks very much for sending in all this info. Please could you also send a screenshot of the ‘Plan’ details, showing the name of your tariff, and your rates?


I don’t have access to check your account on the Forum, and it sounds like some deep investigation is necessary here. Have you logged a complaint at all? If so, you should have a complaints reference number. If you’ve received this, but haven’t heard anything back, please get in touch with our Support Team and request the complaint be escalated.


You mention nobody is listening to you when you speak to Support - I’m so sorry to hear this. We’ve got some great people working customer accounts here, and it sounds like you’ve had some bad luck. Get back in touch again, request the escalation, and request that this is looked into thoroughly. If you’ve got a complaint raised then it can’t be closed until the issue is resolved. If you’ve had one raised and it’s been closed as ‘resolved’, then this is incorrect.


Our complaints process can be found here: https://www.ovoenergy.com/feedback.


Please let us know how it goes - I hope it’s something easily fixable once the right person has looked at it.

Hi Ben,

Thankyou for your reply. I’ve tried to escalate it oncalls but been told there is nobody else I can talk to! Don’t worry I will be putting in a complaint and also reporting OVO to the regulator. My focus now though is to get what is wrong fixed as my bills at OVO in the meantime are becoming obscene. Even your reply is worrying, you work for OVO? Your advice is for me to keep chasing OVO, make a complaint and escalate it for someone to hopefully look into it, I would think if OVO really cared about their customers the correct reply should be “oh this is terrible, I will have it escalated at OVO and have someone investigate it and call you to remedy things” where is the customer service?! What a way to treat your customers. 

Regards Ginny


  • Author
  • Rank 2
  • February 8, 2026

Amazing reply as ever Firedog !!! Just clicking “Like” isn’t enough.

Yes thank god for firedog!! 


Firedog
Super User
Forum|alt.badge.img+7
  • Super User
  • February 8, 2026

Amazing reply as ever Firedog !!! Just clicking “Like” isn’t enough.

Yes thank god for firedog!! 

Please stop embarrassing me, both of you! Meanwhile, ​@Ginny2026 please have a look here.


  • Author
  • Rank 2
  • February 8, 2026

@Ginny2026 thanks very much for sending in all this info. Please could you also send a screenshot of the ‘Plan’ details, showing the name of your tariff, and your rates?


I don’t have access to check your account on the Forum, and it sounds like some deep investigation is necessary here. Have you logged a complaint at all? If so, you should have a complaints reference number. If you’ve received this, but haven’t heard anything back, please get in touch with our Support Team and request the complaint be escalated.


You mention nobody is listening to you when you speak to Support - I’m so sorry to hear this. We’ve got some great people working customer accounts here, and it sounds like you’ve had some bad luck. Get back in touch again, request the escalation, and request that this is looked into thoroughly. If you’ve got a complaint raised then it can’t be closed until the issue is resolved. If you’ve had one raised and it’s been closed as ‘resolved’, then this is incorrect.


Our complaints process can be found here: https://www.ovoenergy.com/feedback.


Please let us know how it goes - I hope it’s something easily fixable once the right person has looked at it.

Hi 


Feedback