Solved

Partially scrambled half hour data- Got an EV

  • 24 October 2023
  • 12 replies
  • 219 views

Userlevel 5
Badge +1

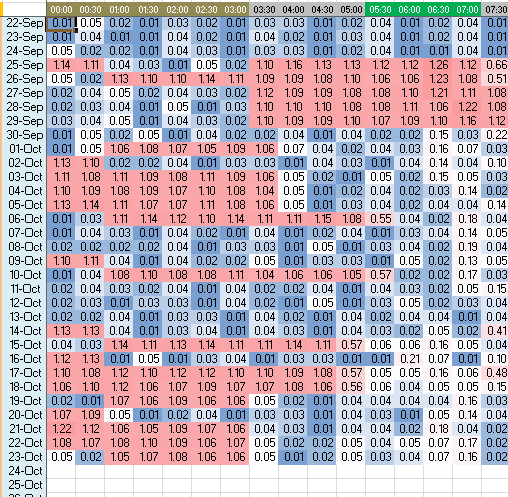
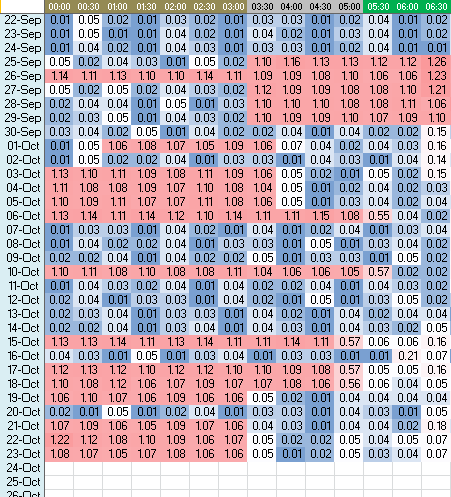
I have an EV and I monitor the energy that the car uses. I created a spreadsheet with the date down the side and half hour periods across the top and colour coded the energy usage with conditional formatting to show high energy usage at red and low as blue. I then noticed that  the data for the first two half hour periods is displaced one day earlier than it should be.

The two screenshots show the data as supplied and then how it should look. None of the timers on the car start or finish at 01:00. Generally the timers are set for 22:00 to 03:30 which is 5.5 hours of charging. The text messages I get from Renault do not show charging stopping or starting at 1am (02:00 CET). They show continuous charging from 23:00 (CET) to 04:30 (CET).

There is also at least one example where even the displaced charging data (1 hour) is completely missing.  If the billing accurately reflects the data then I’m also not being charged for that.

I didn’t set out to check the accuracy of the data. I did it to monitor how I was progressing on the Power Move Challenge which is going quite well and then I noticed this.


Has anyone else noticed this behaviour?


Peter


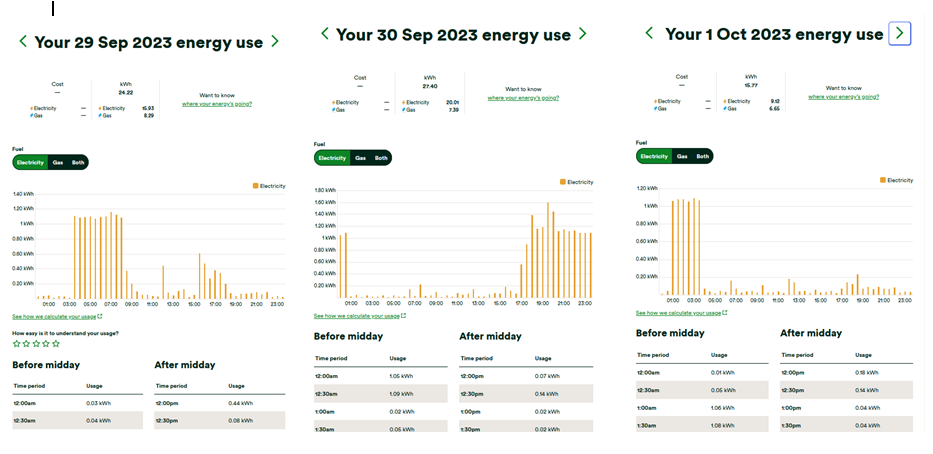
PS If you are wondering how the data can be displaced 1 day earlier (which seems to imply time travel is possible) then I’ve noticed sometimes that when I look at the data I get the first two half hour values from today before the rest of the data from yesterday appears. To say this in more detail: If it is the 21st, in the afternoon, I get the first two HH period data (from the 21st) and then a bit later on I get the other 46 HH data from the 20th which is appended to the data from the 21st.


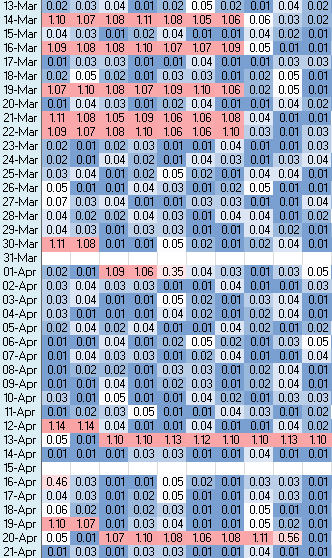
PPS I’m now wondering if this is due to Daylight saving Time and it will magically unscramble itself when the clocks change shortly.


icon

Best answer by Firedog 25 October 2023, 23:51

View original

12 replies

Userlevel 5
Badge +1

Further information: It’s not daylight saving time. In a sample of 27 charging sessions that spanned midnight the data is:

Correct = 13

Missing = 2

Displaced -1 day = 10 (data is 24 hours before it was supposed be logged)

Displaced +1 day = 2 (data is 24 hours after it was supposed to be logged)

So it’s not even consistent. So overall the energy used has mostly been accounted for, but the data moved and only on two occasions was the data for 2 HH periods actually lost so it appears I’m better off by about £1.20. Make of this what you want for the accuracy of smart meters.

Userlevel 7
Badge +2

Hi @Peter E

Out of curiosity have you seen much/any  difference between the daily total extracted from the meter reading page vs a daily total from summing up the 30min usage on the usage page

https://account.ovoenergy.com/meter-readings/history/electricity

https://account.ovoenergy.com/usage?datePeriod=daily&unit=kwh&fuel=electricity

OVO doesn't use anything on the usage page for billing and the 30min slots are not added up to make a daily total. The 30min data isn't used for billing. You may already know all this. 

Userlevel 7
Badge

You’re not alone in struggling with the timings of half-hourly (Hh) data. The problem is that the electricity industry works always on UTC (GMT), while people in real life work on local time, currently BST (GMT+1). Depending on where the data come from, they may or may not have been adjusted for the difference. 

The OVO ‘Day’ Usage page is adjusted, so the times shown are local (BST). This leads to strange things at the start and end of BST, as you’ll probably see if you look up the page for  26 March 2023 (I say ‘probably,’ because I’m not certain that every smart meter is configured in the same way as far as this is concerned). 

I too try to track my Hh figures, but I find it easier to piggyback on one of the third-party data aggregators to get them. I use n3rgy, by way of Guy Lipman’s excellent utilities. Here’s what the CSV for the same timezone change look like, C&P from Excel:

Period
UTC
Date
local
StartTime
local
Timezone
Adj
Quantity
(kwh)
25/03/2023 23:00 25/03/2023 23:00 0 0.091
25/03/2023 23:30 25/03/2023 23:30 0 0.080
26/03/2023 00:00 26/03/2023 00:00 0 0.087
26/03/2023 00:30 26/03/2023 00:30 0 0.130
26/03/2023 01:00 26/03/2023 02:00 1 0.094
26/03/2023 01:30 26/03/2023 02:30 1 0.088
26/03/2023 02:00 26/03/2023 03:00 1 0.073
26/03/2023 02:30 26/03/2023 03:30 1 0.046


It’s probably best to be consistent by sticking to UTC everywhere. If there are any gaps in the DCC data (e.g. during a power cut), these are flagged on Lipman’s Admin page.

I can’t explain why you’re seeing displacements by a whole day, and can only suspect that something went wrong when transferring figures from your source to the worksheet. There is, of course, the confusion at the OVO account site where meter readings are variously timed at the midnight (UTC) at the start or the end of the day they’re labelled with.


As regards @Jeffus’ remark about whether there’s a difference between a day’s consumption as measured by differencing meter readings on the one hand and summing Hh data on the other, I can only say that the last couple of weeks’ data for my new meter differ at most by 1Wh on any day, and by 1Wh for all the days. This is clearly not significant. There is, however, a tiny but significant difference between the peak and offpeak totals for each day, with the peak totals over-reported (and offpeak under-reported) by an average of about 3Wh each day. I give the supplier the benefit of the doubt here, guessing that the difference arises from the difference in reporting times of the Hh data on the one hand and the register readings on the other. If I’ve done my sums properly, 3Wh corresponds to about 4 minutes by which the offpeak period is under-reported, i.e. about 0.9%. It’s neither here nor there for a customer like me, but it all adds up - in OVO’s favour - if this scenario is repeated for every E7 customer. I wonder if settlement depends on the same data timings. 


Userlevel 5
Badge +1

@Jeffus Thank you for the point about double checking that the HH and daily rates agree. I also checked whether the monthly billing value was right and they all agree to within a small margin. Apart from the graph which at times looks like a random collection of values (during a power cut) everything presented as values appears to be correct if not actually in the right place.


@Firedog Thank you for the insight into BST/UTC. I don’t think it works consistently but it seems Ovo collect meter readings which are accurate but they sometimes have problems knowing what to do with them but in the end they manage to slot them in somewhere so that the total bill is correct. It will be interesting to see what happens when we go back to GMT. Having done the check that @Jeffus suggested I’m happy the bill is correct but the presentation of the data is a bit haphazard from a user perspective. Thank you @Firedog  for the links to the other resources. Always interesting to explore these.

Userlevel 5
Badge +1

@Firedog You mentioned the possibility that I had incorrectly copied across the wrong information (which got me to double check what I had done).

On the 29th I charged the car in the early hours but not late at night going into the 30th.

For the 30th it supposedly shows an isolated 1 hour of charging starting from midnight. The car definitely wasn’t connected to the charge point.

Later on on the 30th I started a charge late afternoon going through to about 2am on the 1st Oct but there is supposedly a gap from midnight to 1am on the 1st Oct. This gap is not backed up by SMS messages to say the charging had stopped and started and the charge would have been about 5% short of what I was expecting from the SoC on the battery and it wasn’t. This is definitely data being moved to different slots possibly because of the UTC/BST issue but the data overall is correct.


Userlevel 7
Badge

OK, I see your point and agree that this isn’t right by any measure. It looks as if the figures labelled 12:00am and 12:30am are the ones that belong at the other end of the day. For most customers most of the time, this would make very little difference since usage tends to be both low and consistent at that time of day, and even within the rounding error from three to two decimal places, if your meter is capable of reporting to the nearest Wh. For what it’s worth, I can see the same phenomenon on my own account pages, so it looks as if this is a simple coding error. The histograms and tables are showing all the right data, but not necessarily in the right order as regards the interval around midnight.  

You could establish whether this is what’s happening by looking at other sources of what should be the same data. With a bit of legerdemain, it’s possible to see the data OVO are using to construct both the histograms and the tables on the Usage pages. Another possibility is to access the data your meter transmits to DCC via a third party; I use n3rgy, because as far as I can tell the data are not embellished in any way, and the timing of each half-hour slot is given precisely.  I’ll post the instructions for this method below once I’ve found a moment to work through them like a complete novice. Watch this space đŸ‘€

Userlevel 7
Badge +2

@Peter E

These sort of chats use to go on a lot over the years when @Transparent and @Simon1D were around, two very knowledgeable posters. 

This is just one example and including chats about gas and electricity albeit not what you are seeing. 

There may be some useful info on their posts over the years. 

Userlevel 7
Badge

I’ve now satisfied myself that what you spotted is indeed a silly website coding error. The two first entries in the table are those for 23:00 and 23:30 UTC on the day specified instead of the ones for the previous day, shifted by one hour for BST. This happens for every day. I don’t know whether this is new, or whether it’s always been like that and I just never noticed.

Here’s just one way of retrieving your raw smart meter data, ready for you to examine and manipulate in, say, Excel if you’re so inclined. You’ll need to know your MPAN (the unique identifier of your electricity supply) and the UID of your IHD (this isn’t published anywhere and so identifies you as the user whose meter data you’re accessing). The MPAN is shown near the top of page 2 of your bill, and the IHD UID is usually on a sticker on the back or bottom of the device, or if that’s dropped off, it will be given somewhere in the device’s settings. It consists of 16 hexadecimal characters often displayed in pairs.

Armed with these IDs, visit n3rgy.com and satisfy yourself about their integrity. Click the I’m a consumer button to get started; there’s a Consumer Sign up button at the foot of the next page. Follow the prompts to set up and verify your account.

Now visit Smart Meter Reports (guylipman.com) and follow the links to load data from n3rgy. While you can happily use Lipman’s own visualizations and figures on his Consumption pages, I prefer to download the raw half-hour data as CSV. In your case, you could take the three days shown in your screenshots; once you have the CSV, you should easily spot where those rogue bars came from by comparing the UTC and BST timings. 


Userlevel 5
Badge +1

I don’t think I’ve ever looked forward so much to the clocks changing as they will do on Sunday. What I need to do is put a ‘marker’ on one of the peripatetic HH periods so that it is something other than the background level, like put the oven on just past midnight for 15 minutes. However, if I do that my wife is bound to ask me what I’m doing and will probably have me certified and taken away.

Userlevel 7
Badge

‘Certified’? You’re showing your age!

I was convinced of this fault by happenstance. A couple of days ago, I had to call for an ambulance to take me to hospital. As instructed, I unlocked the front door and switched on the outside light. They duly turned up and took me away, and I didn’t get home again until the following day (luckily with no lasting health problems). I checked my IHD and saw higher-that-expected usage while the house was empty. Of course, in the panic surrounding my departure, I’d forgotten about the outside light, which I discovered had the only non-LED bulb in the house, a halogen monster. So that night showed a constant ~80W draw instead of the usual ~50W, but the OVO usage chart moved the last hour’s usage for that day to the previous midnight. 

I don’t think you need to undertake any sort of certifiable activity to establish the fault - your usage histograms illustrate it very well.


PS I cannot get used to this silly (American?) sequence. where 12am comes before 11am instead of following it. 12 o’clock is neither AM nor PM - it’s just M. I wish OVO would use the 24-hour clock and take the objections on the chin until everyone has got used to it, like we’ve had to do with train and plane times. I suspect that this fault wouldn’t have arisen if the table started at 00:00 - 00:29 and ended at 23:30 - 23:59, as it does in the underlying data.

Userlevel 5
Badge +1

Rather than waiting for Sunday I went and retrieved some data from earlier in the year and it is definitely a UTC/BST issue. You can see the anomaly appears after the 26th March. The blank lines are missing data. At least I can work out where the data is now.


Userlevel 7
Badge

Nice! 

The missing data for the end of the quarter was a long-term known issue, which has now been resolved, we’re told. It’s anyone’s guess why you’re missing data for 15 April, though. But your displaced pink cells appear to illustrate the problem very effectively. Thanks!

Reply