Solved

My gas usage figures on the online account change after a few days? Why?


Userlevel 4

Hi I have smart meter and (like many others I guess) I’m tracking usage more closely. I’ve noticed a strange thing - the gas usage figures are revised after a few days (upwards for the couple of periods I’ve checked). Both the app and website are showing the same figures, so that’s not the issue.

Here are two screen shots, one taken last Monday and one taken today. Any ideas why? And should I be concerned? Electricity usage figure does not change.


Screenshot 17 October
 
Screenshot 24 Oct - figures for 14, 15, 16 Oct revised


icon

Best answer by Simon1D 25 October 2022, 00:25

View original

12 replies

Userlevel 7
Badge +5

@hecate I don’t know if you check your readings history as well. Sometimes, I understand, only a partial reading is available/sent so if the smart meter then sends an updated reading that might be a reason. Otherwise there could be an estimate used if the daily reading isn’t available. Just an idea - I know that our gas meter, being a little distant from the main building occasionally doesn’t have a full daily read

Userlevel 4

@BPLightlogThanks, lack of readings probaly not the issue. I did have a few problems with readings not getting though to the app/website a while ago, but that was just showing nothing available. And the pattern of readings shown does not look as if it’s an estimate. I may have to look daily and check back...

One thought - could be to do with adjustment to gas thermal values, but I thought that was set in advance, not arrears?

Userlevel 7

Updated on 26/06/23 by Emmanuelle_OVO

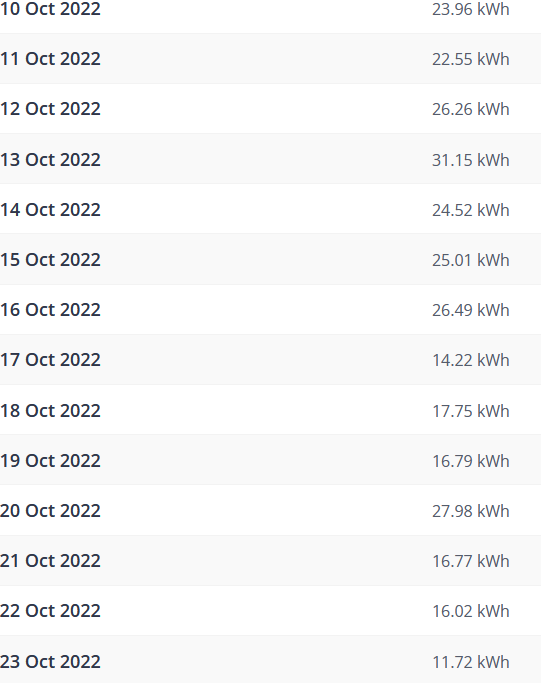
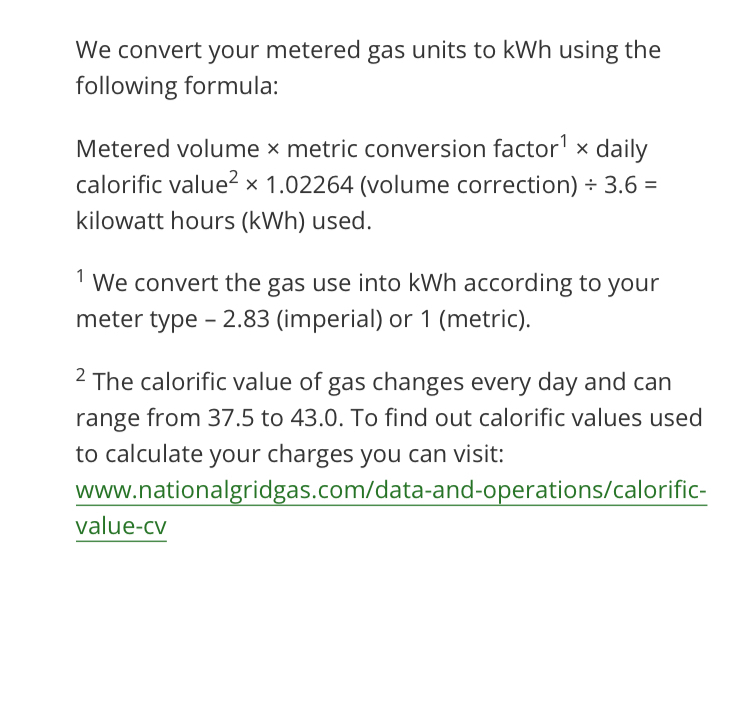
I’m very confident that it’s the Calorific Value. Meters measure gas volume and can’t know what the energy content is until the gas properties have been measured, which they are at many places across the country, every day. Provisional CVs for the day in progress are published by National Grid at 10:30am, at the same time as they publish what are usually the finalised values for the previous day. (My words, not theirs - very occasionally more than one revision is published, with the update coming around 4:30pm.) Gas suppliers generally use those numbers within a few hours, so if you see yesterday’s consumption before 10:30am, the supplier must be using a provisional value for CV, which may change. National grid keep all values available so you can, if so inclined, calculate for yourself how the usage in kWh will have varied as CV estimates change.

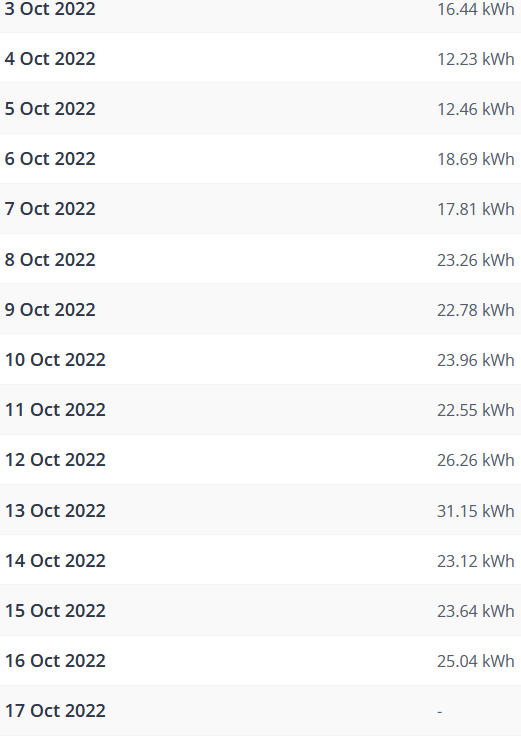
I’ve been on this journey, and a helpful trick is to remember that all these energy usage values in kWh are derived from gas meter readings in volume, which are exact multiples of 0.001 m^3

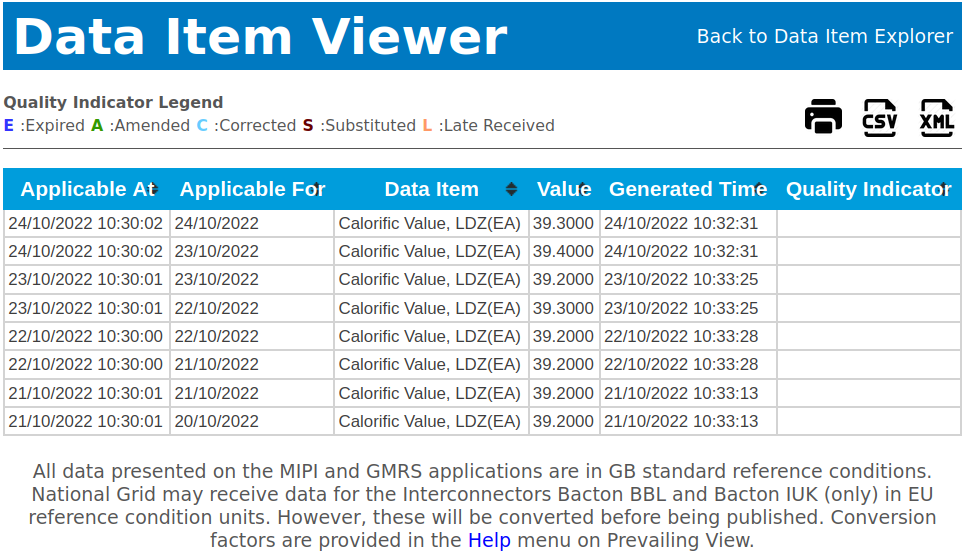
The national grid data can be queried here, and you’ll need to know which area you’re in ...

https://mip-prd-web.azurewebsites.net/DataItemExplorer/

have fun ;-)

Userlevel 7
Badge +5

Interesting @Simon1D . I haven’t noticed my figures changing (but will be watching more closely now). I would have thought that all the figures would change in that case, not just some of them.

Userlevel 7

Interesting @Simon1D . I haven’t noticed my figures changing (but will be watching more closely now). I would have thought that all the figures would change in that case, not just some of them.

Ovo’s half-hourly usage values don’t change (or didn’t, while they were my supplier) because, I worked out, those plots only ever use a nominal value for CV (39.5 MJ/m^3, iirc). It’s the daily usage figures that are based on national grid values for CV, and the values in use can (in principle) change every midnight (UTC).

National Grid talks about values being

  • applicable “at” a certain date and time (this is when the data were published) and
  • applicable “for” a certain date (i.e. when the gas was actually supplied)

So here’s a query from a few moments ago:

which leads to

(The “latest values” check box actually means “show me only the latest values”, so if you want to see changes in CV, leave that unchecked.)

From this data I would expect that usage on 23 Oct as reported by my supplier on 24 Oct before 10:30am might change from an initial value which uses 39.2 MJ/m^3 to a (probably) final value using 39.4 MJ/m^3. This creates the impression that the usage increases by 0.51%. Exactly when this spontaneous increase happens depends on when the supplier refreshes the data they show the consumer.

I always assumed this is partly why each new bill doesn’t appear until a few days after the closing reading for the month has been taken - we pay for energy, not volume of gas consumed.

Userlevel 4

Thanks @Simon1D I have daily, not half hourly readings (another story) and have been checking weekly on Mondays.

Given the daily provisional/confirmed cycle you describe, I'd expect correction for one previous day (or at most two). Three days is a puzzle unless it's due to not updating over the weekend.

I'll investigate and report

Userlevel 7

Given that these are data being reported by Ovo, not updating over the weekend sounds pretty likely to me. (National Grid do publish data at around the same time(s) every day.)

Userlevel 4

Update - I’ve checked daily (after 1030). The revisions are unpredictable.

On 25 October the kWh figures for 20-23 October inclusive were revised; on 27 October, just the figure for 26 October, on 28 October, the figures for 24-26 October inclusive, and on all other days no revisions!

I’ve no checked against National Grid thermal values (yet), it’s the odd and apparently random adjustments that perplex me. Any more ideas @Simon1D@BPLightlog ?

Userlevel 7
Badge +5

Looking at my own figures now @hecate and I see that mine do a similar thing. Checking one or two, it is consistent with an update in calorific value as I believe all suppliers use a default level before full details are published. So I think that is the answer

Userlevel 7
Badge +5

A short update .. I’ve been told that OVO use an average calorific value of 39.42 and this then would need to be adjusted once figures are released as has previously been mentioned. 
 

Also on the billing page for your gas usage you will see

This should then equate to the updates on your daily charges. 

Userlevel 4

@BPLightlog thanks, so in answer to my OP, (a) what’s going on is likely to be delay in Ovo using NG Gas revised CV figures (doesn’t matter to me which is responsible) and (b) nothing to worry about, except that I should track my usage a few days after the event and/or beware of revisions.

Userlevel 7
Badge +5

Sounds about right @hecate. I’m guessing that with the latest trends in tracking energy use daily the updates posted by National Grid (which are regionally based) is slightly out of step with the daily tracking and so we have the adjustments which you picked up

Reply