Good morning. I am on a bill monthly account but always make sure I am in credit so log in daily to keep an eye.
Im very careful with usage of gas/electric
I only put my heating on when needed usually twice for an hour or 2 when freezing in the evenings and only to keep dampness away as i tuck myself up with electric blanket
If I have my grandbabies I keep it running and last week I had them for 1 days and 1 night so kept on heating all day as both under 2years
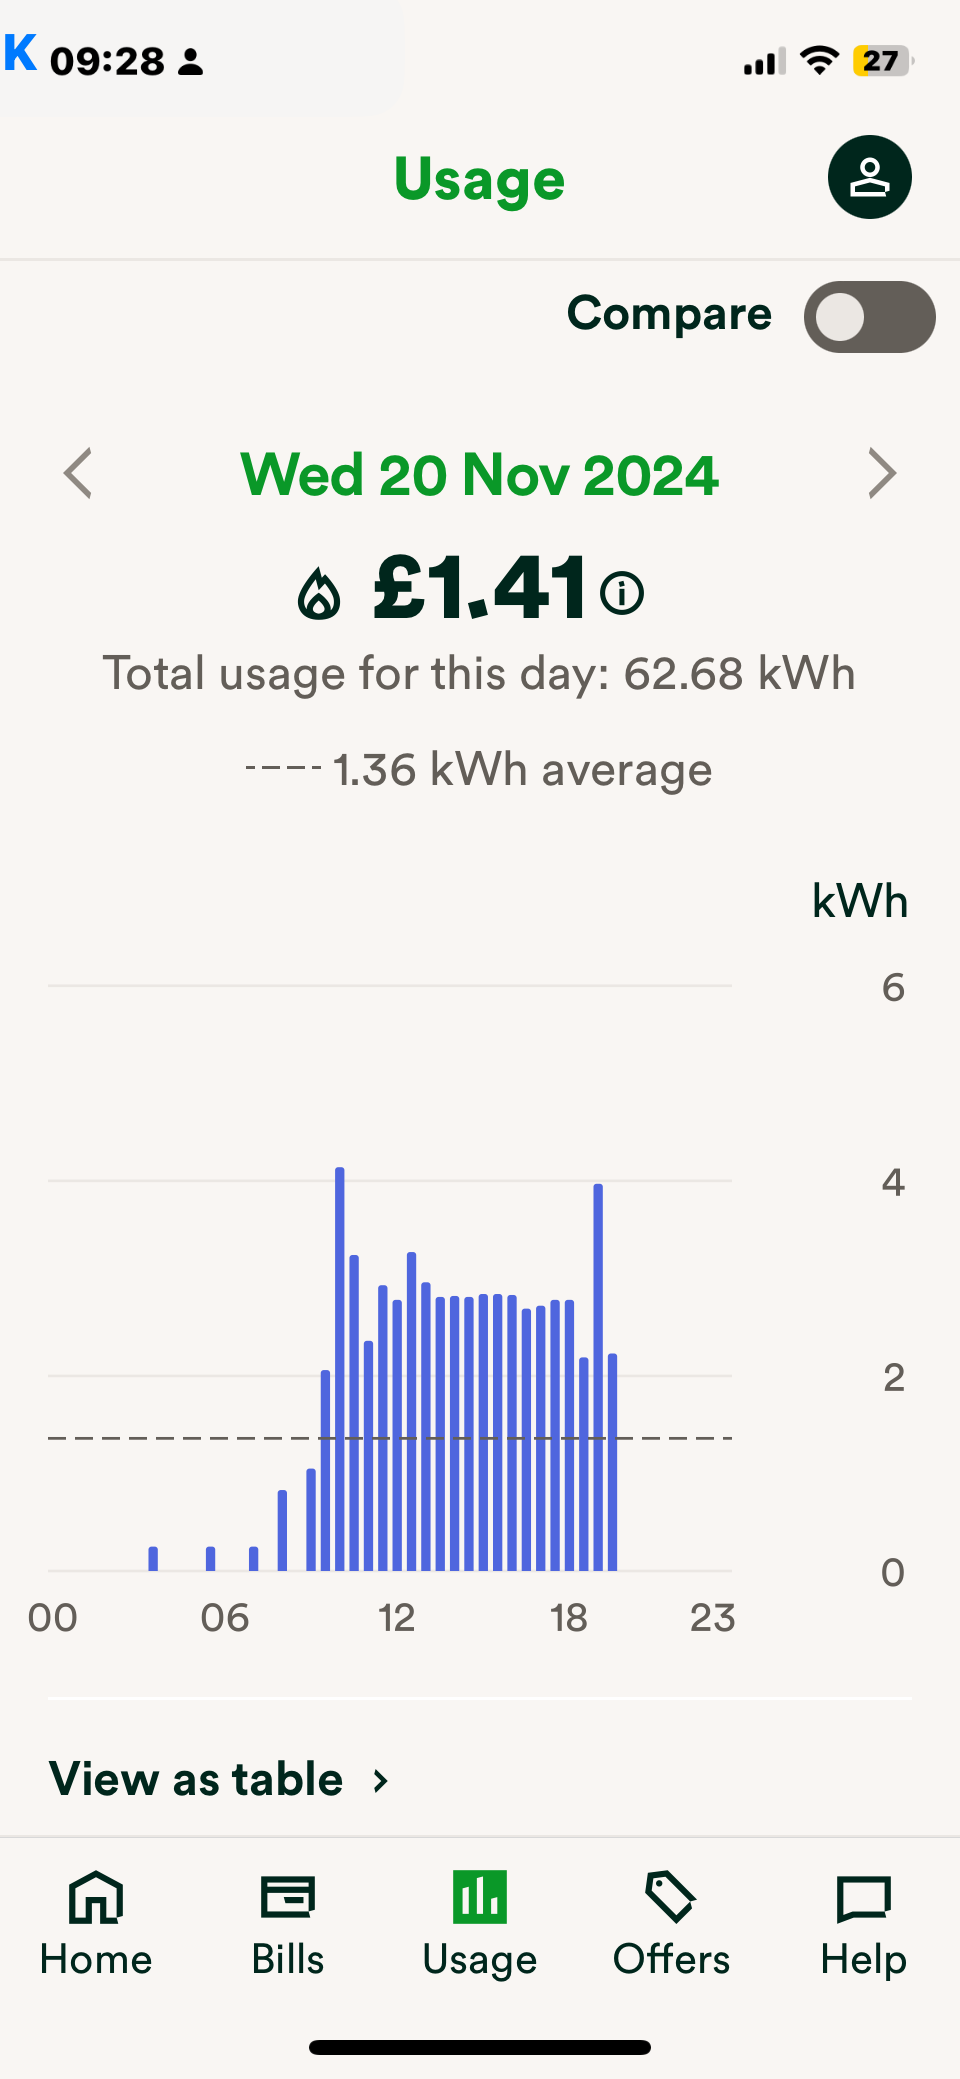
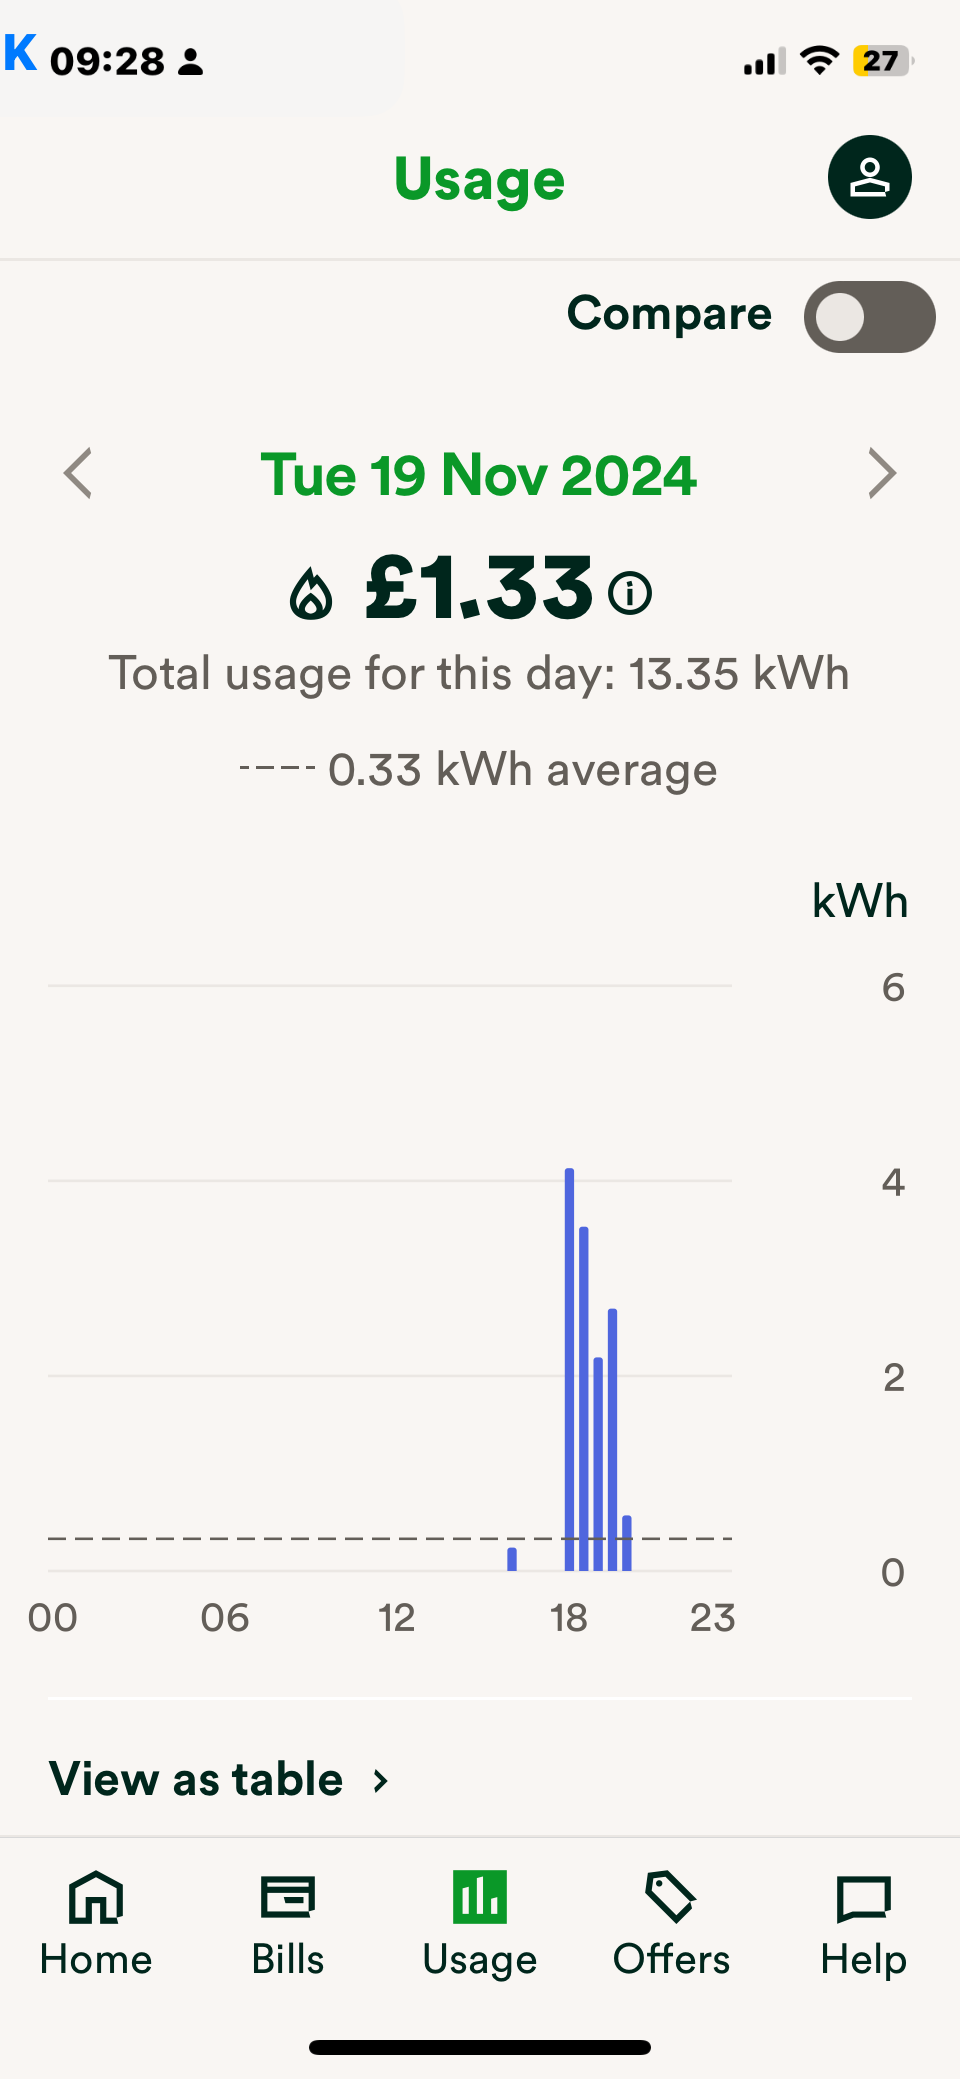
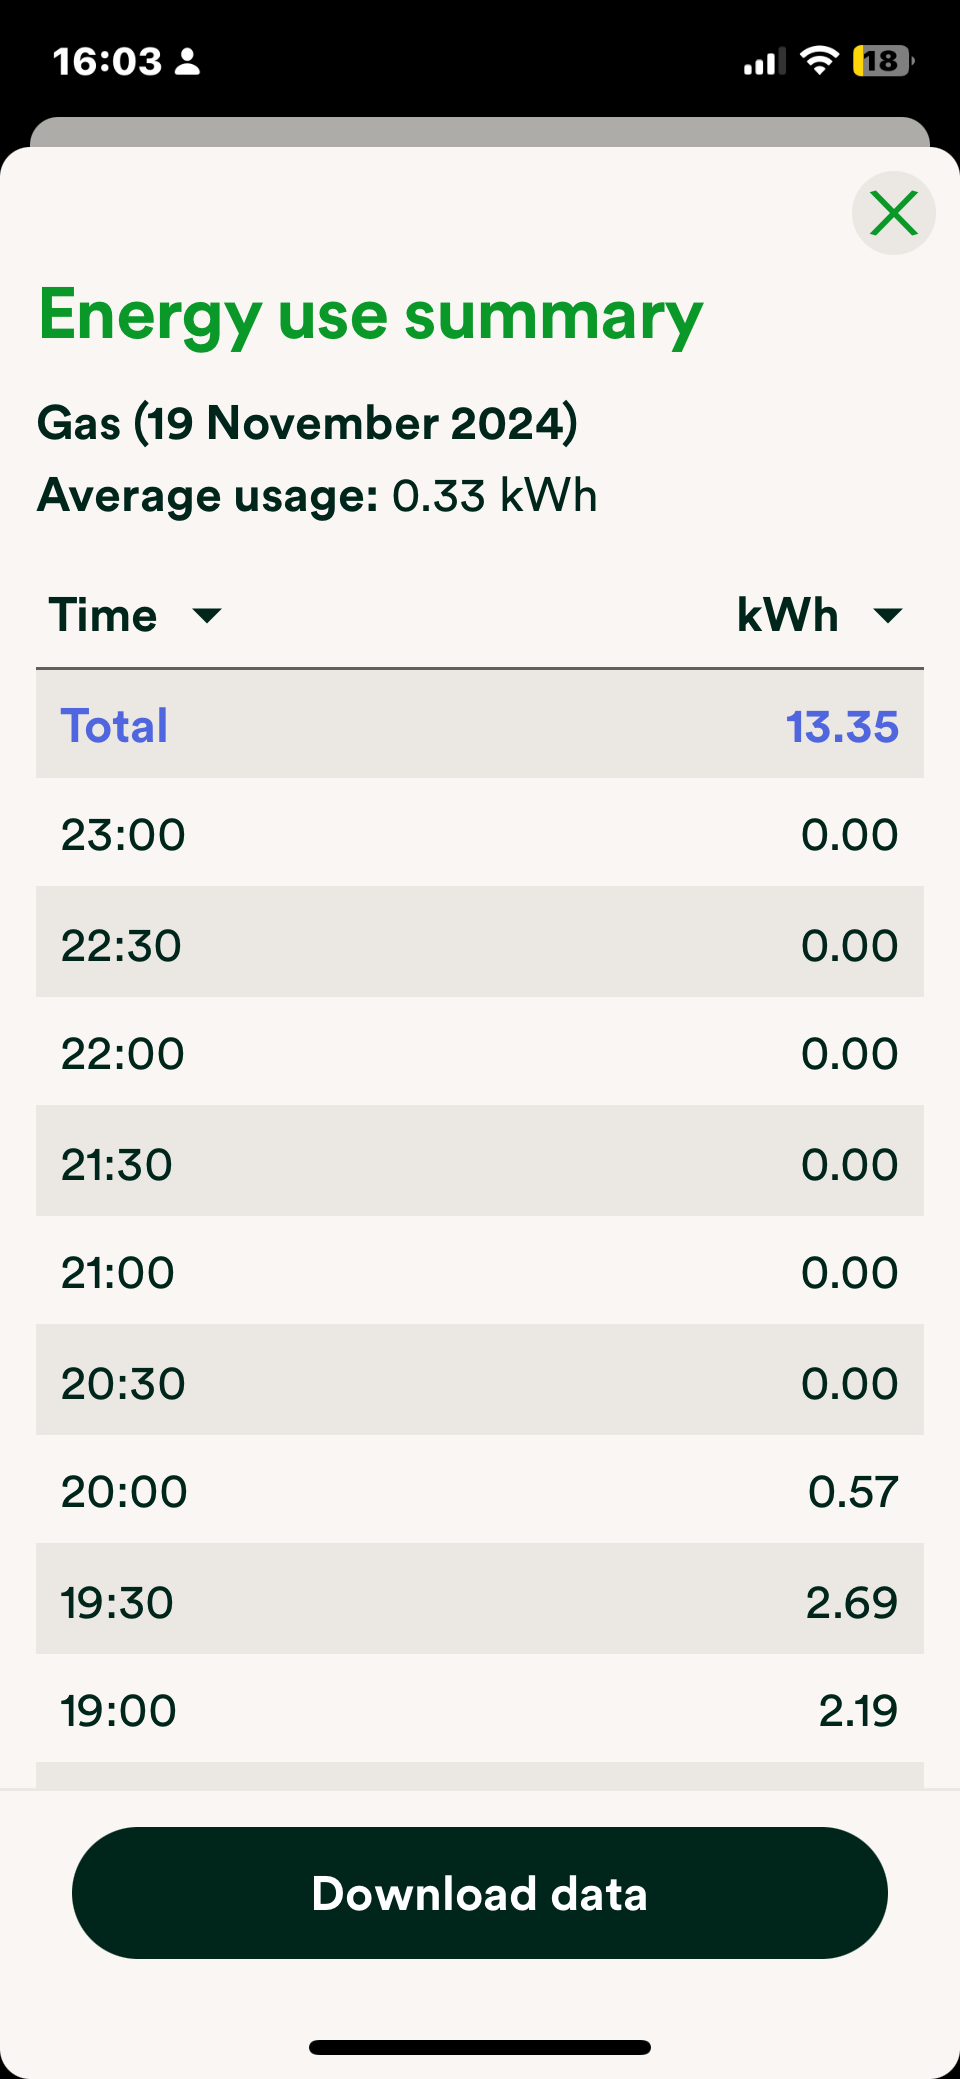
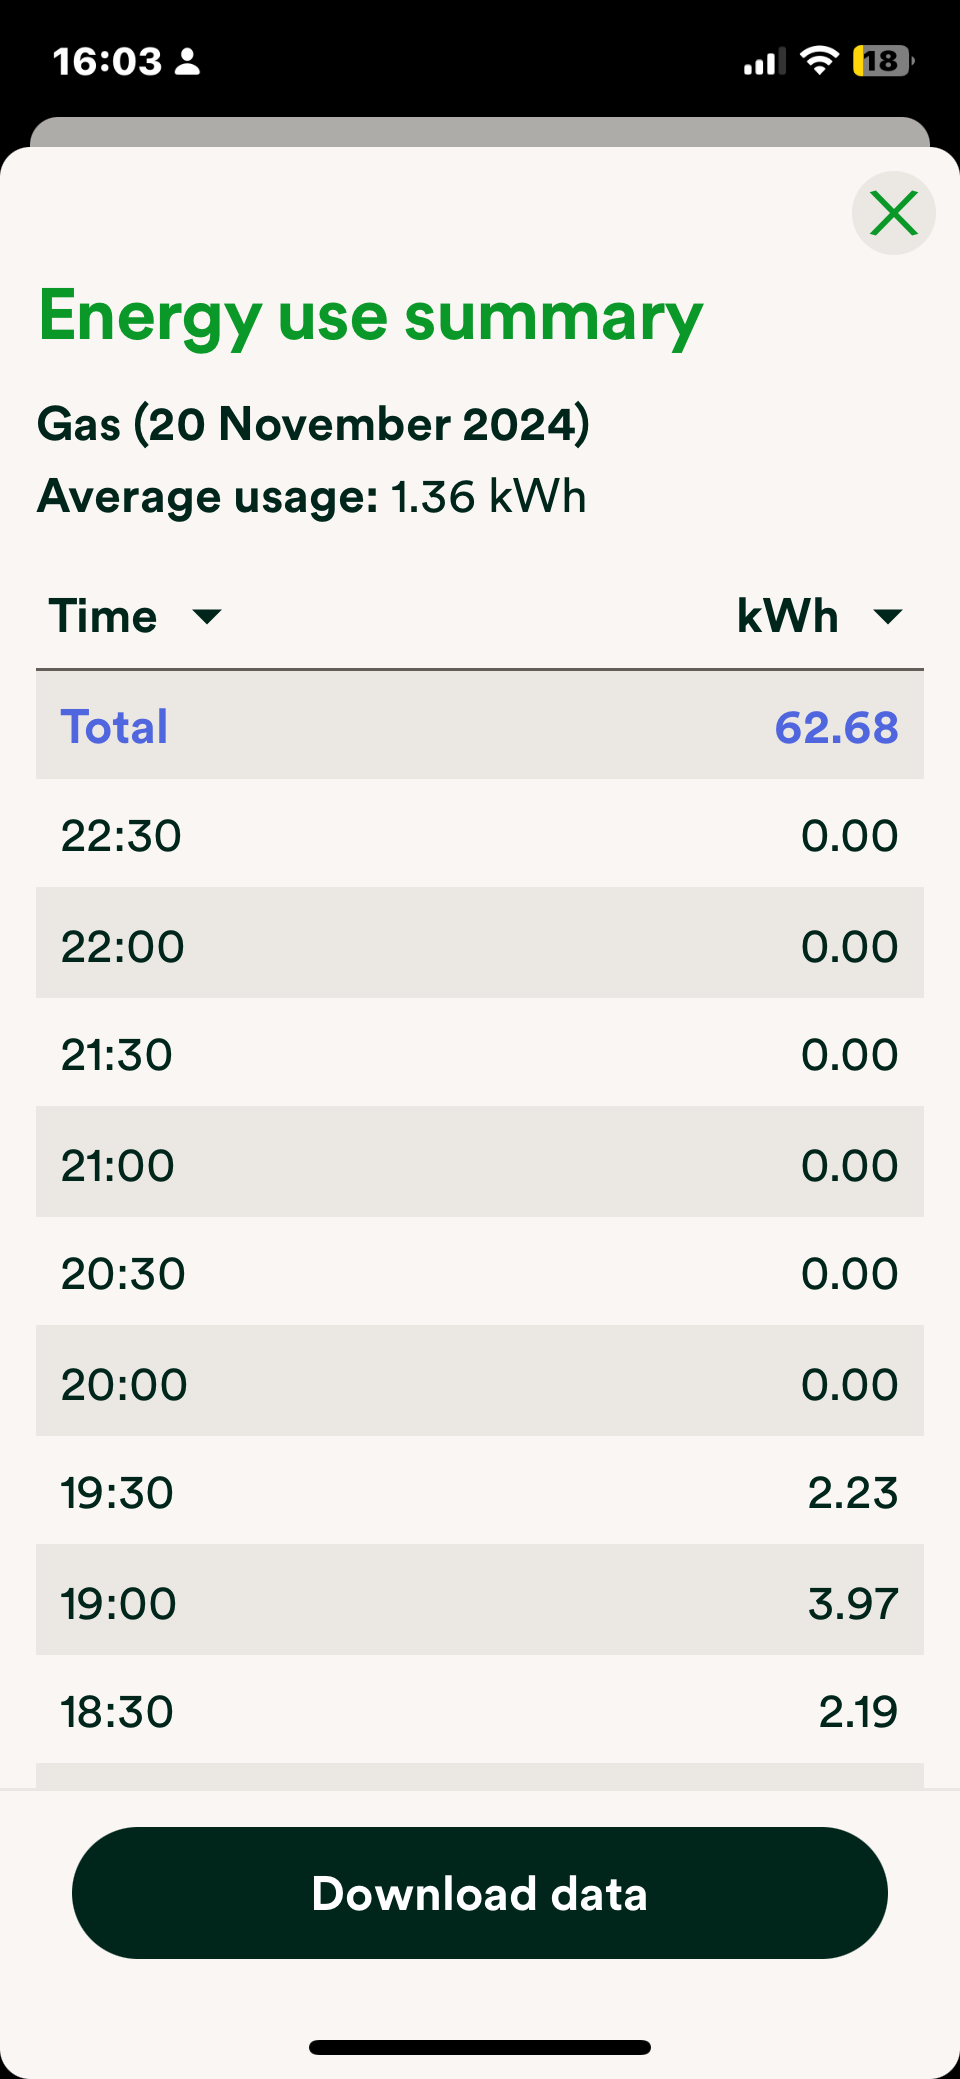
Ive been worried about the cost of usage but I must be in the twilight zone as price doesnt make sense. The Wednesday my heating was on all day and tuesday was a ‘regular’ day but look at the difference in cost?
Does this seem right?
Im in a 3 bed semi bungalow with windows that desperately need replacing so very very draughty
Thank you in advance
Best answer by Firedog
I agree that that looks odd. However, you can’t ever rely on the usage charts to tell you what your energy costs. The figure shown for the daily cost be an estimate of what the gas has cost. This will depend on the calorific value (CV) of the gas on that day, and the CV may not have been available when the chart was viewed.
You’d get a better idea of what a day’s use is costing by multiplying the kWh figure (itself an estimate) by your unit price and adding the standing charge. Both of those should be given on the Plan page. Don’t forget to add 5% for VAT once you’ve done the sums. Your gas on Wednesday would have cost something like [(63 kWh x £0.062/kWh) + £0.305/day] = £4.21 + 5% = £4.42.
If the chart is still saying £1.41 for Wednesday in a day or two’s time, I can’t imagine what’s wrong. Let’s hope someone else has seen this sort of thing before.
Yes it doesn’t seem to tally up @chattycath. I wonder if it is something to do with the calorific value. When you get your monthly statement through multiply the kWhs used by the unit rate (including VAT) & see if it’s accurate.
You can post the figures here as well if you like, but please don’t include any personal information.
Firedog wrote:
I agree that that looks odd. However, you can’t ever rely on the usage charts to tell you what your energy costs. The figure shown for the daily cost be an estimate of what the gas has cost. This will depend on the calorific value (CV) of the gas on that day, and the CV may not have been available when the chart was viewed.
You’d get a better idea of what a day’s use is costing by multiplying the kWh figure (itself an estimate) by your unit price and adding the standing charge. Both of those should be given on the Plan page. Don’t forget to add 5% for VAT once you’ve done the sums. Your gas on Wednesday would have cost something like [(63 kWh x £0.062/kWh) + £0.305/day] = £4.21 + 5% = £4.42.
If the chart is still saying £1.41 for Wednesday in a day or two’s time, I can’t imagine what’s wrong. Let’s hope someone else has seen this sort of thing before.
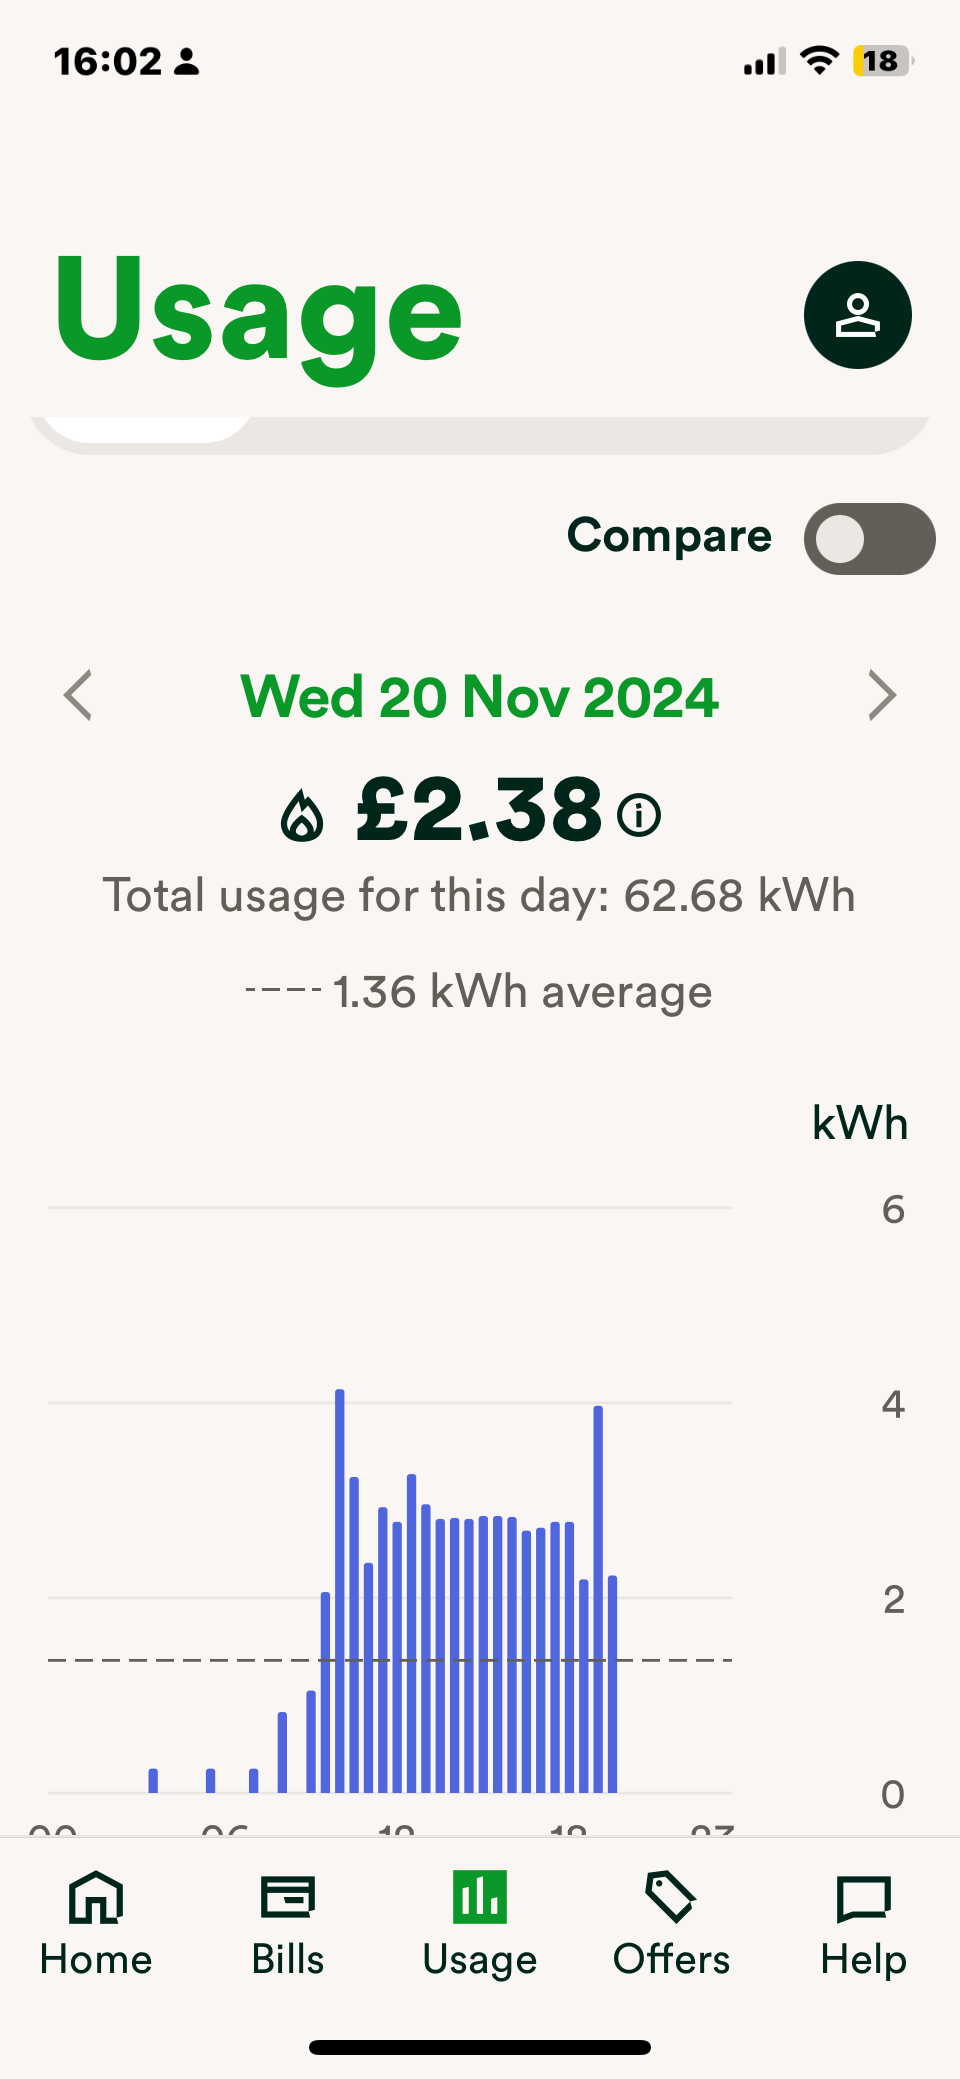
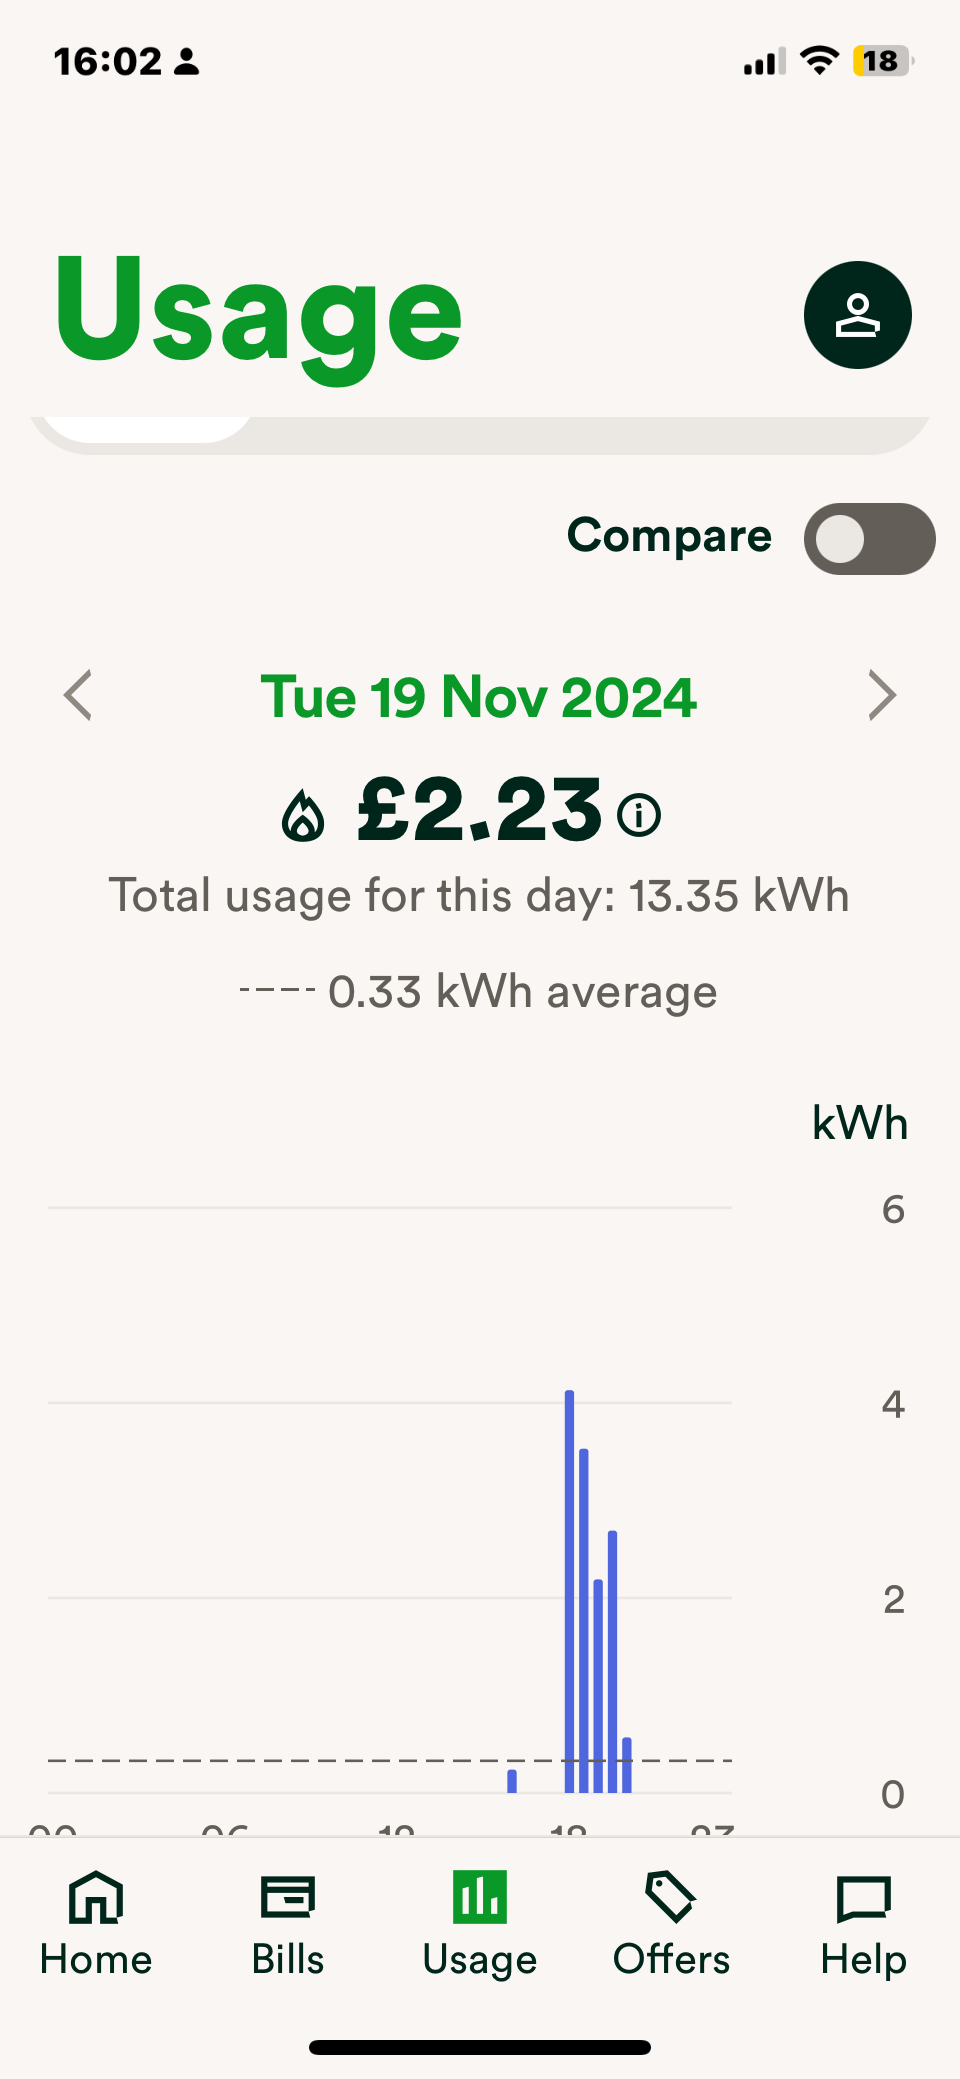
I check on my daily usage using the app. One day it will show me a final daily charge then when I look again a couple of days later it will always have gone up .. has anyone else seen this ??
The first usage you usually see can easily be a little off which is why there may be corrections when calculating direct from the daily meter readings. For gas, the calorific value has to be calculated when the details are published which is after a days delivery.
You have to remember that the daily figure on the app (or online account) is an indication and may not be the true story.
In particular if they don’t yet have the smart meter data for a day they will use an estimate and correct it later when thet do get the SM data, that’s one reason why it can sometimes change. Sometimes you will see it change between morning and afternoon, depending on when they get the data.
In the end though the daily balance on the app is just an indication, and it’s your actual billing at the end of your monthly billing period that counts.
As an example I had a smart meter sending readings for electricity, but had to send my gas readings manually. That meant that my daily balances were estimated for the gas use, until I sent a gas meter reading at which point they got changed to reflect what gas I had actually used. Very occasionally the electricity data may also be a day or two late getting to OVO, again they estimate the daily and then correct it when they have the actual data. So while the daily balance is just an indication, for the actual billing it all evens out to actual meter readings (if they have them).
We use 3 different kinds of cookies. You can choose which cookies you want to accept. We need basic cookies to make this site work, therefore these are the minimum you can select. Learn more about our cookies.