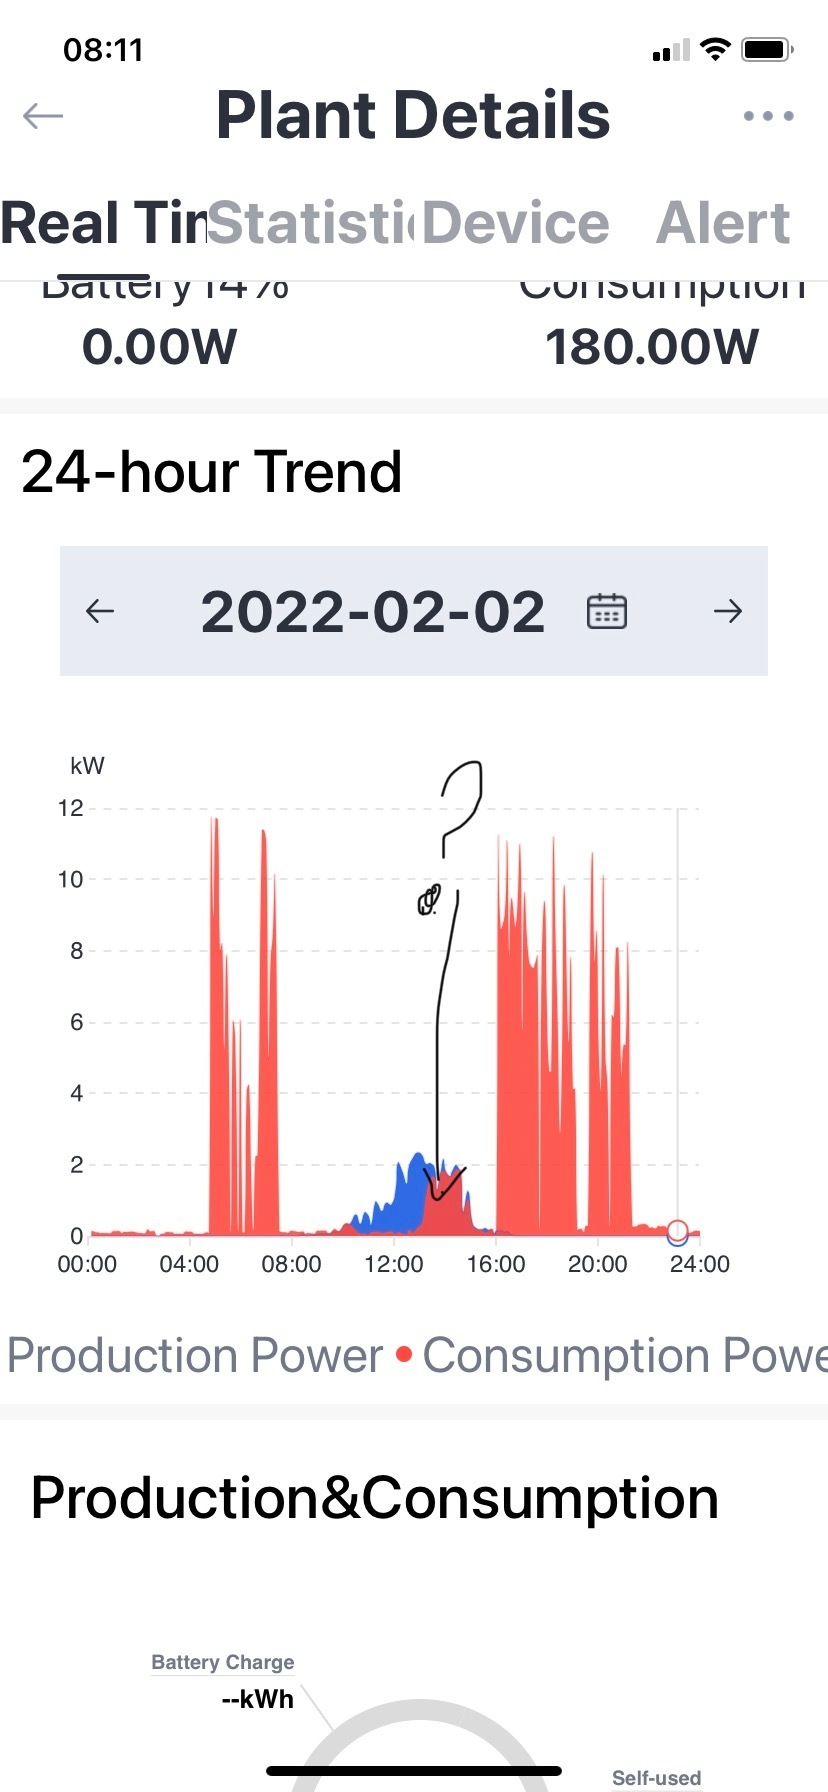
I have a SOLARMAN smart app. During the day when solar panels are producing energy it shows as a blue area on the graph. At roughly the same time it shows a similar size red area of energy usage at a time when almost no energy is being used in the house
we have a solar array, 1 battery, a hot water cylinder and a SOLARiBoost+ thank you
philip
Best answer by PeterR1947
That consumption peak (in red)is around the time of peak panel production (in blue) but not always and it often happens when there is no usage from the house. My only thought was that the SOLARiBoost which uses power from the panels/battery to heat water in the tank is kicking in and showing as consumption on the graph although it’s not consuming from the grid. look forward to hearing some thoughts on this
You could try turning off the Solariboost to see if the red bit goes away, that should confirm exactly what is causing it
I have the SOLARMAN smart app. It shows production and consumption on a graph with red a blue colours respectively. We produce some energy through solar panels but there is nearly always a corresponding rise in consumption showing red on the graph at the same time. I don’t understand what is consuming energy at this time as we are out. We have a solar iboost which heats hot water when panels are producing power.
We’ve actually got quite a few members on here who know this stuff far better than I do. Let me introduce you to one of them. @hydrosam is probably the most likely expert here that I can think of.
Another solar generator on board! Welcome to the OVO online community, @philipH.
As @Blastoise186 mentions we’ve got a few fellow green energy generators here already who might be able too shed some more light on those graph anomalies.
Just gonna tag a few solar experts here - @EverythingNeedsAUserName, @PeterR1947, @malc_smith, @f0rtune, @JoeC, @hambrook - Any ideas on what might be consuming energy around that production peak?
That consumption peak (in red)is around the time of peak panel production (in blue) but not always and it often happens when there is no usage from the house. My only thought was that the SOLARiBoost which uses power from the panels/battery to heat water in the tank is kicking in and showing as consumption on the graph although it’s not consuming from the grid. look forward to hearing some thoughts on this
Seems to make sense to me that this is the Solar iBoost - the house is increasing it’s consumption to use up the solar energy so it’s not sent back to the grid? We have a battery that acts in a similar fashion!
That consumption peak (in red)is around the time of peak panel production (in blue) but not always and it often happens when there is no usage from the house. My only thought was that the SOLARiBoost which uses power from the panels/battery to heat water in the tank is kicking in and showing as consumption on the graph although it’s not consuming from the grid. look forward to hearing some thoughts on this
You could try turning off the Solariboost to see if the red bit goes away, that should confirm exactly what is causing it
The only surprise is that the boost only takes place later and not as soon as there is spare solar. You might want to check the iboost configuration as it seems like you’re wasting some of the your solar production at the moment. Could it be set to only come on after a certain time of day? Obviously also depends on when you’re consuming the hot water.
thank you also @JoeC . we have battery storage so the production from the panels is not wasted ,I hope. some days it doesn’t show any usage at all for the period we are talking about. Other days the consumption wave completely mirrors the blue production wave. most hot water is used evening washing up there is usually plenty of hot water to do that. if there is not enough hot water in tank by the morning you can see from the red consumption our water heating kicks in at 5 am
we have battery storage so the production from the panels is not wasted ,I hope. some days it doesn’t show any usage at all for the period we are talking about. Other days the consumption wave completely mirrors the blue production wave. most hot water is used evening washing up there is usually plenty of hot water to do that. if there is not enough hot water in tank by the morning you can see from the red consumption our water heating kicks in at 5 am
I wonder if the water is hot enough from the 5am boost that the solar isn’t needed until the afternoon. Predicting when you might get solar the next day will need some form of smart device to control that but I’m not sure there’s anything off the shelf. If you have a battery then the gains would be negligible so not one to worry about.
water heating comes on at 5am and tops up to heat level whatever hot water remains in tank. we then use showers around 6.30am. If we don’t have water heating on during winter there is not enough hot water from solar heating alone for the morning showers. In summer we don’t need this additional boost from the grid/boiler.