I have just read this passage about FACs in another thread: “… my own experience shows that [the future annual consumption figure] is being based on, (or at least being adjusted based on) actual meter readings. I could see my FAC for gas changing (reducing by large amounts) within minutes of submitting a new meter reading.”
This is what is supposed to happen, if I understand the wording here: Usage projection is a figure produced by our billing system, that uses smart meter readings (if available) to project the usage for you over the next year.
We clearly have a two-tier system: an ineffectual one for smart meter customers, and another better one for everyone else. Those who submit manual readings 'see their FAC changing within minutes.' Those of us with smart meters are apparently subject to a system which can take months to adjust the FAC to actual usage, despite having meter readings recorded automatically every day.
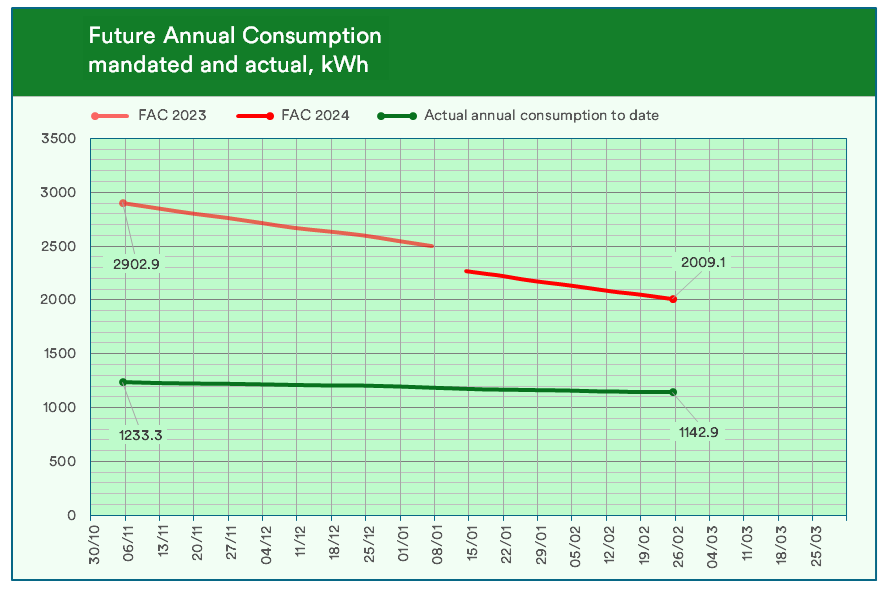
My own (electricity only) FAC got stuck last year after a meter adjustment. I was told last year, as was the Ombudsman, that it would all come right after a meter exchange, which happened in September. There was no change to my FAC until mid-November, when it suddenly started falling from its figure of 2.35 times the actual annual usage. This is how it has progressed, from its stubbornly-maintained figure of 2902.9 where it had been since the previous April:
I can't explain the hiatus in early January, unless there was some manual intervention. The figures are updated every Sunday, and occasionally midweek: there have been 16 updates since 5 November. If manual intervention is possible, then there’s no need to rely solely on this clearly flawed system.
I suppose I should be grateful that my FAC is now only 76% higher than my actual consumption for the past year. Excel tells me that if both curves proceed at the same rate, they will eventually meet on 8 August next, just one year after OVO assured the Ombudsman and me that a meter exchange would soon solve the problem.
For those of us with multi-rate tariffs (e.g. Economy 7), there have to be FAC figures for peak and offpeak usage. It’s the ratio between these that determines how economical the tariff is, so it’s also important that this ratio is also accurate. It’s not, for me. Not only is any Direct Debit calculation worthless, but so are projected costs when trying to compare tariffs.
There is something seriously wrong with the FAC determination if it can't adapt more quickly to actual, readily-available meter-confirmed data as Ofgem mandates and as Tim maintains it should.
Best answer by Firedog
Updated on 15/08/25 by Emmanuelle_OVO:
I’ve now (courtesy of @ChristopherS_OVO - thanks!) had some actual figures for the calculation of my FAC, and they’re as clear as an early-morning midstream sample. I learnt a few things, though:
The EAC is indeed allegedly updated to reflect data shared by the supplier. If that sharing fails for some reason - and it clearly did in my case - the EAC reverts to a default value, subsequently adjusted for whatever data have been successfully shared since the fault.
I can’t for the life of me work out where these default values come from. I’m told they are for a ‘typical E7 user’. So no attempt at all to take into account the factors that Uswitch and comparethemarket say are used to match the EAC to the user’s household [“central industry sources including the Retail Energy Code Company … estimate your consumption over the next 12 months based on a number of factors about your property and based on your property’s historical consumption.Your usage comparison is based on your energy usage compared to other households in your postcode region. Your usage will be affected by a number of factors including the size of your home and the number of people who live there.”]
Meter readings are thus used to adjust the EAC from its initial default value, but this can only happen of course if OVO successfully submit readings. This seems to be where the fault is in my case.
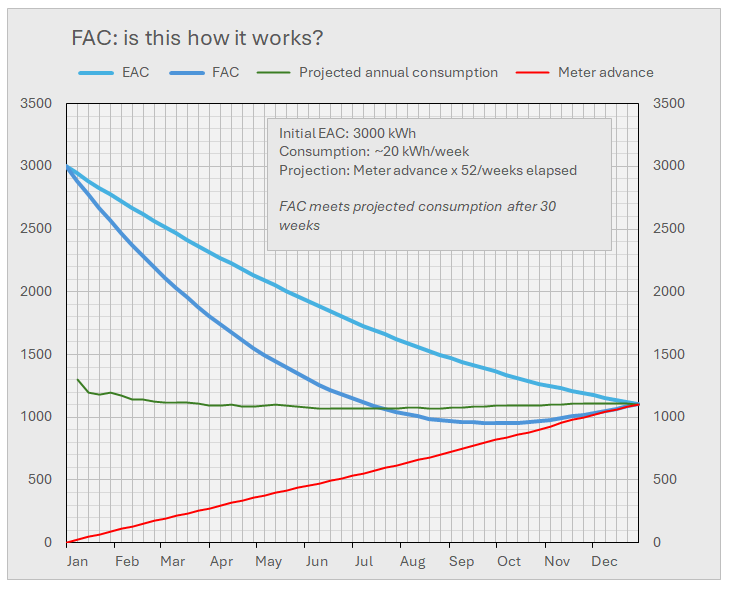
OVO then generates an FAC from the current reading and the current EAC, the proportions of each depending on the time elapsed since Week 0. By Week 52, the EAC proportion will be 0 and the meter advance 100%.
It’s impossible for me to work out how the EAC is adjusted when a reading is submitted, but I suspect it’s a similar arrangement.* This being the case, the FAC should approach parity with the meter advance before the year is up. How long before is a mystery, but it’s not likely to be nine months before.
I can see no reason why OVO can’t generate a more accurate FAC if it’s clear that the EAC is wrong. OK, this would involve manual intervention, which they understandably try to avoid. However, I’m sure it would have taken much less effort on their part just to do this rather than involve at least five different employees in trying (and failing) to explain why it went wrong for me in the first place.
[I just realized after reading this through, though, that this was the sort of approach Fujitsu took when faults appeared in bits of their Post Office Horizon system. I won’t draw any more parallels ...]
* If it were a similar arrangement (the EAC value changing pro rata with the meter advance over a fixed period), then we’d end up with a second-order function which would give a parabolic curve if the actual consumption was lower than expected. Something like this (I know how you all love my pretty charts 🙂):
[This case moved to a private conversation (thank you, @Emmanuelle_OVO), where I learnt that the FAC is calculated starting with the EAC and changing on each recalculation. The calculation aims to align the FAC with actual consumption after a year (!). However, there seemed to have been a problem with my account, so this wasn’t working quite as intended and some third-party data collector was investigating. I’ve heard nothing since.]
The chart I shared above shows a sudden step-change in January. I’m now leaning towards the view that it happened because the EAC my FAC started from was wrong. Ofgem sets these figures, drawing on all manner of statistical data to find typical values (TDCV). My EAC had been (in April 2023!) set to 2900 kWh, the typical electricity consumption of a dual-fuel household with medium usage. However, Ofgem revised their typical values down last year, the new ones to take effect on 1 October 2023. It looks as if someone realized in January that my FAC was still being based on the old TDCV and re-calculated it. The new TDCV was 2700*, which is the value the lower curve (‘FAC 2024’) strikes if produced back to the start date.
I’m bumping this thread in case anyone can explain why my FAC has today 21 April taken another lurch (to my detriment; if it were in my favour, I’d have kept quiet). This is a comparison of recent calculations, with the points from 14 January to 14 March removed because they all lie on the curves shown:
There is no change in my usage pattern to explain this sudden shift. It means that the estimated cost of the cheapest option on my Renewal page is £230 higher than what I expect it to be, and my recommended Direct Debit is 64% higher than I think it should be.
We have read in these forums that a new customer should see a reasonable FAC after three months, although some may have to wait for six months. I’ve no idea where these ideas come from. It is more than six months since my new meter was installed, yet there’s still no sign of light at the end of this tunnel. Whatever the formula used to calculate the FAC is, it’s wrong.
* 2700 kWh is the TDCV for a medium-usage household. A quick glance at my history would have revealed that my usage is consistently less than half of that, so I wonder why the low-usage figure (1800) wasn’t selected, if they couldn’t use the actual consumption figures for my MPAN.
@Firedog Your initial quote about sending new readings reducing the FAC was from a post of mine, and I’m sorry to report that that reduction in my FAC has now stopped happening again.
My FAC for gas is currently about 65% higher than my actual yearly usage and hasn’t altered by a single digit since 19th March. (Luckilly it isn’t really affecting me because I fixed my tariff).
However that lack of change could be because I got the Forum Support Team / Kazula investigating why (after I had got it downs to where it should be) it suddenly doubled overnight at the end of Feb, so they may have put a hold an any changes to it. I must give Forum Support a poke, I haven’t heard from them for a while.
My FAC for Smart Metered electricity is correct, and AFAIK always has been, it’s just my non-SM gas that has been all over the place (at the start of last December it was 3x too high).
From what I can see there are at least 2 different issues affecting/inflating FAC’s - whether those issues are originating at OVO, Kazula, or Ofgem is part of what needs to be investigated
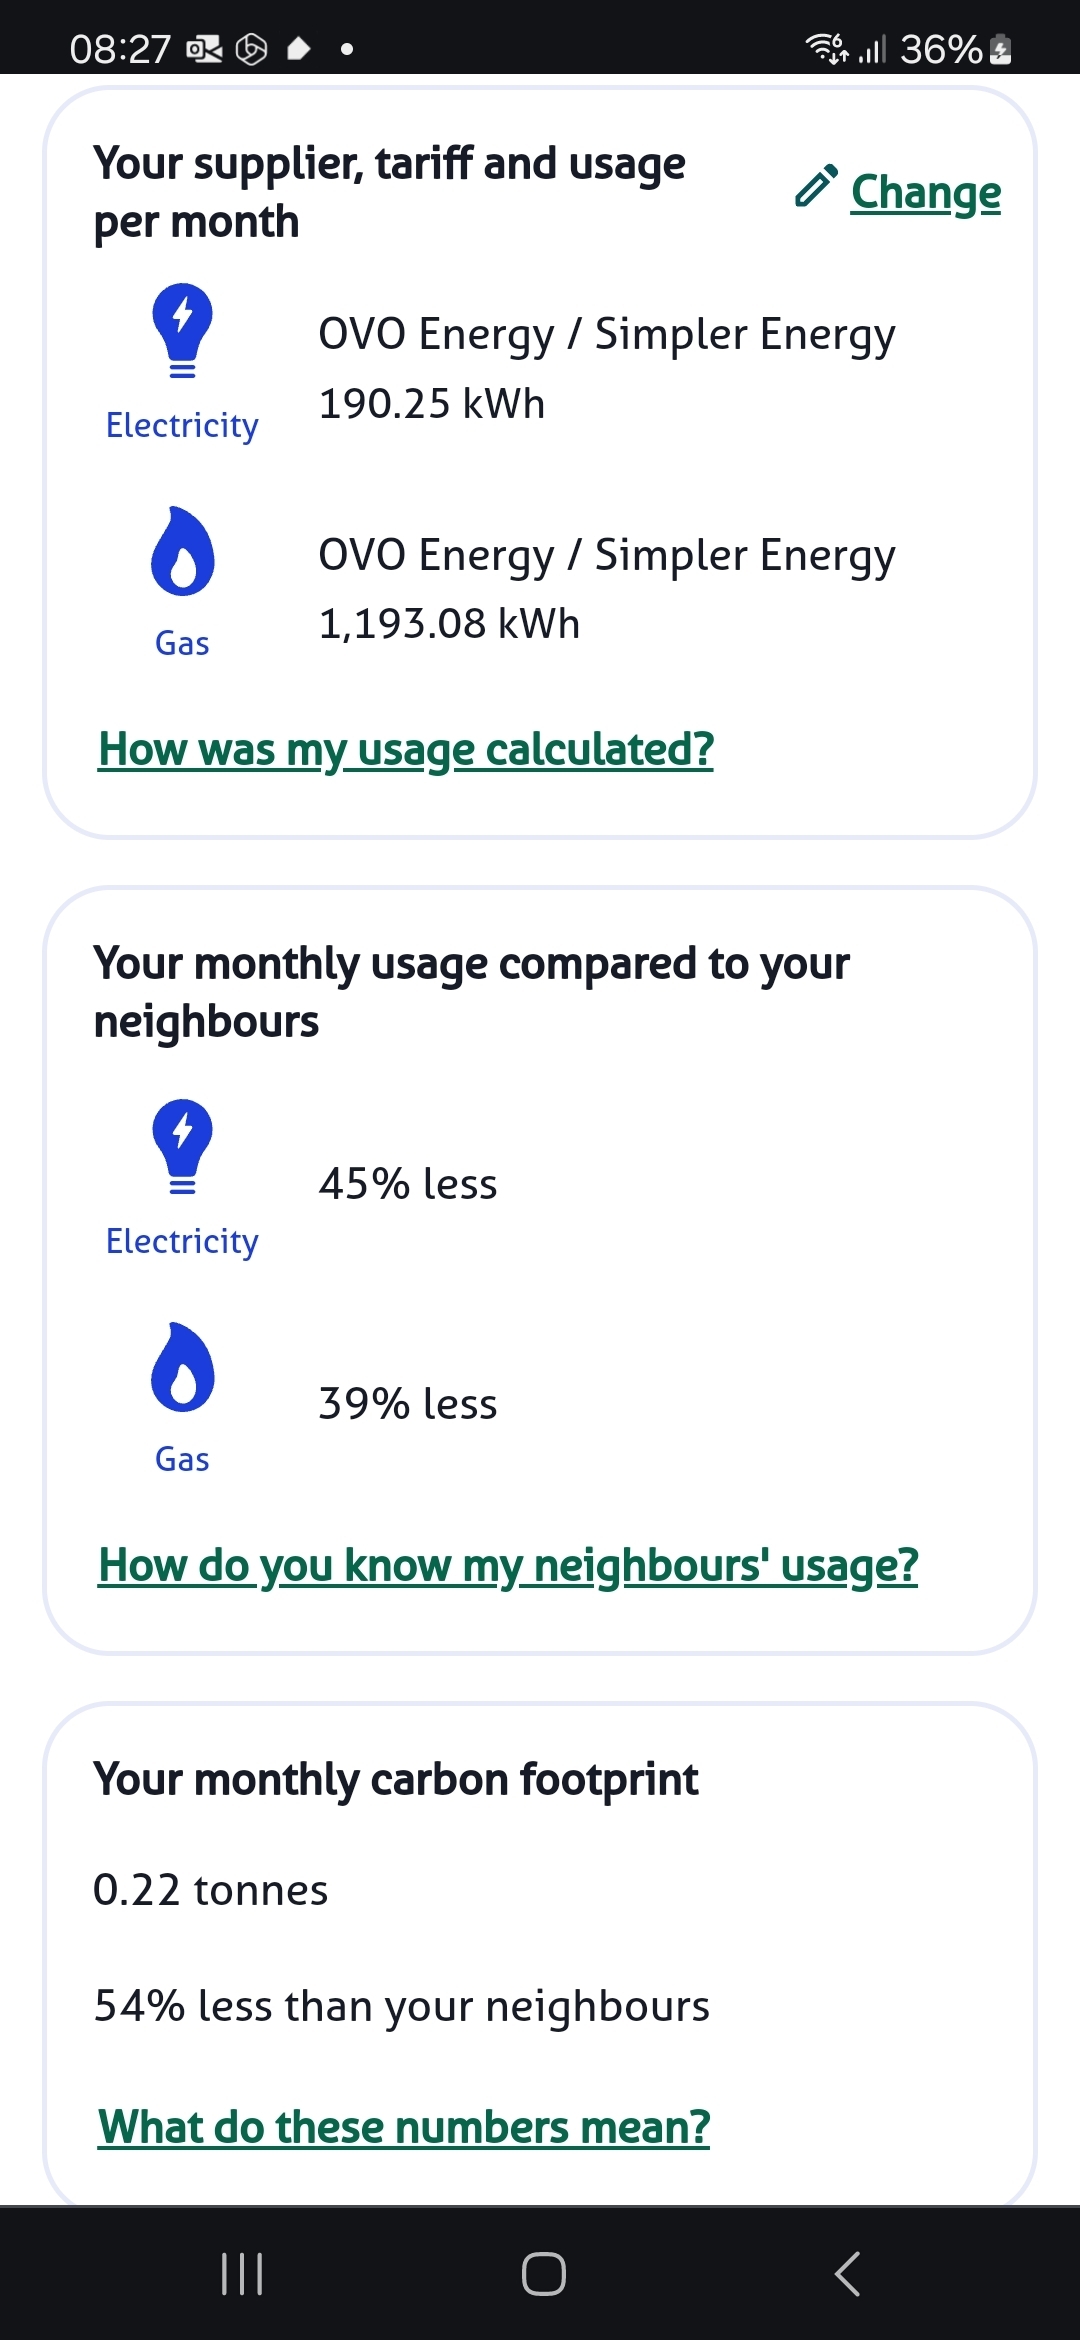
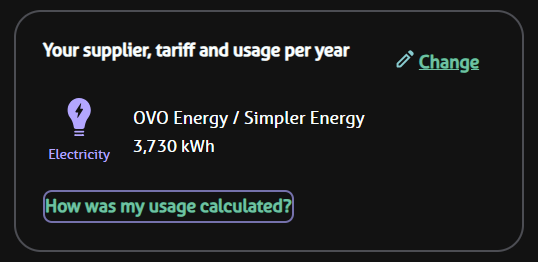
Be interesting to see what uswitch displays for your address as in theory they take un edited data from the national database when displaying the yearly gas and electricity usage kWh
One problem is that while we can work out, or try to work out, what the cause of any problems may be - before anything will change we have to get ‘someone’ at each of the companies involved interested in doing the same.
And if only a small percentage of customers are being affected then such issues don't get a priority to fix.
Be interesting to see what uswitch displays for your address …
I rather hoped they might be able to find something interesting, given this explanation of where the estimate comes from:
The estimated consumption figures are based on Estimated Annual Consumption (EAC) and Annual Quotient (AQ) data from central industry sources including the Retail Energy Code Company which estimate your consumption over the next 12 months based on a number of factors about your property and based on your property’s historical consumption.
Your usage comparison is based on your energy usage compared to other households in your postcode region. Your usage will be affected by a number of factors including the size of your home and the number of people who live there.
The figure Uswitch quote:
… is precisely the Ofgem TDCV for a low-usage PC2 household. There is clearly nothing else taken into account, in particular the ‘property’s historical consumption’.
I wonder if the leap in my FAC results from another oops! reaction, if someone realized that the baseline should not have been the 2700 it was changed to in January - the TDCV for a medium-usage PC1 household - but the 2200 Uswitch is now reporting. However, they probably couldn’t apply this from the same date (why?) and had to pick a new later starting date for the countdown.
I’d be repeating myself if I said that whatever the formula used to calculate the FAC is, it’s wrong.
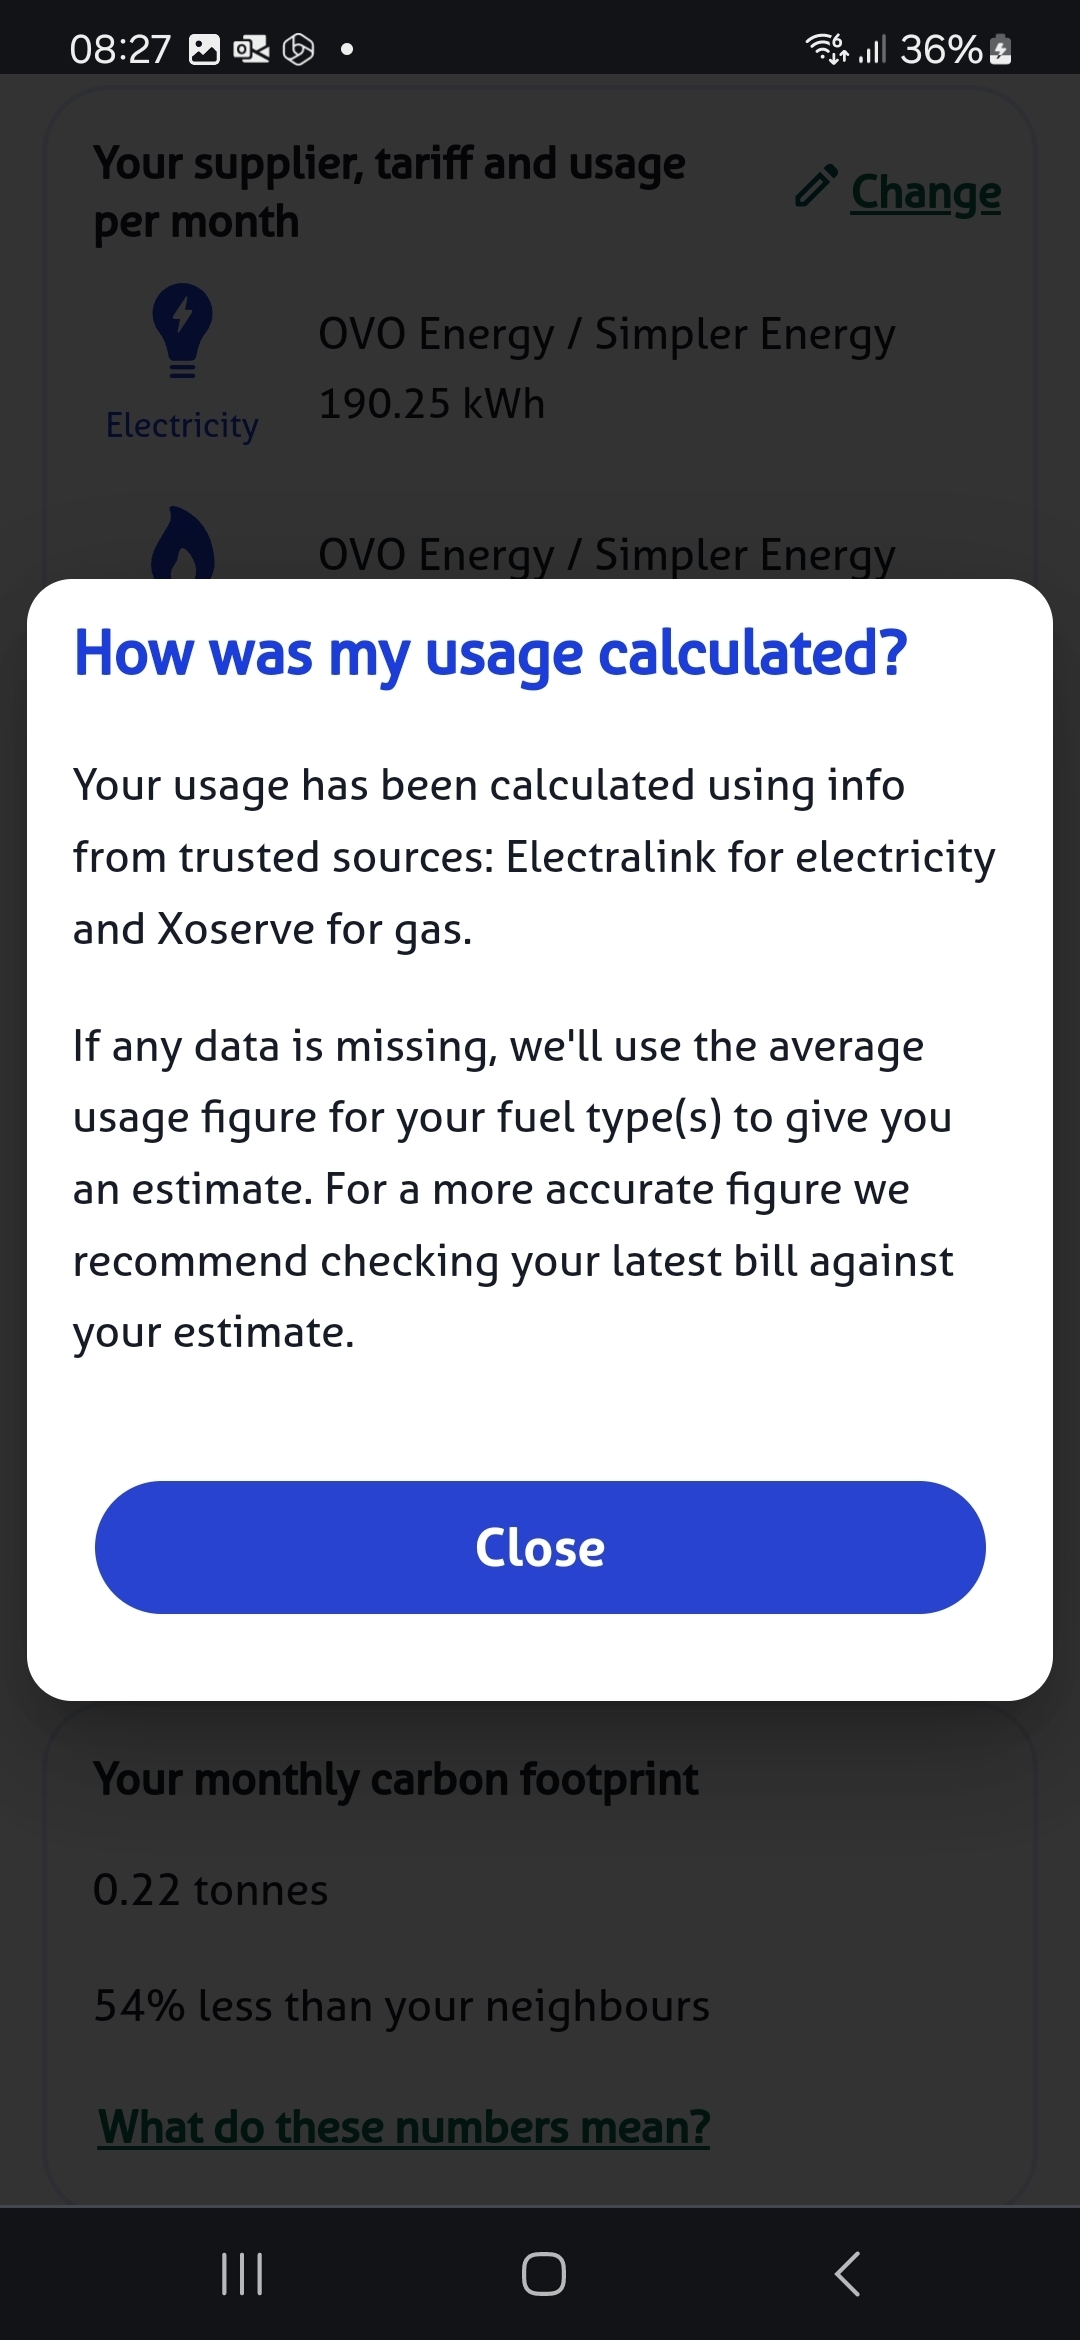
Then I wonder if there is something wrong with your data on the central database. Mine and one of my brothers looks OK on uswitch comparing with ovo. See the comment from comparethemarket below about missing data and using using averages if data is missing. I don't know how long the central database takes to populate for new meters. Perhaps someone else with a meter roughly the same age as yours could look.
And my recently deceased mum's house looks OK compared with her usage with Octopus.
There clearly is something taken into account for some people.
I just checked a couple of ovo households
One of my disabled brothers I keep an eye on now
Electricity
4269 kWh Ovo
4423 kWh uswitch
Gas
11051 kWh Ovo
11353 kWh Uswitch
Have also looked on comparethemarket
Me
Electricity
2273 kWh ovo
2282 kWh uswitch
2282 kWh comparethemarket
Gas
14111 kWh ovo
14317 kWh Uswitch
14317 kWh comparethemarket
I also checked a random selection in our road and none came up with the TDCV.
My checks were far from scientific but include different suppliers including ovo and manual and smart meter customers.
[This case moved to a private conversation (thank you, @Emmanuelle_OVO), where I learnt that the FAC is calculated starting with the EAC and changing on each recalculation. The calculation aims to align the FAC with actual consumption after a year (!). However, there seemed to have been a problem with my account, so this wasn’t working quite as intended and some third-party data collector was investigating. I’ve heard nothing since.]
The chart I shared above shows a sudden step-change in January. I’m now leaning towards the view that it happened because the EAC my FAC started from was wrong. Ofgem sets these figures, drawing on all manner of statistical data to find typical values (TDCV). My EAC had been (in April 2023!) set to 2900 kWh, the typical electricity consumption of a dual-fuel household with medium usage. However, Ofgem revised their typical values down last year, the new ones to take effect on 1 October 2023. It looks as if someone realized in January that my FAC was still being based on the old TDCV and re-calculated it. The new TDCV was 2700*, which is the value the lower curve (‘FAC 2024’) strikes if produced back to the start date.
I’m bumping this thread in case anyone can explain why my FAC has today 21 April taken another lurch (to my detriment; if it were in my favour, I’d have kept quiet). This is a comparison of recent calculations, with the points from 14 January to 14 March removed because they all lie on the curves shown:
There is no change in my usage pattern to explain this sudden shift. It means that the estimated cost of the cheapest option on my Renewal page is £230 higher than what I expect it to be, and my recommended Direct Debit is 64% higher than I think it should be.
We have read in these forums that a new customer should see a reasonable FAC after three months, although some may have to wait for six months. I’ve no idea where these ideas come from. It is more than six months since my new meter was installed, yet there’s still no sign of light at the end of this tunnel. Whatever the formula used to calculate the FAC is, it’s wrong.
* 2700 kWh is the TDCV for a medium-usage household. A quick glance at my history would have revealed that my usage is consistently less than half of that, so I wonder why the low-usage figure (1800) wasn’t selected, if they couldn’t use the actual consumption figures for my MPAN.
The 3 months was a figure provided by OVO on this forum.
The 6 months was observations from some ex SSE customers who we helped in the background who started off with high estimates for whatever reason after the migration.
It sounds like there is a different issue with your account and those timescales are perhaps not relevant.
Personally I am convinced that there is more than one error in play here, and the combined affects of 2 or more errors can make things even more confusing to identify the causes of each.
If the inflated FACs were affecting all OVOs customers then it would be a high priority to fix, and probably much easier to track down the cause.
However as it’s only affecting some customers then it’s not seen as being the same priority to be fixed, and also more difficult to find the error(s).
Some may be affected but not even realise that it’s their inflated FAC causing high estimates and high DD payment recommendations - until they get ridiculously high and they start looking at why. (and asking/complaining on the forum).
… the comment from comparethemarket below about missing data and using using averages if data is missing.
Thanks. I tried comparethemarket and found that the estimate they used was even further out than Uswitch’s:
Am not sure this is much help to you.
Of course it is! This all goes to show that - as the Cad points out - there’s probably more than one error in play here. If two trusted (!) companies manage to access the ‘central database’, albeit via different fourth parties, and get such wildly different responses, then something’s wrong with whoever is populating that database. Tim tells us that “… your EAC is re-calculated each time we share your meter readings with the energy industry,” so it looks like OVO aren’t sharing nicely and crystal balls are dusted off by the third- and fourth-parties trusted to access the database.
I honestly can’t imagine why my account should be so screwed up, and I’m a trifle concerned that there are many more of us in similar dire straits. Luckily I’m quite capable of doing my own sums, but I’m not looking forward to doing battle with the DD police in a few weeks’ time.
Perhaps the biggest frustration is not having anyone to ask who might actually be able to explain what’s going on.
A quick update: my FAC took another lurch on Sunday, this time downwards again. The total is again in line with earlier figures, waning slowly from 2700 in November towards the actual usage of around 1050 in mid-August. Here are the last four FACs:
FAC
Peak
Offpeak
Total
07/04
1161.8
604.2
1766.0
14/04
1147.0
582.5
1729.5
21/04
1562.9
434.0
1996.6
28/04
1306.4
313.7
1620.1
I wish I knew what they were up to (1766 > 1730 > 1997 > 1620?); it’s clear that the formula I was given isn’t being applied. At least my annual projected energy cost is currently only overestimated by 27%, because half of mine is the standing charge which the FAC luckily can’t mess with.
I know this has been an ongoing issue for some time now so I have raised this internally so we can try and better understand what is causing this for you. Would you both mind dropping me a message with your account numbers so that I have them to hand?
I will work on trying to get more information for you 🙂
I’m well aware that multi-rate accounts are a pain in this respect; I read somewhere that their FACs are only updated weekly (as opposed to daily?), and that ties in with my experience (a new FAC every Sunday) apart from a few outliers. The problem is that the normal adjustment {[time from start x meter advance from start] + [EAC x (one year - time from start)]} has to be done for each register if it’s to make any sense at all. I think the latest adjustments have been done on my account to try and compensate for this, by keeping the overall FAC in line with the target while setting the offpeak figure at a more reasonable level at the expense of the peak one.
I’m sure it’s possible to devise a more equitable system!
@Firedog I also mentioned your particular yo-yo’ing FAC to the Forum Support who are (supposedly) looking into the issue of inflated/balloning FACs for me by PMs.
@ChristopherS_OVO as I say there I’m already talking by PM to Forum Support about these FAC issues, they already have my account details. PS. My own FAC is now reasonable, but it has been vastly inflated in the past, and it has also made sudden jumps (doubling at the end of February) in the past - I am not multi-rate, I’m currently on the Fixed Loyalty tariff since December.
I’ve now (courtesy of @ChristopherS_OVO - thanks!) had some actual figures for the calculation of my FAC, and they’re as clear as an early-morning midstream sample. I learnt a few things, though:
The EAC is indeed allegedly updated to reflect data shared by the supplier. If that sharing fails for some reason - and it clearly did in my case - the EAC reverts to a default value, subsequently adjusted for whatever data have been successfully shared since the fault.
I can’t for the life of me work out where these default values come from. I’m told they are for a ‘typical E7 user’. So no attempt at all to take into account the factors that Uswitch and comparethemarket say are used to match the EAC to the user’s household [“central industry sources including the Retail Energy Code Company … estimate your consumption over the next 12 months based on a number of factors about your property and based on your property’s historical consumption.Your usage comparison is based on your energy usage compared to other households in your postcode region. Your usage will be affected by a number of factors including the size of your home and the number of people who live there.”]
Meter readings are thus used to adjust the EAC from its initial default value, but this can only happen of course if OVO successfully submit readings. This seems to be where the fault is in my case.
OVO then generates an FAC from the current reading and the current EAC, the proportions of each depending on the time elapsed since Week 0. By Week 52, the EAC proportion will be 0 and the meter advance 100%.
It’s impossible for me to work out how the EAC is adjusted when a reading is submitted, but I suspect it’s a similar arrangement.* This being the case, the FAC should approach parity with the meter advance before the year is up. How long before is a mystery, but it’s not likely to be nine months before.
I can see no reason why OVO can’t generate a more accurate FAC if it’s clear that the EAC is wrong. OK, this would involve manual intervention, which they understandably try to avoid. However, I’m sure it would have taken much less effort on their part just to do this rather than involve at least five different employees in trying (and failing) to explain why it went wrong for me in the first place.
[I just realized after reading this through, though, that this was the sort of approach Fujitsu took when faults appeared in bits of their Post Office Horizon system. I won’t draw any more parallels ...]
* If it were a similar arrangement (the EAC value changing pro rata with the meter advance over a fixed period), then we’d end up with a second-order function which would give a parabolic curve if the actual consumption was lower than expected. Something like this (I know how you all love my pretty charts 🙂):
I’m glad you have had the opportunity to review the data and that it has helped you understand the calculations a little better.
The only thing I would add is the part that you mentioned about manual intervention. I’ve asked about this and the team have petitioned this with Kaluza but it currently isn’t something they can intervene with. They are aware of the need to try and address this when we know there is an imbalance in the calculations. There are some occasions where the imbalance is necessary such as a meter exchange as the system would in a way treat this as a “fresh start” but you would typically see things like your DD fall naturally over time with the new readings scheduled.
Thank you for sharing your thoughts and findings with the new data 🙂
As I see it the problem with making manual interventions is that the automatic system would probably just put them back to being wrong again the next time it ran. So it would end up in an ongoing person vs machine battle to keep things right.
My own conversations with Forum Support so far tend to agree that there is something out of kilter with the EAC and AQ calculations ‘further down the line’ at Kazula or Xoserve (for gas). Personally I suspect that such calcuation glitches for certain circumstances may be pretty long standing but didn’t previously show up the same in traditional billing as it now does with OVO’s live billing.
PS. I haven’t reported here on the forum much of my converstaion with FS, partly because there is nothing conclusive (as yet), and partly because I wanted to concentrate on the DD calculator here on the forum without confusing the two issues any further than they already are/were. I say were because the DD calculator at the moment seems to have been tweaked and to be working OK for Fixed Tariffs, so hopefully that’s also the same for Variable Tariffs, and hopefully meaning that any oddities left in there now are probably due to FACs.
As I see it the problem with making manual interventions is that the automatic system would probably just put them back to being wrong again the next time it ran.
You’re quite right, of course. However, it’s a strange ‘automated’ system that can take leaps like my 1766 > 1730 > 1997 > 1620. I suppose someone might have found some numbers down the back of the sofa.
… the DD calculator at the moment seems to have been tweaked and to be working OK for Fixed Tariffs, so hopefully that’s also the same for Variable Tariffs, ...
FWIW the calculator has always worked as designed for me on the SVT. They’re not complicated calculations, so there’s no reason why it shouldn’t work smoothly. But the fundamental significance of the FAC can make a mockery of the system when it’s out of kilter for whatever reason. I wonder if the support staff see exactly the same results in their dashboard as we see on the web - perhaps @ChristopherS_OVO could ask?
Your recent experience of seeing two different outcomes at the same time would suggest a caching delay, as if one bit had caught up before the other. I’ve seen similar oddities in other parts of this (bafflingly complex) site, that have magically come right after a few hours or days. Moral: when something looks really strange, come back a bit later and look again.
I have now had a further PM reply from Forum Support in which they say that it's the industry AQ that still has a too high figure for my actual usage, and it's that which is causing the spikes in my FAC for gas.
They further state that because of that too high industry AQ it could spike again in future, which I interpret as meaning whenever that incorrect AQ gets fed into the calculations again it will cause another spike in the FAC. (They suggest that sending more frequent readings may help, however we already know that it does help lower the FAC but only until the next spike).
However they have finally identified why my own industry AQ has been consistently too high. Apparently Xoserve have the wrong MSN listed for me. So any readings sent for my actual meter are not getting to the MSN listed at Xoserve, and so not being used when (re)calculating my AQ. Presumably the MSN that Xoserve have listed is for the new gas meter that was supposed to be fitted in my failed meter exchange last May, but never was fitted.
Support say that they have now raised a ticket to get my MSN corrected at Xoserve.
@Firedog As your issue also appears to involve a (electricity) meter exchange then if you haven’t already you may want to check whether Elexon have your MSN correct for your electricity meter.
I’ve been thinking more about that incorrect gas meter MSN and what should happen in that situation.
if the issue in my particular case is solely that Xoserve have the wrong MSN and so are just using the 'industry standard' usage figure for the AQ then that still doesn't explain why my FAC for gas climbed to over 31,000 kWh last December. That's way higher than the Ofgem average 7,500 kWh gas for a 1 bedroom flat.
For that reason alone I still suspect that there is something more in play here than just that incorrect MSN.
(Of course Forum Support are happy that they have found ‘something’ concrete to hang an explanation on - whether it’s the full explanation or not).
So I'll still be watching to see what happens once the MSN has been corrected.
Apparently Xoserve have the wrong MSN listed for me.
I’m surprised that this isn’t one of the first things to be checked when there’s an inconsistency involving submitting and retrieving data from an external database.
As your issue also appears to involve a (electricity) meter exchange then if you haven’t already you may want to check whether Elexon have your MSN correct for your electricity meter.
I was told that there was at some stage a ‘validation failure’, so the third-party data collector concerned was asked to investigate and resolve the error. That was on 1 March …
Apparently Xoserve have the wrong MSN listed for me.
I’m surprised that this isn’t one of the first things to be checked when there’s an inconsistency involving submitting and retrieving data from an external database.
I was also pretty surprised myself.
Particularly as I had made two previous complaints to OVO about them having the wrong MSN showing on my account following the failed exchange, the first in July 2023 when they corrected it, then I had to complain again in November 2023 because someone had ‘helpfully’ put it back to the incorrect one. (So I do in fact know both MSN’s involved, the correct one and the ‘never fitted’ one).
It appears that although OVO had finally got the correct one on my account they hadn’t informed Xoserve of the error.
Silly me for expecting them to do the job properly I suppose.
A couple of weeks ago, wondering why my FAC started from such a high value, I wrote “2700 kWh is the TDCV for a medium-usage household. A quick glance at my history would have revealed that my usage is consistently less than half of that, so I wonder why the low-usage figure (1800) wasn’t selected, if they couldn’t use the actual consumption figures for my MPAN.”
Since then, Christopher remarked: ‘… when we know there is an imbalance in the calculations ... There are some occasions where the imbalance is necessary such as a meter exchange as the system would in a way treat this as a “fresh start”.’
Yesterday, wondering why my DD calculation can’t be put right, I read in OVO’s own help article that “If you’re new to OVO, [fresh start?] we work out your Direct Debit amount to cover your expected energy use over the next 12 months. We base it on your past year’s energy use if you know it.”
I know it and I knew it down to the nearest 0.001kWh, yet nobody asked and no-one will listen when I point this out. This is gross discrimination against existing loyal customers as opposed to new ones.
I don’t have a comment sadly as we’re here to moderate the Forum and create content. I’d suggest if you still aren’t happy with the way the FAC is calculated that you follow the complaint process and raise it as a complaint that can be investigated through the correct channels. You can find our Complaint Handling Statement here, https://bit.ly/3DcsZdj, along with more information on our complaints process here: https://www.ovoenergy.com/feedback.
I’m sorry there isn’t more we can do to help you here!


")