Is anyone make sense of their progress % shown on the Power Move dashboard (on the OVO app) since 1/3/25? I keep a spreadsheet which has more or less agreed with the dashboard in the past but this month it’s quite a bit out.
Also, does anyone know when the % that’s updated on a Monday after 8pm, is that the % upto midnight on the day before?
Thank you
Best answer by Chris_OVO
Hey all,
Just to answer a couple of points raised in the thread so far:
@Nukecad is correct that the app currently reports progress weekly, and the team would like to provide daily updates in the future. This relates to @Firedog’s point about delays in data retrieval. Since the industry switched to half-hourly settlements, the team has been retrieving data later in the day to minimize non-communication issues due to missing data and reduce the overall system burden. They may push data retrieval back even further in the future, but for now, they are working with the current setup.
According to my spreadsheet I was 6.07 after Friday, and of course lower since because the weekend is all off-peak.
I had noticed last month that the % figure shown on the app always seemd to be from days ago. TBH I haven’t been looking at the app daily and recording what it says.
According to my spreadsheet I was 6.07 after Friday, and of course lower since because the weekend is all off-peak.
I had noticed last month that the % figure shown on the app always seemd to be from days ago. TBH I haven’t been looking at the app daily and recording what it says.
I‘m finding similar - shows 8.28% on app and my spreadsheet shows 8.27% up to Friday
For the past few weeks, I’ve noticed that on most days, my usage data and meter readings are arriving much later than I’m used to. There’s perhaps one day a week when they arrive before lunch, but on all the others it’s after 8pm and once or twice even after midnight, so more than 24 hours after the event. In the good old days, I could rely on my data turning up before I signed in each morning, but sadly no longer. Has anyone else noticed unexpected delays in data retrieval recently?
Looks as though the dash board has been up dated as it now shows that the % is from 1 - 9 March.
Well that’s 9 days which woulld seem odd.
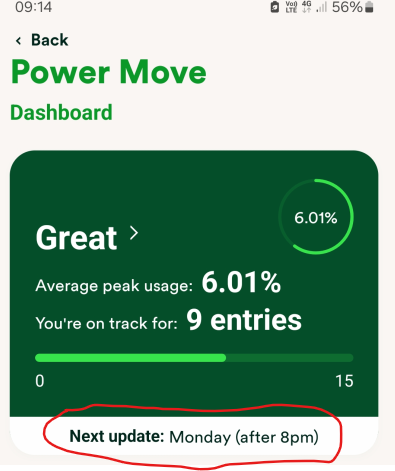
Mine isn’t showing dates but it has changed since this morning to now show 6% ie without the ‘.01’ That tiny change also means that it’s now showing 10 entries. As I said above it was last Friday when I was at approx 6%. (On my own spreadsheet I currently have 4.4% for my up-to-date figure to midnight last night).
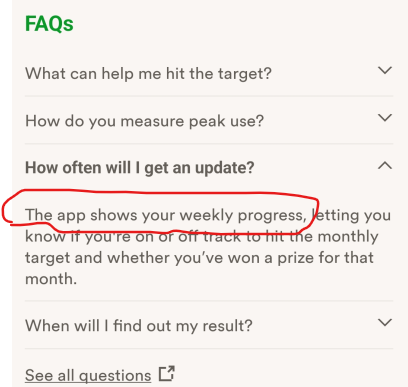
Looking in the drop down FAQ’s it does say that the app shows WEEKLY progress.
So as Friday when my spreadsheet says 6.07% was the 7th then that would seem right, with the next update being for the 14th but not being shown until next Monday.
Of course I am aware that PM in the app is still somewhat a work in progress, and the PM team are constantly looking to improve it, so what the app is showing may be different altogether next week.
For the past few weeks, I’ve noticed that on most days, my usage data and meter readings are arriving much later than I’m used to. ……. Has anyone else noticed unexpected delays in data retrieval recently?
Yes I have, some days much later than others.
There again I’ve noticed similar happen every quarter recently, when the Standard Variable Tariff rates and SCs are changing.
It’s as if work on changing things for the new Ofgem rates slows down everything else. Not sure if that’s at DCC, at OVO, or maybe a combination of both.
Just to answer a couple of points raised in the thread so far:
@Nukecad is correct that the app currently reports progress weekly, and the team would like to provide daily updates in the future. This relates to @Firedog’s point about delays in data retrieval. Since the industry switched to half-hourly settlements, the team has been retrieving data later in the day to minimize non-communication issues due to missing data and reduce the overall system burden. They may push data retrieval back even further in the future, but for now, they are working with the current setup.
[Apologies to @mcdermoc17for diverting his thread off-course 🙏]
Chris_OVO wrote:
… delays in data retrieval. Since the industry switched to half-hourly settlements, the team has been retrieving data later in the day to minimize non-communication issues due to missing data and reduce the overall system burden.
Sorry, @Chris_OVO - which team are you referring to?
I can understand that the introduction of MHHS might affect (read: delay) the flow of half-hourly data through the smart meter network, and I suppose your remark means that the PM people are making allowances. However, I don’t see why the retrieval of meter readings should be affected. Yesterday’s readings (for 2025-03-13 00:00:00) still hadn’t arrived when I checked at 00:55 this morning, nearly 25 hours later.
I think that I've now worked out just what the app is showing us for Power Move progress.
It's the percentage figure as it stood at the end of the Previous Friday.
This is mine this morning:
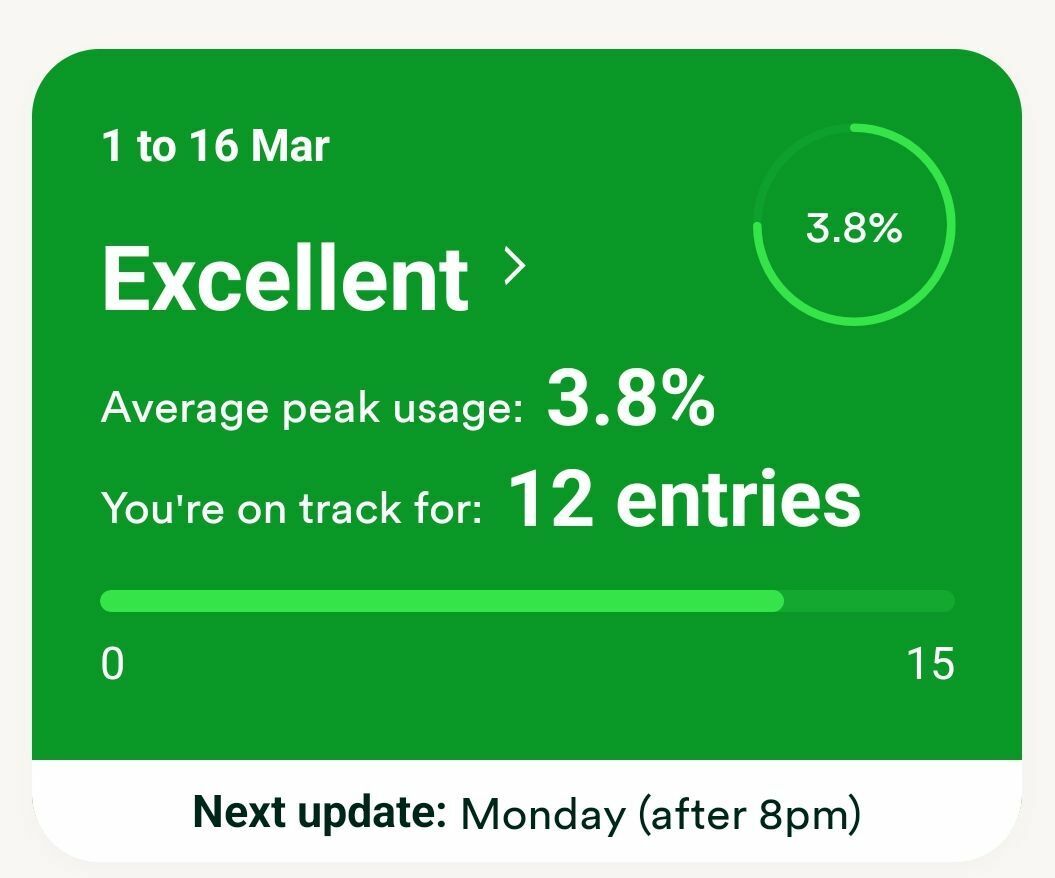
1 to 16 Mar - Thats inclusive, ie. the begining of the month to the end of the second Sunday. They say that PM updates run Monday-Monday, March just happened to start on a Saturday.
3.8% - That was my percentage at the end of Friday 14th, the last working day of last week. (My spreadsheet says it was 3.86%) So despite it saying 1 to 16 Mar this weekends usage (15th & 16th) isn't included yet.
12 entries - As advertised for “3.01 to 4%”.
Next update: Monday (after 8pm) - They say PM runs Monday to Monday. Although mine has already updated for last weeks usage - so not “after 8pm” unless they are going to add in this weekends usage later today?. Maybe they update at different times for different people and everyone should be updated by 8pm at the latest? (I’m not sure exactly when mine changed from the previous Fridays 6% to it’s current 3.8%, other than that it was sometime between last Thursday and this morning).
So at the moment if you want to watch your progress daily rather weekly then you will still have to do your own spreadsheet.
I agree with you. My app agrees with my spreadsheet as of close of play Friday 14th too. It'll be interesting to see if it updates again this evening.
I'm still puzzled as to why the app and my spreadsheet didn't agree last Monday but at least the latest figures make sense. (I did triple check my spreadsheet).
I am completely confused, I used an average of 4.4% between 5pm - 7pm last month and received 11 entries into the prise draw 🙄, but also won: £2 energy credit, was this by chance or just to stop me from complaining 🤔.
I agree, the figure on Monday appears to be as at Friday.
And yes, I also “won” 2 quid.
Is anyone make sense of their progress % shown on the Power Move dashboard (on the OVO app) since 1/3/25? I keep a spreadsheet which has more or less agreed with the dashboard in the past but this month it’s quite a bit out.
Also, does anyone know when the % that’s updated on a Monday after 8pm, is that the % upto midnight on the day before?
Thank you
Page 1 / 1
Mine on the app currently shows as being 6.01%.
According to my spreadsheet I was 6.07 after Friday, and of course lower since because the weekend is all off-peak.
I had noticed last month that the % figure shown on the app always seemd to be from days ago. TBH I haven’t been looking at the app daily and recording what it says.
Nukecad wrote:
Mine on the app currently shows as being 6.01%.
According to my spreadsheet I was 6.07 after Friday, and of course lower since because the weekend is all off-peak.
I had noticed last month that the % figure shown on the app always seemd to be from days ago. TBH I haven’t been looking at the app daily and recording what it says.
I‘m finding similar - shows 8.28% on app and my spreadsheet shows 8.27% up to Friday
People are worrying about a 0.01% difference? Really???
Will R wrote:
People are worrying about a 0.01% difference? Really???
I’m not worried at all - just saying it looks like the app is showing progress up to last Friday
Will R wrote:
People are worrying about a 0.01% difference? Really???
It’s not worrying, it’s being precise.
As said nobody is bothered about the slight difference, we are simply trying to work out just when the % figure show in the app refers to.
It appears that it’s being updated each Monday evening to show your PM % as it was at the end of Friday.
For the past few weeks, I’ve noticed that on most days, my usage data and meter readings are arriving much later than I’m used to. There’s perhaps one day a week when they arrive before lunch, but on all the others it’s after 8pm and once or twice even after midnight, so more than 24 hours after the event. In the good old days, I could rely on my data turning up before I signed in each morning, but sadly no longer. Has anyone else noticed unexpected delays in data retrieval recently?
Looks as though the dash board has been up dated as it now shows that the % is from 1 - 9 March.
mcdermoc17 wrote:
Looks as though the dash board has been up dated as it now shows that the % is from 1 - 9 March.
Well that’s 9 days which woulld seem odd.
Mine isn’t showing dates but it has changed since this morning to now show 6% ie without the ‘.01’ That tiny change also means that it’s now showing 10 entries. As I said above it was last Friday when I was at approx 6%. (On my own spreadsheet I currently have 4.4% for my up-to-date figure to midnight last night).
Looking in the drop down FAQ’s it does say that the app shows WEEKLY progress.
So as Friday when my spreadsheet says 6.07% was the 7th then that would seem right, with the next update being for the 14th but not being shown until next Monday.
Of course I am aware that PM in the app is still somewhat a work in progress, and the PM team are constantly looking to improve it, so what the app is showing may be different altogether next week.
Firedog wrote:
For the past few weeks, I’ve noticed that on most days, my usage data and meter readings are arriving much later than I’m used to. ……. Has anyone else noticed unexpected delays in data retrieval recently?
Yes I have, some days much later than others.
There again I’ve noticed similar happen every quarter recently, when the Standard Variable Tariff rates and SCs are changing.
It’s as if work on changing things for the new Ofgem rates slows down everything else. Not sure if that’s at DCC, at OVO, or maybe a combination of both.
Hey all,
Just to answer a couple of points raised in the thread so far:
@Nukecad is correct that the app currently reports progress weekly, and the team would like to provide daily updates in the future. This relates to @Firedog’s point about delays in data retrieval. Since the industry switched to half-hourly settlements, the team has been retrieving data later in the day to minimize non-communication issues due to missing data and reduce the overall system burden. They may push data retrieval back even further in the future, but for now, they are working with the current setup.
[Apologies to @mcdermoc17for diverting his thread off-course]
Chris_OVO wrote:
… delays in data retrieval. Since the industry switched to half-hourly settlements, the team has been retrieving data later in the day to minimize non-communication issues due to missing data and reduce the overall system burden.
Sorry, @Chris_OVO - which team are you referring to?
I can understand that the introduction of MHHS might affect (read: delay) the flow of half-hourly data through the smart meter network, and I suppose your remark means that the PM people are making allowances. However, I don’t see why the retrieval of meter readings should be affected. Yesterday’s readings (for 2025-03-13 00:00:00) still hadn’t arrived when I checked at 00:55 this morning, nearly 25 hours later.
I think that I've now worked out just what the app is showing us for Power Move progress.
It's the percentage figure as it stood at the end of the Previous Friday.
This is mine this morning:
1 to 16 Mar - Thats inclusive, ie. the begining of the month to the end of the second Sunday. They say that PM updates run Monday-Monday, March just happened to start on a Saturday.
3.8% - That was my percentage at the end of Friday 14th, the last working day of last week. (My spreadsheet says it was 3.86%) So despite it saying 1 to 16 Mar this weekends usage (15th & 16th) isn't included yet.
12 entries - As advertised for “3.01 to 4%”.
Next update: Monday (after 8pm) - They say PM runs Monday to Monday. Although mine has already updated for last weeks usage - so not “after 8pm” unless they are going to add in this weekends usage later today?. Maybe they update at different times for different people and everyone should be updated by 8pm at the latest? (I’m not sure exactly when mine changed from the previous Fridays 6% to it’s current 3.8%, other than that it was sometime between last Thursday and this morning).
So at the moment if you want to watch your progress daily rather weekly then you will still have to do your own spreadsheet.
Thank you.
I agree with you. My app agrees with my spreadsheet as of close of play Friday 14th too. It'll be interesting to see if it updates again this evening.
I'm still puzzled as to why the app and my spreadsheet didn't agree last Monday but at least the latest figures make sense. (I did triple check my spreadsheet).
Hi All,
I am completely confused, I used an average of 4.4% between 5pm - 7pm last month and received 11 entries into the prise draw , but also won: £2 energy credit, was this by chance or just to stop me from complaining .
It’s interesting that we haven’t heard here from anyone who didn’t win £2 in the draw. (Unless I missed it).
We have heard from some who got the £10 for managing under 2%.
I had thought we would see a few shouts for anyone who hadn’t won anything in the draw.
(Maybe everyone won at least £2 - if so then that would tell you something about how many are currently taking part in Power Move).
I agree, the figure on Monday appears to be as at Friday.


 ]
] , but also won: £2 energy credit, was this by chance or just to stop me from complaining
  .
.