Open LV Trial - Making local substation data available to community groups


Userlevel 7
Badge +2

.OpenLV is a ground-breaking project that’s making local electricity data openly available for the first time ever, to benefit local communities and the wider energy industry. OpenLV is led by project partners Western Power Distribution and EA Technology. It is funded by Ofgem’s Network Innovation Competition. Project partner CSE is leading the community engagement, to support communities to access their local electricity data for local benefit. Regen is leading the evaluation of community groups taking part in OpenLV.

The OpenLV Project is trialling an open software platform in electricity substations that can monitor substation performance and electricity demand. The LV-CAP (TM) platform is designed to integrate with third party products to enable network control and automation, and increased customer participation in network management. The platform will host applications provided by a diverse set of developers, such as community groups, businesses and universities, providing a variety of services to network operators, communities and the wider industry.

As part of the OpenLV project, the software will be installed in 80 Low Voltage (LV) distribution substations located in Western Power Distribution’s (WPD’s)
licence areas – the Midlands, the South West and South Wales.


46a1b19d-7172-4650-ae5e-70e3a084c7ce.jpg


Western Power Distribution covers areas with heavy industrial demand and high population density, such as the Midlands, Avonmouth and areas of South Wales. It also embraces rural regions with sparse populations such as mid-Wales, and others with high proportions of renewable energy, as in Devon and Cornwall. Balancing the grid-loading is becoming increasingly difficult, whilst upgrading the substations is prohibitively expensive.

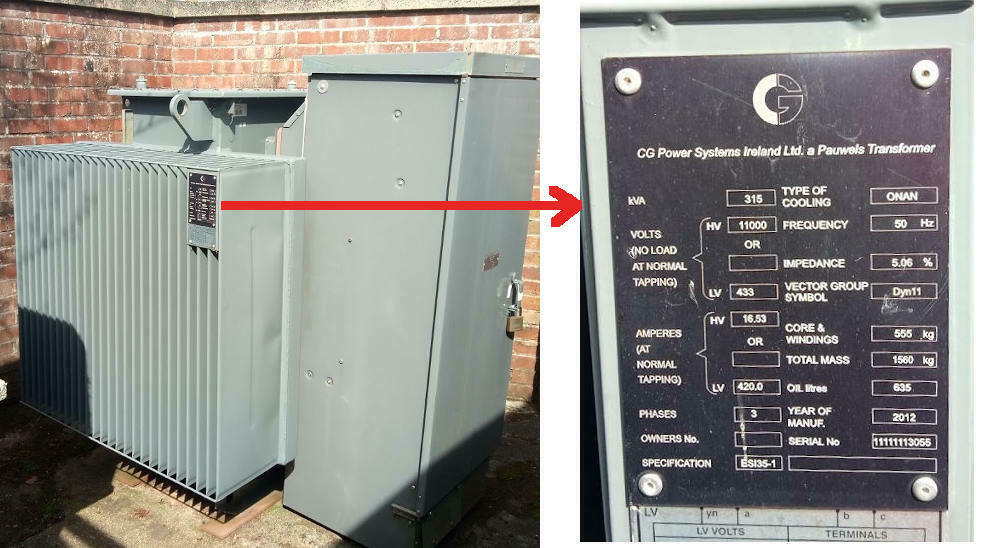
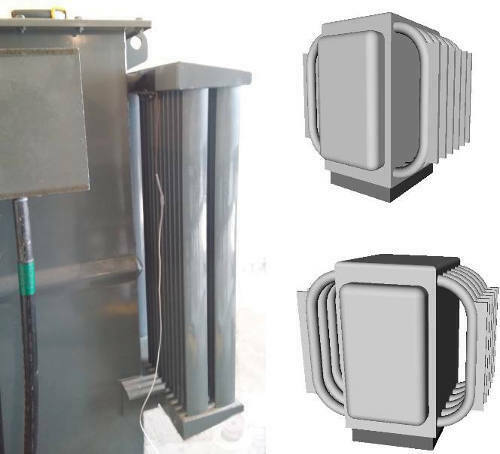
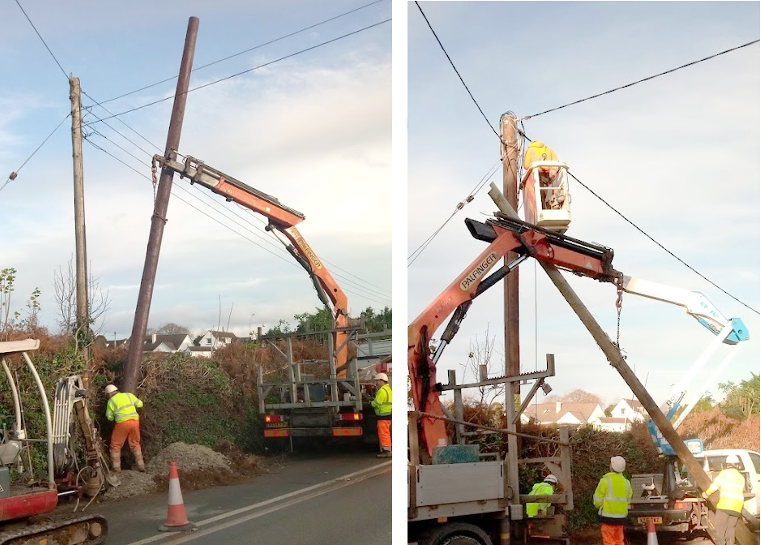
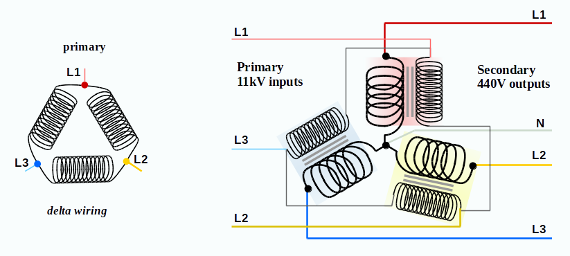
Great Britain has about 1 Million Low Voltage (LV=230/440v) feeders from 230,000 ground-based substations and a further 320,000 pole-mounted transformers. These have largely been designed and operated on a fit-and-forget basis for the last 100 years, but this cannot continue. The LV networks are expected to see radical change as we, the customers, alter our behavior and requirements stemming from the vehicles we drive, to the generation and storage devices we put onto and into our homes.


f9918a88-0af4-46f9-bc0d-2c9d00a35204.jpg


Many rural substations serve a very small number of homes, whilst in built up areas a single substation may serve hundreds. Larger consumers, such as tower-blocks, schools or hospitals, will often have their own substation.

The LV-CAP software could ultimately be deployed across the electricity network. The project will use three approaches to demonstrate the platform’s ability to provide benefits to the network owner, customers, and service providers. The OpenLV project could potentially enable data to be presented on websites and through phone apps which will help people to get to grips with things like:


  • Get to know my substation
  • Reducing costs of community energy
  • Influencing community demand for electricity
  • Electricity generation across a community
  • Demand-side response for managed EV charging
  • Community information alerts


The Community Trials commence on 3rd Sept 2018 and will last 9 months, followed by reporting and evaluation stages. Seven Community Trial sites are being coordinated by the Centre for Sustainable Energy (CSE) in Bristol. Of the total eighty substations sites in the Project, ten are designated for the Community Trial.

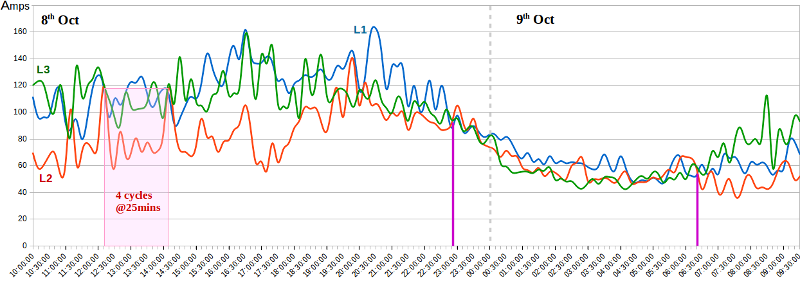
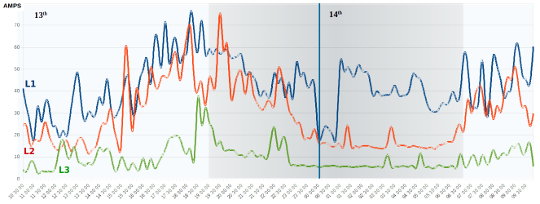
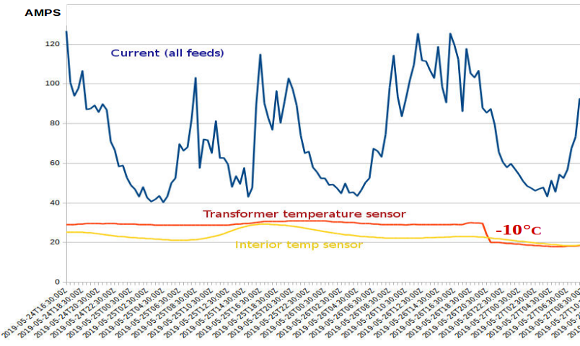
The OpenLV strategy will open up the usage-data from sub-stations, allowing us to see fluctuations in energy supply. We don't yet know whether grid-loading varies wildly, with large/rapid peaks and troughs, or smoothly, whereby peak-usage gradually increases and falls.

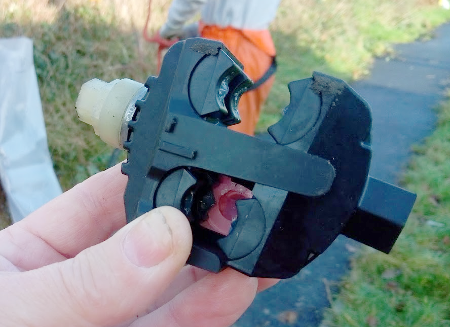
The Intelligent Substation Devices (ISD's) used during the Trials will allow Community Groups to evaluate methods to better utilise the electricity provisions within their sampling areas.


4a4376ed-0282-4a5a-988b-ff4d898faf42.jpg


We will be able to evaluate what effect various incentives have in altering consumer behavior. Individual houses will be able to compare the impact of their own electricity usage against the average for their local area. Based on that data they can better decide whether to invest in solar panels, grid-connected battery-storage or an Electric Vehicle (EV).

The Trials will include users being provided with real-time data showing the energy-mix plotted against the throughput on their own substation, allowing them to choose when they switch on appliances.

In future Energy Suppliers may offer tariffs which vary throughout the day depending on demand and local (solar/wind) generation. A substation with an ISD is analogous to it having a Smart Meter, allowing Suppliers to use higher and lower costs per half-hour charging-period to encourage consumers to prevent overloading of the local Grid.

Further information to follow:


20 replies

Userlevel 7
Badge +2
.
OpenLV operates like a Smart Meter, but monitors a ground-based electricity substation. The Intelligent Substation Device measures current & voltage on all phases and feeds from that substation. It also takes temperature readings, which reveal the energy loss within the oil-filled transformer.

A typical substation might serve 150 houses using three feeds. The nominal 50 houses on each Feed will be divided between the three phases.

The following diagram shows where an OpenLV ISD sits within the electricity network during the Community Trials:


Within the diagram above, the EV Charger with Vehicle-to-Grid facility is shown in its final configuration, whereby the charge/discharge is controlled by pre-configured preferences, which are then delivered via the SMETS2 Meter. The charger operates as an Auxilliary Load Control Switch (ALCS), taking commands from the meter over the Zigbee mesh network.

By contrast, the home Storage Battery is depicted in a "trial-mode". Prior to SMETS2 being made available, commands for charge/discharge can be sent via the internet. Whilst less secure, it enables the development of software to configure preferences and data-input to tariff/billing systems.

Further information to follow:
Userlevel 7
Badge +2
.
A short video explaining current problems with electricity distribution in the UK and how the OpenLV Project hopes to address these:


Contrary to the invitation at the end of the video, applications to take part in the Trial are now closed. The seven successful Community Projects are listed on the CSE website here.

News from the Trial will be posted here, and OVO Forum Members will have opportunities to comment on the technology and the data provided by the substations being monitored. Your observations and feedback will assist in the shaping of solutions for Electricity Grid monitoring and control once this OpenLV Trial-phase is completed.
Userlevel 7

Look what I found, @Transparent - who knows the latest with this OpenLV project?

Userlevel 7

Just reading up on this exciting-sounding trial. Looks like they’ve made the end-of project documents available on their website here.


Had a chance to check them out yet, @Transparent

Userlevel 7
Badge +2

Well that’s the “glossy” end-of-project report @Jess_OVO !

About half of my own data can’t be released publicly because it either identified properties on maps belonging to Western Power or else it highlighted system weaknesses.

There were three groups in the OpenLV Project whilst funded by Ofgem. The academic studies (group-1) and all but two of the commercial studies (group-2) finished when the project ended. That was the extent of the certification for the prototype monitoring equipment across the 80 transformers.

However, Western Power have retained two monitored substations, and all fourteen of those monitored by Community Groups (group-3) are still operating. These use new equipment installed by EA Technology with fresh certification.

For interest, here’s some data from yesterday (Fri 8th Oct) and overnight to this morning:

substation feed to approx 100 houses

The graph shows the current supplied by a substation from just one of its 3-phase feeds at 10min intervals.

L2 takes much less current during daytime, possibly due to more houses on that feed having PV Solar Panels. This is a clear case of phase-imbalance, resulting in losses at the transformer.

The phases gradually come back into alignment during the evening and enter balance just before 11pm. They remain in that state until 6:20 this morning (Saturday) when L3 starts rising again.

Also of interest here are regular sinusoidal current-demands. I’ve highlighted an area around lunchtime yesterday when L2 has a series of 4 cycles with a period of 25 minutes.

Such low-frequency oscillations are clearly man-made, and most likely due to hysteresis on a heating system. To have such a pronounced effect suggests either a public building or a community-run heat-pump is the cause.

Both L1 and L3 also exhibit similar cyclic current-demand, but there is little synchronisation between the phases. These are therefore most likely also due to single-phase appliances.

Losses are of interest to Distribution Network Operators who are required to reduce them under their RIIO agreements with Ofgem. In this case the losses could readily be addressed by applying storage control techniques using the Flex Platform and/or supplying the heat-pumps from off-grid batteries.

Userlevel 7
Badge +2

By way of comparison, here’s a graph from another local substation which also shows phase-imbalance. However, in this case Phase-L3 is permanently under-loaded compared with the other two.

lightly loaded substation

These losses due to phase-imbalances are very common. Adding Low Carbon Technology such as Smart chargers and Heat pumps is currently making matters worse.

Without addressing this issue, it is unlikely that Distribution Network Operators (DNOs) will be able to meet efficiency targets under their forthcoming RIIO-ED2 agreement with Ofgem.

This is an important factor in the fight against Climate Change. Energy is a valuable commodity and we cannot afford to treat it with such profligacy.

Without an overall intelligent load-control mechanism, such as Flex or Octopus’ Kraken-flex, we cannot readily combat this needless wastage.

Using this as an example, can we tell roughly how many kWh are being "lost" at this substation and roughly what percentage is the loss?

Is it difficult to switch individual homes or groups of homes from one phase to another, appreciating this isn't a long term fix?

Userlevel 7
Badge +2

That’s a tricky question @Jeffus 

At the start of the OpenLV Trial, the prototype LV-CAP monitors had three temperature sensors, one of which recorded the transformer cooling-oil. The units installed now have no temperature monitoring.

The rise in temperature provides a reasonable estimation of the amount of energy being lost as heat for transformers operating well inside their maximum specification. Those running at 80% or more of max-load will obviously also experience a measurable temperature increase due to the throughput current.

The transformer is a multi-material device which includes the magnetic core, copper coils, coolant and outer-casing. A typical unit might have a mass in the region of 1500Kg to 3000Kg, of which half will be the mass of the windings and core.

Small transformer; 315kVA

I’ve monitored a 500kVA transformer (mass 2000Kg) enclosed within an unheated brick building, showing a temperature difference of  +15°C compared with the outside air.

At 8pm the coolant oil was a maximum of 32°C caused mainly by phase-imbalance from solar-panel operation during a sunny day, plus a small amount for the period of evening demand. At this moment the coolant temperature sensor was dislodged from its position and fell onto the concrete floor, about 1m below the sensor for the interior air temp.

The red line on the graph shows a 10°C temperature drop from the cooling oil and a further 2°C due to the floor being colder than the position of the air-temp sensor.

At an average daytime current of around 100A, this transformer was operating at about 10% of its maximum specification. The temperature rise due to the early-evening peak demand is therefore very low.

Reverse the problem for a moment and consider how much energy you would need to put into that 2-tonne transformer to raise its temperature by 10°C. That’s an indication of the losses we’re considering.

As I’m not a mathematician, I’ll also just tag @Simon1D and see if his skill-set can give us a reasonable approximation.

Userlevel 7

Thanks, @Transparent.

donning my metrologist’s hat ...

I’d go with your approach, which starts from the undeniable assertion that energy “lost” somewhere accumulates as heat, either right where it’s lost or wherever it might be transported to, e.g. via a cooling system. My knowledge of substation transformers is close to zero, but they are evidently massive (tonnes) and benefit from active cooling. That cooling system will have a rating (specified to remove heat at a rate of x kW from a source without the source temperature rising above some value T) and that coolant temperature sensor could be calibrated (provided it hasn’t fallen off) in terms of the power of that heat transfer. Making due allowance for the effects of smoothing (a few tonnes of iron should be fairly good at smoothing out fluctuations in heating power from these losses), the last element of the estimation would involve allowing for heat that would be dissipated when the phases are balanced (transformers have less than 100% efficiency at the best of times) in order to see what is the excess heat that could be attributed to dealing with phase imbalances.

I have a sneaking suspicion that I’ve added next to nothing to what @Transparent would have said anyway, but am happy to confirm. (I think this is more of a physics/measurement problem than a maths one, though I wouldn’t dodge the calculation if I’d arrived at one. I should add that, although heat and its measurement is actually what I’ve specialised in, professionally, that was on a scale many orders of magnitude smaller (mW and uW instead of tens of kW).


PS On the specific point:

Reverse the problem for a moment and consider how much energy you would need to put into that 2-tonne transformer to raise its temperature by 10°C. That’s an indication of the losses we’re considering.

That might be thought to hint at a lot of heat being needed, which is true, but once the transformer is warm, that’s it. What counts is the ongoing extraction of heat by that cooling system. And, for the question at hand, the key question is the difference between the run of the mill warming (with balanced phases) and the extra warming (due to the imbalance). Maybe worth comparing temperature logs from days of otherwise similar demand on the substation, days which differ significantly in the solar PV power fed into the grid.

Just looking in more detail at those plots, I suppose that on a sunny day, the “interior air” temperature would go up in the afternoon anyway, and that is fairly clear from the yellow line. but there is a hint of a variation in the cooling system temperature that slightly lags that variation, just as one might expect from the warming effect of an afternoon peak in the phase imbalance losses coming from solar PV fed into the grid. The fact that that’s a barely perceptible variation on an excess of the order 10 K may be a hint that it’s not toooooo bad after all, because that means that the ordinary losses are still dominant. I think.

Except, looking back further, I see that this poor transformer faces a persistent phase imbalance, so that constant background is already more than normal transformer losses.

I’m getting further and further out of my depth, here, so I’ll be off now - but thanks for the diversion from coding :-)


(At risk of boring through repetition:

metrology = the science of (usually physical) measurement

and I am a theoretical physicist who ended up as a metrologist)

Userlevel 7
Badge +2

Thanks for the prompt replies. 

The imbalance i can see in the graphs. Is all the imbalance lost as heat, ie the delta between the lines on the graphs? Can we see how much power is being lost simply by analysing the data in the graphs?

Do all 3 phases ideally need to be in perfect balance so there is no loss?

My questions may be showing my lack of knowledge 😊

Userlevel 7

...

Do all 3 phases ideally need to be in perfect balance so there is no loss?

My questions may be showing my lack of knowledge 😊

I’ll latch onto any chance to fill gaps in my own knowledge(*), to offer/ask @Transparent about a geometric way of thinking of things (this is a question not an answer)…

I picture the three phases as three arrows, ideally the same length, and at 120 degrees to one another, rotating around (at 50 Hz, in the UK).

I recall that phases being balanced is a matter of the resultant (vector addition) being zero.

Do the losses correspond to the length of the resultant (which is in practice never exactly zero?

Or the squared length?

[This is of interest because as something goes to zero, its square goes to zero a lot more quickly.]

If the latter (which would be my gut expectation, half-remembering that in the electrical engineer's use of complex variables, power is something like the product of one complex voltage and a complex conjugate current, says I, bluffing furiously) then so long as the phases are moderately well balanced, then the losses are probably small enough not to worry. @Transparent's comment that the phases weren't very well balanced in the first place may count for a lot here…


(*) I was a little embarrassed to have to edit “fill gaps in my ignorance” to the intended “fill gaps in my knowledge” :-)

Oh that my ignorance could be complete and with no gaps at all...

Userlevel 7
Badge +2

@Simon1D  wrote:

My knowledge of substation transformers is close to zero, but they are evidently massive (tonnes) and benefit from active cooling.

Not the sort we’re talking about here.

The sub-1000kVA transformers used in substations with an 11kV input are passive cooling.

The core and windings are held in a bath of oil which circulates upwards by convection, and then out to finned cooling pipes on the outside. The exact arrangement varies, but here’s a photo on the left and then a couple of views of my simplified 3D model:


On a lightly-loaded ground-mounted transformer you would typically see 30-40°C at the point where the oil leaves the main casing.

There’s a transformer about 5 miles from me which runs too hot to touch. This can lead to premature aging of the internal insulation.


@Jeffus  wrote:

Do all 3 phases ideally need to be in perfect balance so there is no loss?

We’ll never reach that ideal situation on a substation supplying domestic customers because 99.999% will be using single-phase devices!

I don’t know what tolerance levels are regarded as ‘satisfactory’ by the DNOs. They’ve just got used to running them ever more out-of-balance over the last 20-years.

The break point in time was when the Government started offering FIT payments to install PV Solar Panels. Since then the losses on the Distribution Grid have doubled.

Now that Heat pumps are being promoted we’ll also be seeing increased losses due to harmonics. The problem there is that harmonic losses get propagated back through the Grid to the much larger 33kV and 132kV transformers.

That annoying hum you can hear when nearby is evidence of harmonic loss. If it was at 50Hz then it would be below the audible threshold.


I’ve written more extensively on this subject in the Topic Balancing the Grid.

Userlevel 7
Badge +2

There’s an informative 4.20min video on YouTube which takes you around a Grid Supply Point transformer (330kV input; 132kV output). The transformer gets energized at 3m45s if you’re just interested in hearing the harmonics!

The “tertiary winding” referred to in the video clip is to produce 11kV. This then gets transformed down to 440v 3-phase to operate the pumps and cooling fans.

The way in which these auxiliary devices get powered is extremely important. In the event of a nationwide National Grid collapse, there must be a way to bring the complete system back online again. So you can’t ‘borrow’ 11kV from an adjacent transformer to run the cooling system. The entire transformer mechanism must be capable of self-start when the breakers are closed.

Userlevel 7

I’ve enjoyed reading up on this thread today. But also I’ve realised how little I understand this infrastructure. Simon’s analogy of 3 arrows at 120 degrees confused me further. I’ll look to do some reading on this subject over the weekend, and I notice our forum site doesn’t have much to help me with this… yet.


There’s an informative 4.20min video on YouTube which takes you around a Grid Supply Point transformer (330kV input; 132kV output). The transformer gets energized at 3m45s if you’re just interested in hearing the harmonics!


Oh wow, yes at 3m45s it kicks off. A perfect musical 5th interval in fact, a tonic and a 5th above it. I’ve heard ambient musical performances just like this transformer! :joy:

Userlevel 7

There’s an informative 4.20min video on YouTube which takes you around a Grid Supply Point transformer (330kV input; 132kV output). The transformer gets energized at 3m45s if you’re just interested in hearing the harmonics!

The “tertiary winding” referred to in the video clip is to produce 11kV. This then gets transformed down to 440v 3-phase to operate the pumps and cooling fans.

The way in which these auxiliary devices get powered is extremely important. In the event of a nationwide National Grid collapse, there must be a way to bring the entire system back online again. So you can’t ‘borrow’ 11kV from an adjacent transformer to run the cooling system. The entire transformer mechanism must be capable of self-start when the breakers are closed.

Fascinating! Many thanks, @Transparent!

Userlevel 7
Badge +2

I had missed answering this point from @Jeffus 

Is it difficult to switch individual homes or groups of homes from one phase to another, appreciating this isn't a long term fix?

In most cases it’s time-consuming and labour-intensive to change the phase supplying a house.

The majority of our 3-phase 440v feeds are underground. It means digging up the road to access the connection point.

Moreover if the cable run to the house itself is ever renewed or replaced it’s common practice to connect it to whichever conductor was at the top of the bundle when you locate it in the trench.

I live in an area with lots of above-ground feeds. These are now being changed to Aerial Bundled Cabling (ABC). This is 3 separate cables (or 4 if Neutral required) twisted together with connections made in pole-top boxes.

Cable upgrade to ABC by Western Power Distribution

Connections to a house can be made using Insulation Displacement Connectors which are tightened onto the ABC cable with a spanner. This automatically provides a water-tight seal without having to cut the feed-cable or switch off the power.

Connector for overhead ABC cable

There is no map which shows the phase supplying each house and it would be difficult to produce one. The three phases do not have a ‘master set’ anywhere in the country which can be used as a reference. Each transformer through which the electricity supply passes will rotate the phases +30° (Dyn-1) or -30° (Dyn-11).

Dyn-11 identification on substation transformer

In effect, houses have been randomly assigned to a phase. This was fine when each property had roughly equal demand, but that’s no longer the case.

Userlevel 7

You’ll be proud to hear I’ve been bringing up phase-imbalances to my friends over the weekend, @Transparent.


My engineering friend explained the difference between a single phase and three phase supply using a rope-wave analogy, and I thiiiiink I can visualise things now.


There is no map which shows the phase supplying each house and it would be difficult to produce one. The three phases do not have a ‘master set’ anywhere in the country which can be used as a reference. Each transformer through which the electricity supply passes will rotate the phases +30° (Dyn-1) or -30° (Dyn-11).

Dyn-11 identification on substation transformer

In effect, houses have been randomly assigned to a phase. This was fine when each property had roughly equal demand, but that’s no longer the case.


This is where my understanding gets a bit ropey (excuse the pun), why do the phases need to be rotated or is this a by-product of them being ‘transformed’?

Userlevel 7
Badge +2

Excellent question @Jess_OVO - have a gold star :star:

The reason for rotating the phases in a transformer is to make best use of the magnetic flux in the core. You don’t want the flux to decrease to zero and then increase again as the next phase of the incomer rises in voltage.

Think of the magnetic flux as a temporary energy store.

A Local Substation transformer is usually wired in a Delta-Wye format. The primary 11kV windings are the Delta, and the secondary Wye windings have a central connection point which provides the neutral.


Higher voltage 3-phase transformers on the Distribution Grid are more likely to be Star/Delta winding format.

Historically the transformer manufacturers have sought to maximise the efficiency in the forwards direction – from primary to secondary.

The consequence of this is that efficiency is lower in the reverse-power direction – when homes are feeding back to the Grid.

The Standard Technique procedures (the “rule book”) state that a transformer may only accept 50% of its rated capacity in reverse-power mode unless it has been manufactured and specified for greater efficiency in the reverse direction.

The most critical parameter is when reverse-power is being applied with the phases imbalanced. Energy losses will be roughly double those associated with the same amount of imbalanced power in the forwards direction.

This characteristic helps to explain why a DNO will normally accept 32A import for Low Carbon Technology single-phase loads such as Heat pumps and EV charge-points, but only 16A (3.68kW) for export from Solar Panels.

Userlevel 7

Wow - things did get very technical very quickly there, @Transparent !


So from my understanding on things the current transformer set-up is more designed for energy to be imported from the grid rather than exported to the grid from individual homes. Obviously this will become more and more relevant as more homes install devices capable of exporting energy.


So in the current situation, how are transformers (or substations) adapted to cater to homes exporting larger amounts of energy, or would it be the case that the DNO would limit the number of applications it grants to exceed the usual export limit depending on the devices already installed - ie. you may be denied an application to export from a larger amount of solar panels if you neighbor or someone also linked to the same substation is already exporting over a certain amount of energy?


Not sure if that fully makes sense but trying to keep up! :slight_smile:

Userlevel 7
Badge +2

Yes it’s the case that a DNO can reject an application for export from your house due to the existing levels of export from your neighbours. That’s a safety issue and trumps all other points of negotiation.

The issue depends on whether you and the neighbours are on the same phase of course. If the Substation transformer is still well within its overall Reverse-Power capacity, then moving a couple of houses to different phases may actually make things better and reduce losses.


You can begin to see why Western Power decided to keep the original OpenLV Project alive for just the Community Groups. They have the ability to coordinate demand and supply between neighbours in ways that Energy Suppliers and DNOs cannot!


We must understand that there is difference between

a: trying to ‘balance the grid’ solely on the matter of supply & demand

b: taking a holistic view of the Distribution Grid, such that its enhancement also permits:

  • reduction of losses through phase-imbalance, harmonics etc
  • increasing the proportion of renewables exported to the grid

Option (a) is short-sighted and can make (b) even more difficult to implement.

Reply