Open for votes

Show energy usage by month as a % of UK average on the online account

Related products:Online account

  • Carbon Cutter*****
  • 17 replies

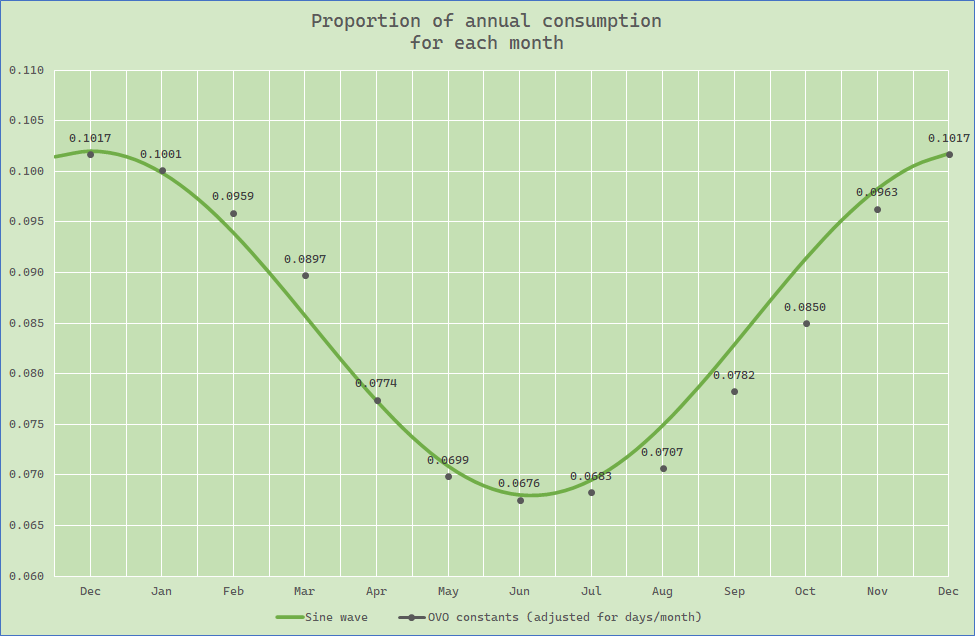
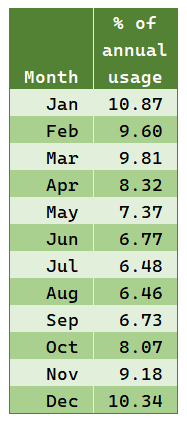
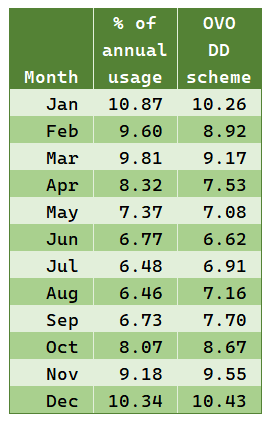
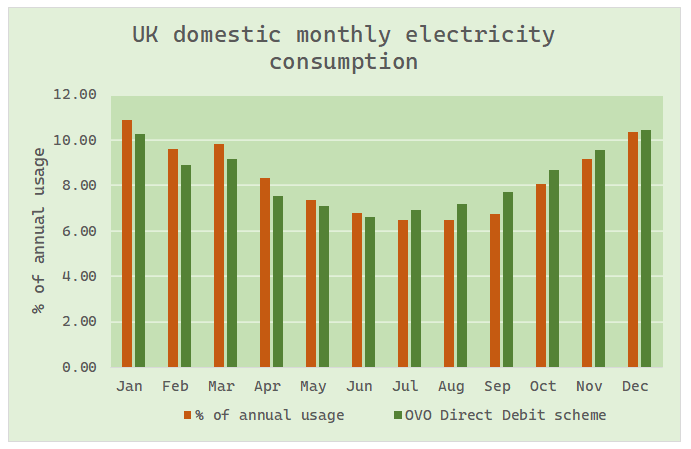
Could we know the energy usage (both gas and electricity) shown as a monthly % of the yearly average?

Say Jan = 12%, Feb = 11%, March =8% etc, shown as calendar months (Jan - Dec).

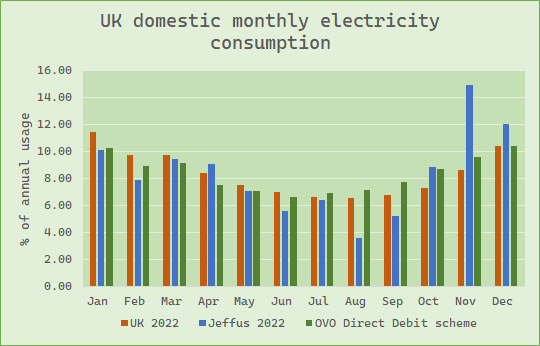
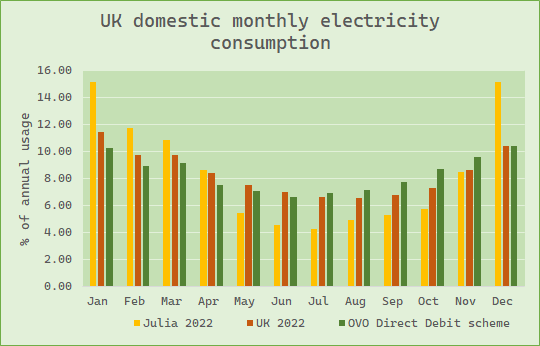
We could then compare our use with the national or regional average. If I have a problem I would like to know and to know quickly rather than looking at a generalisation of the yearly use.

It would help to have the figures by size of house also for more accuracy. 

OVO has the information so it would not be a difficult thing to do.

34 replies

Firedog
Plan Zero Hero
Forum|alt.badge.img
  • Plan Zero Hero
  • 2010 replies
  • April 25, 2023

If you look at the Direct Debit calculator, you’ll see in Cost view what I think is some sort of standardized variation through the year. I compiled te graph below from my own DD figures, so they may not be the same for everyone. For a start, mine is an all-electric household; it’s quite normal for gas-heated houses to show very low usage in the summer. The figures have been adjusted for days/month; otherwise, February normally shows lower usage than March even though the daily usage will in general be higher. 

My sine wave doesn’t fit very well, so I think these must be observations of some sort; it would be nice to know where they come from. For example, do they apply across the whole UK? Or the whole of Britain? Are the same calculations applied for users in Caithness and Cornwall? It may be that the difference is insignificant, of course. 


Jeffus
Plan Zero Hero
Forum|alt.badge.img+2
  • Plan Zero Hero
  • 2553 replies
  • April 26, 2023

It has not always been there,

But you can see weekly comparison with similar homes on the Energy Insights. Perhaps start to record the weekly figures in a spreadsheet. 


  • Author
  • Carbon Cutter*****
  • 17 replies
  • April 26, 2023

Hello Firedog, thanks for that, I had not noticed the D/D calculator.

My point was also that if there is a problem, such as a slow increase in usage, consumers don’t have a basic set of numbers to compare with as time goes on. By definition if there is an issue then individual averages with start to shift and hide the issue.

All energy companies have this information in a easily readable form and it would be a really simple project to have a page on customer’s accounts that shows a rolling graph that compares their usage with a regional average over say three years.

And, what a marketing tool to be able to actually demonstrate how they are helping to drive down usage and bills.

ColinW


BPLightlog
Plan Zero Hero
Forum|alt.badge.img+5
  • Plan Zero Hero
  • 2730 replies
  • April 26, 2023

What I (and others) use a fair bit now are data feeds from third party (authorised and approved) apps. One in particular gives a comparison view either daily during a week, daily based on a day (so say comparing recent Mondays), monthly or yearly. 
I am rather interested in factual info and so I look at this most days. This gives you an idea of some of these. 


  • Author
  • Carbon Cutter*****
  • 17 replies
  • April 26, 2023

That's for that, I will take a look.

CW


Jeffus
Plan Zero Hero
Forum|alt.badge.img+2
  • Plan Zero Hero
  • 2553 replies
  • April 26, 2023

The government provide some summary data, for example this includes domestic electricity consumption by quarter.

https://assets.publishing.service.gov.uk/government/uploads/system/uploads/attachment_data/file/1147118/ET_5.2_MAR_23.xlsx

As a test, i have made one of my regular FOI requests just asking for  monthly rather than quarterly for now.

They may say they are only given quarterly data or give some other reason for not supplying it. 

I will post what they come back and then ask for further data if it looks like they will release it. 


Firedog
Plan Zero Hero
Forum|alt.badge.img
  • Plan Zero Hero
  • 2010 replies
  • April 26, 2023
Jeffus wrote:

The government provide some summary data, for example this includes domestic electricity consumption by quarter.

I managed to find some monthly data from the ONS:  https://assets.publishing.service.gov.uk/government/uploads/system/uploads/attachment_data/file/1147121/ET_5.5_MAR_23.xlsx (Excel workbook, 270kB). 

I took the figures for the past five years (2018-2022), reduced each month’s figure to a percentage of the annual usage, then took the average of those five years. This was the result:
  

Average monthly domestic sales of electricity 2012-2022

Perhaps this is something like what @Colin W was looking for.


Jeffus
Plan Zero Hero
Forum|alt.badge.img+2
  • Plan Zero Hero
  • 2553 replies
  • April 26, 2023
Firedog wrote:
Jeffus wrote:

The government provide some summary data, for example this includes domestic electricity consumption by quarter.

I managed to find some monthly data from the ONS:  https://assets.publishing.service.gov.uk/government/uploads/system/uploads/attachment_data/file/1147121/ET_5.5_MAR_23.xlsx (Excel workbook, 270kB). 

I took the figures for the past five years (2018-2022), reduced each month’s figure to a percentage of the annual usage, then took the average of those five years. This was the result:
  

Average monthly domestic sales of electricity 2012-2022

Perhaps this is something like what @Colin W was looking for.


Also splits out by England/Wales, Scotland, Northern Ireland so some very high level regional info.

Be interesting to see how my FOI request is answered and if they simply sign post this data set. 


Firedog
Plan Zero Hero
Forum|alt.badge.img
  • Plan Zero Hero
  • 2010 replies
  • April 26, 2023

Just for fun, I added the equivalent figures derived from OVO’s DD calculator for comparison:


Some of the differences are quite marked, so I’m still wondering what OVO base their calculations on.


Firedog
Plan Zero Hero
Forum|alt.badge.img
  • Plan Zero Hero
  • 2010 replies
  • April 26, 2023

… and for the more visually-oriented:


The source is the dataset referred to earlier, from Energy Trends and Prices statistical release: 28 February 2023 - GOV.UK, using averages for the years 2018-2022.

In an unrelated note, this comment to the dataset is remarkable:

Domestic sales decreased 6.5 per cent in the three months to January 2023 compared to the same period the previous year. This decrease was likely due to high electricity prices as demand did not follow temperature patterns as would typically be expected. November 2022 had milder average temperatures, while December's average temperatures were substantially lower than in 2021, and January's were similar; however, domestic consumption was lower than 2021 in all three months. 


  • Author
  • Carbon Cutter*****
  • 17 replies
  • April 27, 2023

Hi Guys, that is exactly what I meant. An average of 5 years by month is perfect.. Thank you.

There is no reason that the energy companies  don't automatically provide this data other than either they cant be bothered or they don't want everyone to know.

The decrease in consumption driven by cost is obvious but still interesting information.

The five year average is great, do I understand that is for only electricity and if so do we have the same data for gas?

Colin W


Jeffus
Plan Zero Hero
Forum|alt.badge.img+2
  • Plan Zero Hero
  • 2553 replies
  • April 27, 2023
Firedog wrote:

… and for the more visually-oriented:


The source is the dataset referred to earlier, from Energy Trends and Prices statistical release: 28 February 2023 - GOV.UK, using averages for the years 2018-2022.

In an unrelated note, this comment to the dataset is remarkable:

Domestic sales decreased 6.5 per cent in the three months to January 2023 compared to the same period the previous year. This decrease was likely due to high electricity prices as demand did not follow temperature patterns as would typically be expected. November 2022 had milder average temperatures, while December's average temperatures were substantially lower than in 2021, and January's were similar; however, domestic consumption was lower than 2021 in all three months. 


What does your actual consumption look like if plotted on the graph? 


Jeffus
Plan Zero Hero
Forum|alt.badge.img+2
  • Plan Zero Hero
  • 2553 replies
  • April 27, 2023

Here is our actual for electricity. Driven quite a lot based on whether we are actually at home. The OVO DD calculator is never going to find our usage easy to follow 😊 

A bit below the Ofgem Typical Consumption value of 2900kWh

Month    kWh    % Consumption
Jan-22    257.15    0.101229397
Feb-22    199.91    0.078696359
Mar-22    238.87    0.094033311
Apr-22    229.61    0.09038803
May-22    179.54    0.070677526
Jun-22    141.24    0.055600389
Jul-22    161.85    0.0637137
Aug-22    91.41    0.035984364
Sep-22    132.12    0.052010219
Oct-22    224.92    0.088541769
Nov-22    378.84    0.149133753
Dec-22    304.81    0.119991182
Total    2540.27    


Firedog
Plan Zero Hero
Forum|alt.badge.img
  • Plan Zero Hero
  • 2010 replies
  • April 27, 2023
Jeffus wrote:

Here is our actual for electricity.


It’s fascinating to introduce a bit of real-life to the picture:


Not really far off what you might expect. August - summer holidays, so fridge/freezer and not much else? I can’t imagine what you were up to in that ‘milder than normal’ November, though 😉


juliamc
Carbon Catcher***
Forum|alt.badge.img+3
  • Carbon Catcher***
  • 1258 replies
  • April 27, 2023

Ooh… can you add mine?


Jeffus
Plan Zero Hero
Forum|alt.badge.img+2
  • Plan Zero Hero
  • 2553 replies
  • April 27, 2023
Firedog wrote:
Jeffus wrote:

Here is our actual for electricity.


It’s fascinating to introduce a bit of real-life to the picture:


Not really far off what you might expect. August - summer holidays, so fridge/freezer and not much else? I can’t imagine what you were up to in that ‘milder than normal’ November, though 😉

Yep interesting. 

So I think a lot of  working at home that month (my partner has an electric heater on when working at home in the daytime quite often), her staying home more due to rail strikes and making sure i was OK after my skin cancer operation. 

Family came to stay. 

I see we didn't have the gas central heating on as much so our gas was less than the previous year in November. 

Nov    930.79 kWh    680.97 kWh


juliamc
Carbon Catcher***
Forum|alt.badge.img+3
  • Carbon Catcher***
  • 1258 replies
  • April 27, 2023
juliamc wrote:

Ooh… can you add mine?

Jan 1263.3kWh  15.1 %

Feb. 978.7.  11.7

Mar.  903.46   10.8

Apr.  718.64.    8.6

May.  453.9.     5.4

Jun.   380.9.    4.6

Jul.     353.0.    4.2

Aug.   412.5.    5.0

Sep.    441.49.   5.2

Oct.     476.51.    5.7

Nov.    709.4.     8.5

Dec.    1265.55.   15.2

That's with EV (though low mileage) heat pump, elec cooker


Firedog
Plan Zero Hero
Forum|alt.badge.img
  • Plan Zero Hero
  • 2010 replies
  • April 27, 2023

Will this do?


What a difference sunshine makes!


juliamc
Carbon Catcher***
Forum|alt.badge.img+3
  • Carbon Catcher***
  • 1258 replies
  • April 27, 2023

Fab, those cold days really do cost…!


Jeffus
Plan Zero Hero
Forum|alt.badge.img+2
  • Plan Zero Hero
  • 2553 replies
  • April 27, 2023

Here are my

Firedog wrote:

Just for fun, I added the equivalent figures derived from OVO’s DD calculator for comparison:


Some of the differences are quite marked, so I’m still wondering what OVO base their calculations on.


Electricity figures taken direct from my DD page for comparison

Month    £ Elec DD    %
Jan-22    112.23    0.103833984
Feb-22    97.39    0.090104176
Mar-22    100.12    0.092629943
Apr-22    72.93    0.067474048
May-22    76.85    0.07110079
Jun-22    71.75    0.066382325
Jul-22    74.98    0.069370686
Aug-22    77.78    0.071961216
Sep-22    83.86    0.077586366
Oct-22    94.54    0.087467387
Nov-22    104.34    0.096534241
Dec-22    114.09    0.105554836

                  1080.86    1


Jeffus
Plan Zero Hero
Forum|alt.badge.img+2
  • Plan Zero Hero
  • 2553 replies
  • April 27, 2023
juliamc wrote:

Fab, those cold days really do cost…!

One big difference is you have your main heating source in those actual electricity figures.

With the wood with @Firedog and the mains gas with me, the graphs would start to look similar i suspect 


Jeffus
Plan Zero Hero
Forum|alt.badge.img+2
  • Plan Zero Hero
  • 2553 replies
  • April 27, 2023
Firedog wrote:

Will this do?


What a difference sunshine makes!

I like the visual representation of an example of what will happen to electricity usage as more people switch to EVs and Heat Pumps. 


Firedog
Plan Zero Hero
Forum|alt.badge.img
  • Plan Zero Hero
  • 2010 replies
  • April 27, 2023
Jeffus wrote:

Electricity figures taken direct from my DD page for comparison


Aaah, but if you deduct your £0.50 monthly contribution to OVO Foundation (just guessing ...) from them, your figures are the same as mine ±0.01% 😉


Jeffus
Plan Zero Hero
Forum|alt.badge.img+2
  • Plan Zero Hero
  • 2553 replies
  • April 27, 2023
Firedog wrote:
Jeffus wrote:

Electricity figures taken direct from my DD page for comparison


Aaah, but if you deduct your £0.50 monthly contribution to OVO Foundation (just guessing ...) from them, your figures are the same as mine ±0.01% 😉

Not signed up to that. 

Just took verbatim, i did think about taking off the standing charge. 

Would be interesting to see if @juliamc had the same DD profile given the heat pump. 


Firedog
Plan Zero Hero
Forum|alt.badge.img
  • Plan Zero Hero
  • 2010 replies
  • April 27, 2023
Jeffus wrote:


One big difference is you have your main heating source in those actual electricity figures.

With the wood with @Firedog and the mains gas with me, the graphs would start to look similar i suspect 


I might just do a cost comparison of wood v. gas v. electricity as heating fuels, just in case anyone’s wondering. Trouble is, I can only get within about an order of magnitude for the cost/kWh delivered for my stove. It’s somewhere in the range 5 - 15p. Electric heating would cost me 46p/kWh on my current tariff, but E7 would bring that down considerably, perhaps to something like 30p - two or three times the price for half the comfort.   


Reply


Cookie policy

We use cookies to enhance and personalize your experience. If you accept you agree to our full cookie policy. Learn more about our cookies.

 
Cookie settings