Solved

Standing Charges & VAT not included in 'Usage' pages on App / online account?

  • January 14, 2025
  • 3 replies
  • 70 views

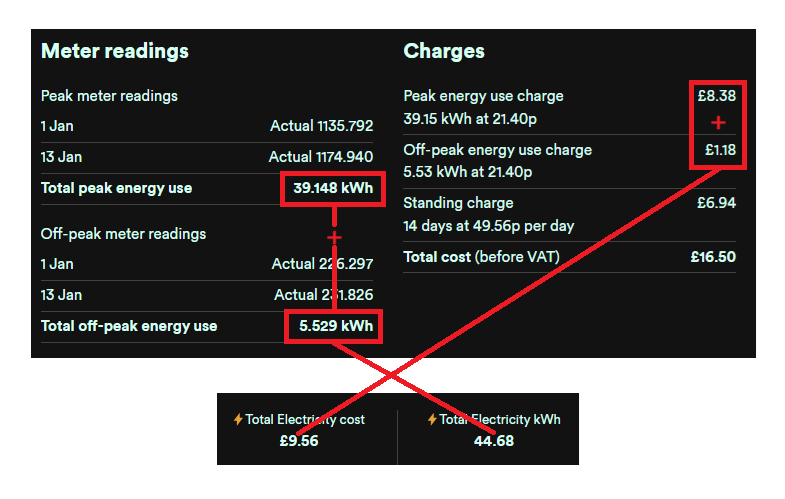
It would appear that the cost of energy used for the year on the usage page is just the cost of the units used not including the standing charges etc.  This seems confusing if not disingenuous as standing charges make up nearly 30% of the overall billed amount.

Best answer by Ben_OVO

Hi ​@ForumUserXE 


Thanks for your comments, I hope I can shed some light on our Usage graphs for you.


Our live daily billing platform and app/web Usage graphs are designed to work with smart meters. If you don’t have smart meters currently, you can book an appointment via your online account or app.


If you have smart meters, they need to provide half-hourly meter readings for the Usage pages to show the most accurate data. You can contact our Support Team to check your meters are set up in this way. If not, they can reconfigure them remotely.


Your Usage graphs are there as a helpful tool to show Usage patterns and costs across the day, week, month and year. 5% VAT and Standing Charges aren't included in the comparison, as the graphs relate to your usage alone.


As @Blastoise186 mentioned, you can see your total costs by checking your bills. To do this, log into your online account or app. If you’re logging in on a web browser, click ‘Billing History’. On the app click ‘Bills’. You can then see a list of all statements. Click on the arrows on the right hand side of the screen to view the statement as a pdf. I’ve included a screenshot of my own online account below to help you navigate:


AD_4nXcTQFrVKLgh_yAk1QpcXnuFY3uSikJQqn3bvXXf2Sjor3L9yGJvj-6zTbjcXRYJMffm48GeSYOvZPGtWAbEbRUQovQM2vbZkrRlaottAVS6ydCPQbYy48N3GbjOLdBmMzRtQ70vCw?key=8KspEhY-nolRv-zvNgZ22Qrt


View original

3 replies

Blastoise186
Plan Zero Hero
Forum|alt.badge.img+1
  • Plan Zero Hero
  • 7867 replies
  • January 14, 2025

Hi,

That’s actually intentional and my understanding is that’s it’s consistently that way across all suppliers. The usage pages are only a guide to help you know how much you’re using - please do not rely on them for billing purposes and they do also include a note about that as a reminder. If you’re after a running total that factors in absolutely everything, you want the Bills/Billing Details page instead!

OVO does Live Billing, so the Bills section will be updated daily with your actual costs - Standing Charges and VAT included.


Firedog
Plan Zero Hero
Forum|alt.badge.img
  • Plan Zero Hero
  • 2008 replies
  • January 14, 2025
Blastoise186 wrote:

OVO does Live Billing, so the Bills section will be updated daily with your actual costs - Standing Charges and VAT included.
 

That’s well and good, but in fairness to the OP, I’d point out that the figures (cost or kWh) shown on usage pages don’t necessarily appear anywhere on the billing page. I have to get my slide rule out to add them up to compare them:


Ben_OVO
Community Moderator
  • Community Moderator
  • 128 replies
  • Answer
  • January 15, 2025

Hi ​@ForumUserXE 


Thanks for your comments, I hope I can shed some light on our Usage graphs for you.


Our live daily billing platform and app/web Usage graphs are designed to work with smart meters. If you don’t have smart meters currently, you can book an appointment via your online account or app.


If you have smart meters, they need to provide half-hourly meter readings for the Usage pages to show the most accurate data. You can contact our Support Team to check your meters are set up in this way. If not, they can reconfigure them remotely.


Your Usage graphs are there as a helpful tool to show Usage patterns and costs across the day, week, month and year. 5% VAT and Standing Charges aren't included in the comparison, as the graphs relate to your usage alone.


As @Blastoise186 mentioned, you can see your total costs by checking your bills. To do this, log into your online account or app. If you’re logging in on a web browser, click ‘Billing History’. On the app click ‘Bills’. You can then see a list of all statements. Click on the arrows on the right hand side of the screen to view the statement as a pdf. I’ve included a screenshot of my own online account below to help you navigate:


AD_4nXcTQFrVKLgh_yAk1QpcXnuFY3uSikJQqn3bvXXf2Sjor3L9yGJvj-6zTbjcXRYJMffm48GeSYOvZPGtWAbEbRUQovQM2vbZkrRlaottAVS6ydCPQbYy48N3GbjOLdBmMzRtQ70vCw?key=8KspEhY-nolRv-zvNgZ22Qrt


Reply


Cookie policy

We use cookies to enhance and personalize your experience. If you accept you agree to our full cookie policy. Learn more about our cookies.

 
Cookie settings