Comparison of heating sizing methods (simple to complex)

  • 3 February 2024
  • 13 replies
  • 393 views

Userlevel 4
Badge

Many thanks for the suggestions for alternative ways of estimating heating demand and hence heat pump size. I have tried a few and the results are in!

Our Bryant’s Maldren house has a floor area of around 122 m2 and last year our gas usage (water plus heating) was around 9600 kWh.

In all of these methods the “Heat Transfer Coefficient” or HTC is the fundamental value that is calculated, basically how much power is needed to raise the temperature of the house by 1 °C.

Rule of thumb methods

The Michael de Podesta’s video provides an excellent introduction not only to his rule of thumb method but also heat loss calculations in general. It’s well worth watching. Thanks to @BPLightlog for his recommendation.

Michael de Podesta Rule of thumb

This is one of the easiest methods

  • Heat Transfer Coefficient = Annual Usage / 57.3 (For the North West)
    • 9600 / 57.3 = 168 W/K

This is actually calculated using:

  • Annual Usage / Degree Days * 1000 / 24

Using average degree day from 1976 to 1995 may not be representative of last year’s temperatures. If I use my local degree day for 2023 then I get

  • 9600 /1826 * 1000 / 24 = 220 W/K

Heat Geek Cheat Sheet

 You can read full details at Heat Loss Calculation: Heat Pump & Boiler Sizing Guide (heatgeek.com)


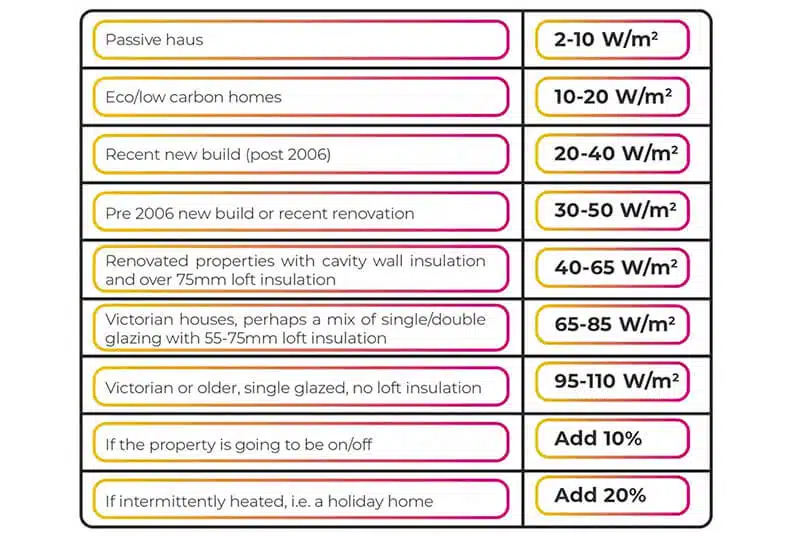
For our house (pre 2006) this equates

  • Lower limit: 30 W/ m2 * 122 = 3.7 kW (155 W/K)
  • Upper Limit: 50 W/ m2 * 122 = 6.1 kW (254 W/K)

Experimental Methods

These entail taking measurements of energy usage and outside temperature over a LONG period of time.

I have added an article Estimating Heat Pump or Boiler size using usage data and temperature | The OVO Forum (ovoenergy.com) which explains in detail how to use gas usage data from your smart meter (or even recoded manually) and local temperature or degree day data.
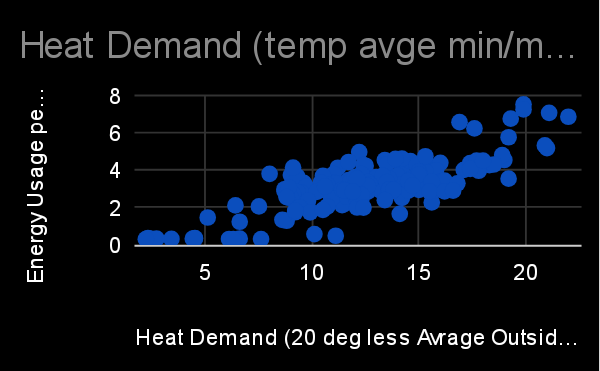
Weekly Gas Usage

For many (many!) years have I have collected our usage data so I can compare weekly (over many years), daily, over the past year, and even hourly (over the last winter).


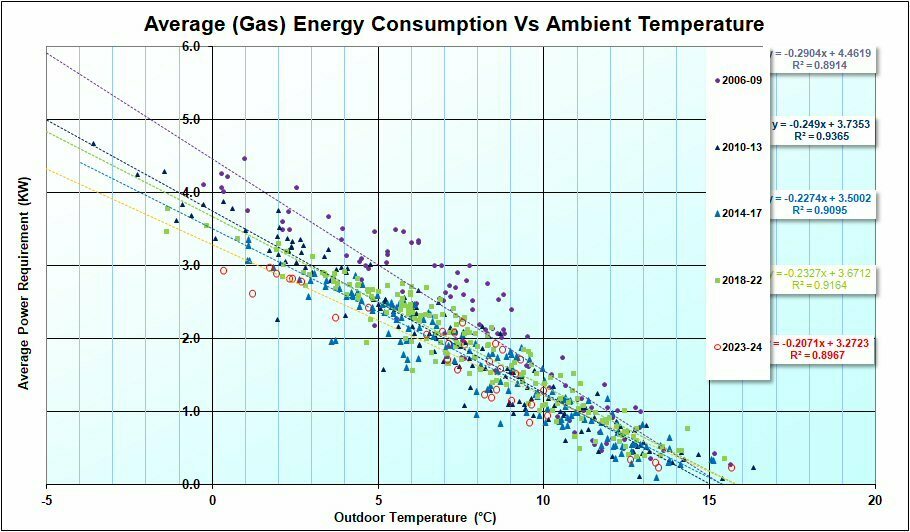
I originally used this data to see how well (or not) various energy saving measures worked.

The slope of the graph(s) provides the heat transfer coefficient of the house 207 W/K, and also the power demand at -3 °C (3.28 + -3 * 0.207) 3.9 kW.

Since this takes the daily usage and divides by 24 hr, this is probably too low. Should it really be over the 16 hours that the heating was on? But the early morning load will be dominated by replacing heat lost overnight so in reality it will be somewhere between the two.

  • 24 Hour basis:
    • Heat Transfer Coefficient: 207 W/K
    • Power at -3 °C: 3.9 kW
  • Heating only basis (16 hr):
    • Heat Transfer Coefficient: 311 W/K
    • Power at -3 °C: 5.85 kW
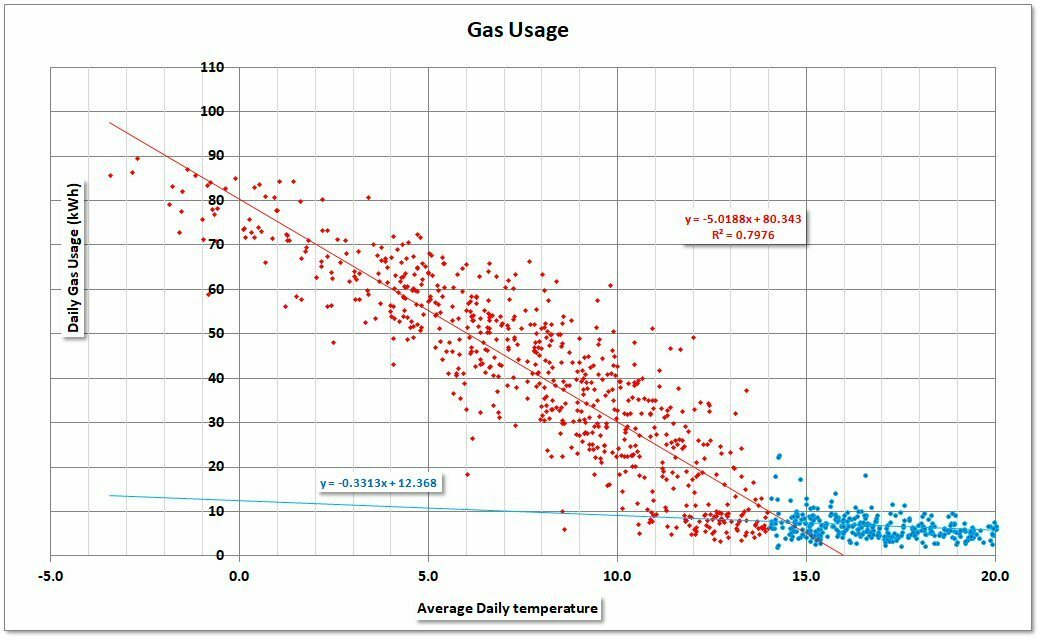
Daily Gas Usage

This data is averaged over a day.

  • 24 Hour basis:
    • Heat Transfer Coefficient: 115 W/K
    • Power at -3 °C: 3.43 kW
  • Heating only basis (16 hr):
    • Heat Transfer Coefficient: 221 W/K
    • Power at -3 °C: 5.34 kW

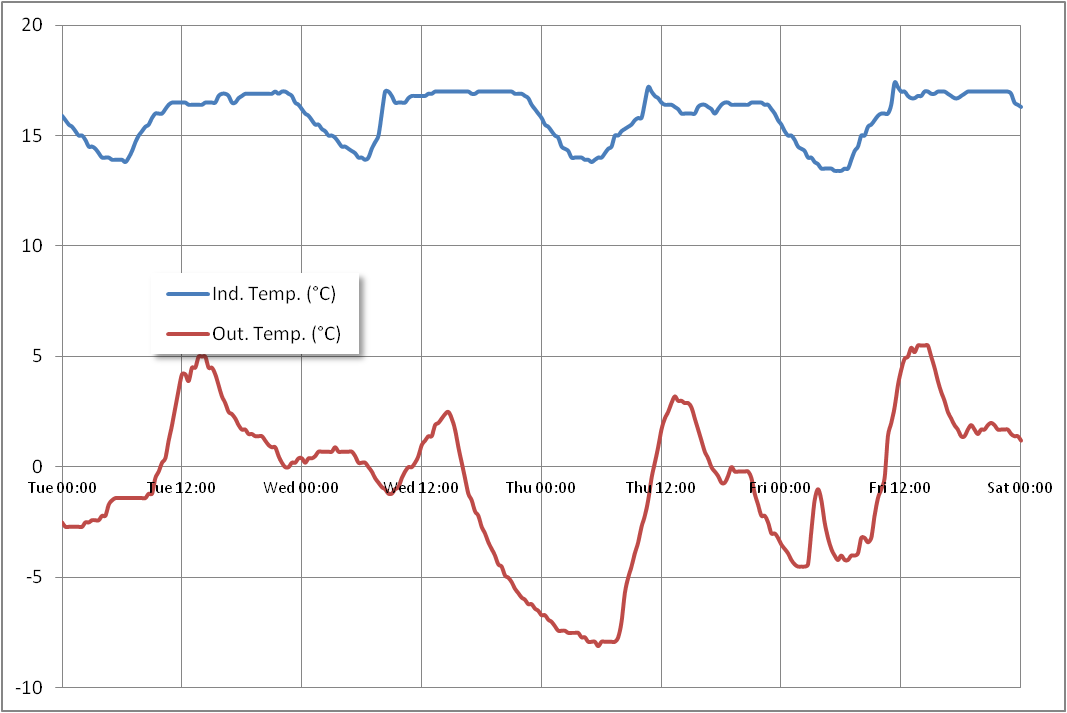
Gas used during a known stable period 17:00 to 22:00 hrs

With a smart meter it is possible obtain data for 30 minute periods, so it is possible to look at demand and temperature over a small period of time when the house temperature is stable.


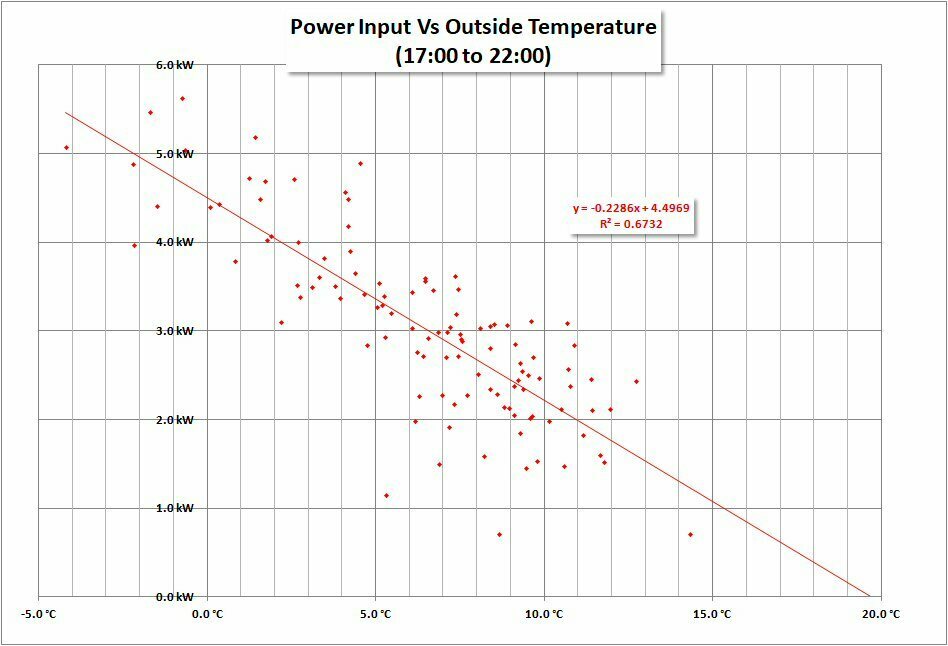
This data was collected over defined 5 hour period.

  • Heat Transfer Coefficient: 229 W/K
  • Power at -3 °C: 5.19 kW

Detailed Thermal Calculation

MCS Spreadsheet

I did try to complete the MCS calculator (MCS Launch New & Improved Heat Pump Calculator - MCS (mcscertified.com) ), however whether it was my version of Excel, or the version I downloaded, or maybe operator error I’m not sure but several selections returned #N/A so after trying a few rooms I sadly gave up! The results for the rooms I tried were broadly in line with the other two methods mentioned below, or maybe a little on the high side. (I did have problems with the floor calculations).

Heat Punk

Thanks to @Jeffus for suggesting HeatPunk!

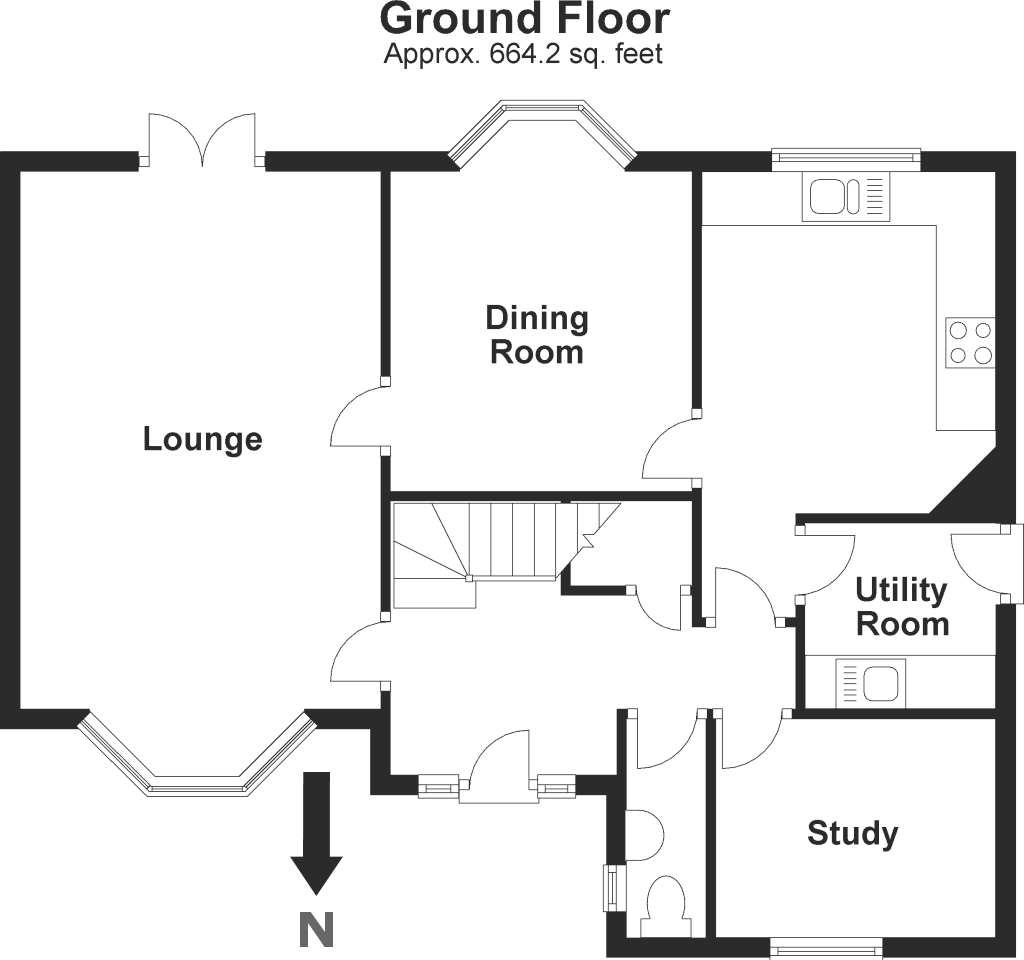
Compared to filling in spreadsheets this was a delight to use! A few niggles with trying to find the appropriate walls and roofing but I was on a steep learning curve! Being able to draw the rooms, position them relative to each other, repeat for each floor, and then align the upper floor with the ground floor is ideal for calculating room to room heat conduction. It also allows for unheated rooms, such as conservatories.

The heat pump section is excellent and allows you to check if your chosen device is suitable.

HeatPunk calculated a design power requirement of 7.48 kW at -3 °C.

I couldn’t find the Heat Transfer Coefficient in the various reports, however working backward I think the Heat Transfer Coefficient is around 350 W/K.

My only criticism is that you cannot see the breakdown between the various losses (walls, windows, ventilation etc).

BeePee Spreadsheet

This spreadsheet actually dates back to 2007, but I have recently updated it.

I wasn’t sure how accurate it was so I compared its results with the HeatPunk calculations using the same default values for room temperature and air changes.

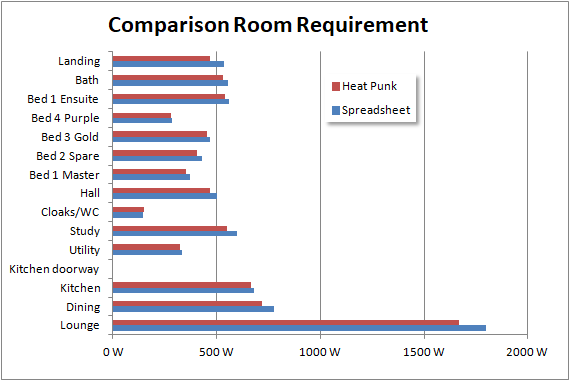
I was pleasantly surprised! My figures gave:

  • Heat Transfer Coefficient: 353 W/K
  • Power at -3 °C: 7.6 kW

An advantage of the HeatPunk and Spreadsheet methods is the ability to check if radiators are of sufficient size.


This appears to show that at least 6 of the 14 radiators are undersized!

However, the spreadsheet indicates an annual heating demand of 18427 kWh, compared with our annual TOTAL gas usage for 2003 of just less than 9600 kWh.

Obviously something is amiss!

The spreadsheet can also show the source of the heat losses.


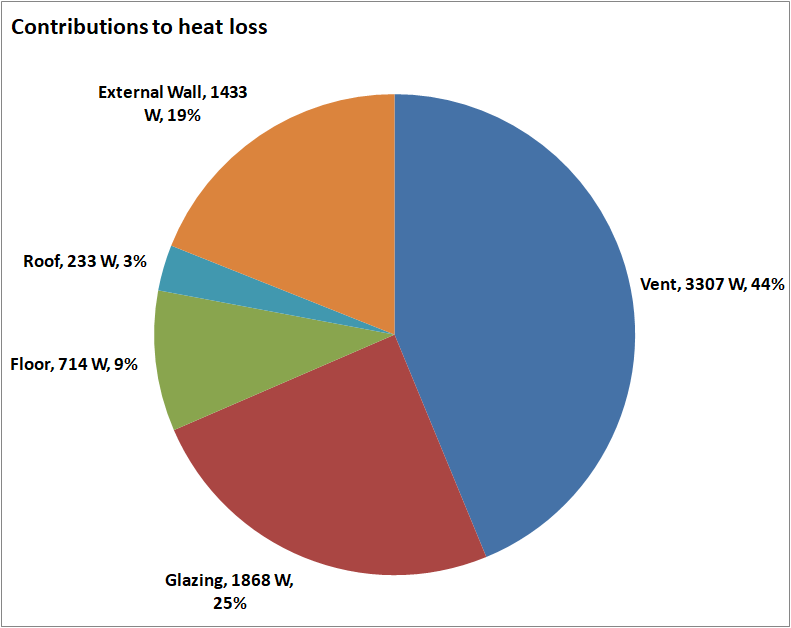
Do I believe that our house loses 44% of its heat through draughts? We do see an increase in energy usage on very windy days (5 to 10%), but 44%?

Looking at the layout of the rooms most of the air changes in the dining room will be via the lounge or kitchen so why the default 1.5 air changes per hour if the air is pre-heated.

The models also assume default air temperatures for each room. If I use more “reasonable” ventilation rates, reducing its contribution from 44% to 33% this brings us down to:

  • Heat Transfer Coefficient: 299 W/K
  • Power at -3 °C: 6.4 kW

In Summary

Discussion

There appear to be two main discrepancies.

Heat Transfer Coefficient

Using the various plots of energy usage against temperature suggests a HTC of around 250 W/K significantly less than the calculated value of 296 W/K.

  • There is no allowance for curtains: This could improve the ‘U’ value of windows from 2.8 to 2.3 W/m2K (-12 W/K).
  • There is no allowance for wall cupboards (kitchen), built-in fixtures (bathroom), wardrobes (bedroom), furniture against external walls, unheated areas (conservatory) or planting against the walls. This could account for a 300 W reduction to the wall losses (-12 W/K).
  • Floor losses seem to be a black art, and finding ‘U’ values for un-insulated flooring is not easy. Floor losses could be half (or double). Maybe ±200 W or ±5 W/K.
  • Ventilation rates could still be on the generous side? Maybe a further 300 W or -12 W/K

If ALL worked in our favour this brings the calculated value down from 296 W/K to 255 W/K!

Degree Day Data

The MCS spreadsheet uses degree day data from the period 1976 to 1995. The Met Office Climate Portal provides more recent degree day data for the period 1981 to 2000 and 2001 to 2020. They also provide estimates based upon the amount of global warming.

  • Midlands (MSC 1976 to 1995)                                  2197
  • EGNX (DegreeDays.net East Midlands 2015-20)   2174
  • Nottingham (Met Office 1981-2000)                       2263
  • Nottingham (Met Office 2001-2020)                       2067
  • Nottingham (Met Office +1.5°C warming)            1965
  • My Data 2023                                                            1826

One further factor is the “Base Temperature” used for calculating degree days. By default it is assumed that when the ambient temperature is below 15.5 °C a dwelling would require heating. Reducing the degree day base temperature would reduce the degree day value.

By fitting gas usage against degree days for a variety of base temperatures, and looking at the “coefficient of determination” or r-squared, which is basically a measure of how well the data fits, it is possible to determine (guess?) the optimum base temperature. When I did this it came out at 14.2 °C!

This lower value of “base temperature” might be because the house is now better insulated and heat from various electrical appliances (and the people in the house) now means that additional heating isn’t required until a lower temperature.

  • My Local Data @15.5°C  1826
  • My Local Data @15.0°C  1695
  • My Local Data @14.5°C  1575
  • My Local Data @14.0°C  1456

And the final result

  • 250 W/K * 1456 / 1000 * 24 = 8.7 kWh for 2023 compared with an actual usage for heating of 7.3 kWh.

Close enough ??


Well if you reached here congratulations!!

If you want to try my spreadsheet (ABSOLUTELY NO WARRANTLY WHATSOEVER) you can download it from

https://docs.google.com/spreadsheets/d/1_-K207rIZ7RYEJJ7EWbS9NFvxDgtYI1-/edit?usp=sharing&ouid=116393039538566870117&rtpof=true&sd=true


13 replies

Userlevel 4
Badge

One quick thought on the base temperature to use for degree days.

Using the spreadsheet mentioned in 

allows you to estimate the heating and water loads. You can change where you think the transition is from heating and water to just water heating.

In the graph above I guessed about 14 °C. The heating fit (red line) and water fit (blue line) cross at around 14.5 °C. However I noticed that I can change the transition temperature anywhere from 12 °C to 15.5 °C and the cross-over remains at around 14.5°C. This suggests that heating occurs only below 14.5 °C.

So maybe the correct base temperature for me to use is 14.5 °C!

Userlevel 7
Badge +5

A lot to review/take in @BeePee …

I presume the base temperature might be varied by location (sheltered or not, tree cover etc)? I’ve generally used a figure of 15deg but that is a rough view

Userlevel 4
Badge

I’m not sure. I can see that if my house has a heat transfer coefficient of around 250 W/K that the 100 to 200 W dissipated by various electrical appliances (plus 50 W per person?) then this could account for the 1 °C difference (15.5 to 14.5 °C). I can also believe that location could affect the heat transfer coefficient by reducing losses. Maybe location could improve solar gain.

Sorry don’t know.

Userlevel 7

Wow @BeePee! Fascinating read, lots to take in. Interesting to see the estimates based upon the amount of global warming.


If the ambient temperature is below 15.5 °C, I wonder what the general consensus would be for optimum temperature. The world health organisation suggests 18 is the ideal temperature for healthy adults. 

Userlevel 4
Badge

Thanks to @PaulWa for providing the link to the nhbc website regarding ventilation rates, which suggests much lower rates than the defaults in the MCS spreadsheet.

See my post Heating your home - (Correct) Size is important | The OVO Forum (ovoenergy.com)

I also managed to find information on the HSE website regarding healthy levels of CO2 in the workplace. It has a handy “rule of thumb” that 10 l/s ventilation equates to around 1000 ppm of CO2 per person (which is the recommended maximum level). 1500 ppm is considered high and can have detrimental health effects. So the levels in the nhbc document are rather low (if considered in isolation) but taken as a “whole house” are probably OK. I’ll have to crunch the numbers for our house.

Sad, but I have just ordered a CO2 monitor so I will be positioning it around the house try to to estimate ventilation rates based on two sedentary people (plus a cat)!

Hi,

I have a one bedroom apartment with electric heaters and the EPC came back as F (but only by 1 point off an E!) It was recommended to change the heaters to high heat retention storage heaters.  I am happy to do that, but feel it would be overkill in the bedroom (9.5 sqm) Do you know if I can still raise the EPC rating by only changing the living room heater (I will need 2 x HHR for the living room) and not the bedroom?

Many thanks for reading and I hope you can help me.


Christine 

Userlevel 3

I have the same heating arrangement in my flat. It is worth looking at other options beyond storage heaters which perhaps give the combination of stored and instant heat. The German Fisher heaters are worth looking at. Most of these type of heaters run from a standard 13A socket and don’t need tariffs such as Economy 7. While Economy 7 is cheaper during the hours it operates, the day rate is slightly higher than most single tariff options.

Not sure how the various options will effect the EPC rating so looks like you will need to do a bit of research and get some quotations for installing different types of heaters. Bear in mind changing heatings option may alter the load on the wiring and this may need to be updated too. Storage heaters are generally fed on a seperate curcuit to the ring main the feeds the 13A sockets in your home.

Userlevel 4
Badge

Hi @ChrisB1001 and welcome to the community! 


I can already see @DavidWSR has provided some really insightful information so far to consider! 

I just wanted to include a couple of useful links for you. Follow this one for our guide on EPC certificates.


Keep us posted on your journey and any decisions you’re thinking about! 

A problem, as I see it, with using gas boiler data to estimate required size for heat pump is that gas boilers (certainly ours) tend to be used with intermittent heating periods - on 6.30-9am and again 4.30-10.30am. The approach then seems to be to take energy used and spread it over 24 hours for the heat pump. Data for my house for 6 winter months looks like this:


Sorry, not pretty but you get the picture. The X axis shows temperature difference with target inside temperature of 20 degrees.

So this suggests a heat pump size of 7kwh. - right hand end of implied regression line cuts 7kwh at 23 degrees = minus 3 outside. This confirms the installers calculation based on house fabric/room size etc

But if I look at hourly energy use on a  minus 3 day then we see this:


Note that this shows boiler running through daytime as my wife insisted. Also the bars show energy used per half hour - a quirk of the Hugo app that I use - divide 173 kWh by the 16 hours of data and you see you need to double for kWh.

So my boiler works at around 10kwh during this period replacing heat lost and so suggesting that 7kwh heat pump is too small. But maybe the boiler is not on long enough to heat up the fabric of the house to reach a steady state?


So I will go with the suggested ASHP size of 7kwh and see how we go.


Any thoughts appreciated.

Userlevel 4
Badge

Hi @Martin53 

A couple of thoughts.

Firstly you are probably correct when you suggest that your boiler is spending the first part of the heating cycle replacing heat lost overnight. Although the air heats relatively quickly it takes much longer for the heat to get into the walls and fabric of the building.

Secondly the boiler is not 100% efficient (probably 90% if it's a recent condensing boiler, maybe 70% if it is an older "cast iron job"). The 7kW heat pump rating would be the heat provided under certain operating conditions, it could well be more (or less). So although you see 10 kW of gas consumed, you are probably only getting 9 kW into the house. Also some of the gas demand may be for hot water and cooking.

Modern boilers have quite a good turn-down ratio, so a 30 kW boiler might be able to reduce its output to maybe 4 or even 3 kW. When the demand falls below this low level the boiler will just cycle. Heat pumps are not as good at modulating down (modulation factor 2 or maybe 3), so a 7 kW unit would probably manage a minimum output of around 2.5 kW. This would match demand on a cool day (7 kW for 23°C difference, 2.5 kW for 8°C difference i.e. 12°C ambient). Heat pumps are not so happy cycling so it is best to match the pump to the demand and not over-size.

Although gas boiler are more efficient at lower flow temperatures the improvement in efficiency is relatively small (90% to 95%). With a heat pump the increase in efficiency with lower flow temperatures can be dramatic (200% to 300% or better), so it is important that the system runs at as low a flow temperature as is reasonably possible. This generally means ensuring that radiators are capable of providing enough heat at 50°C or even 40°C flow temperatures. Running at a lower flow temperature will also mean that it may take longer for rooms to heat up.

Hi @BeePee 

Thanks, all useful comments. I've also convinced myself that the tail off in energy use by the gas boiler at around 10pm is a sign the the fabric of the house has reached the required (20 degrees) temperature, so it's reached steady state with (reduced) boiler output matching loss from the house. It's now well insulated so I was hoping for this.

Then the heating goes off at night-time, the air and fabric cool down and so the process starts again the next day.

Of course a better test would have been to run the gas boiler continuously for a few days during a cold spell to see what steady state energy requirement would look like. But it's too late so we'll see how the heat pump performs and whether the insulation to 1905 house - loft, ewi, underfloor, draught proofing, vacuum glazing, chimneys filled - has been worthwhile.

Thanks again.

Userlevel 4
Badge

Hi @Martin53 

Maybe the following graph might help.


It show the temperature in our study (blue line) and the outside temperature (red line). When the heating turns on the air temperature quickly reaches steady state (after a small over-shoot). When the heating turns off you can see the room slowly cooling down to a minimum of around 14°C. The cool-down basically follows the temperature of house fabric, whilst the heat-up is determined by heat from the radiators warming the air.

Newer houses tend to have a smaller “thermal mass” since the internal walls tend to be stud timber and plasterboard.

Older houses will tend to be much more solidly built with internal brick walls. They will tend to hold on to the heat much better, but will also absorb a lot more heat getting up to temperature.

Hope this helps

B

Hi @BeePee That's really useful, seeing real data rather than just theory. We have ewi on half of our house (party wall on another quarter) so I guess the heating up of the walls takes longer (than iwi or cavity) but so does cooling down. I'm going to have fun playing around with temperature settings and optimising tariffs.


From my data shown earlier, it seems that the fabric/walls take around 8-10 hours to heat up and reach steady state which is when the heating can ease off. Of course if the heating is on overnight with the ashp (all be it at a lower temperature to aid sleeping) then then this cycle should largely disappear so heat input will stabilise at a lower level.


I'm looking forward to the extra data available from the smart controls

Reply