I would like to know how much night usage vs day usage I consume on an annual basis as a ratio figure. My OVO plan expires in Feb and this data would be helpful when looking at alternative suppliers. Analysing every bill I guess would offer this info but it’d take ages and I’m hoping there is an easier way.
To use the calculations below you’ll need to visit the ‘Meter Readings’ section of your online account / app. We’ve got some handy guides here:
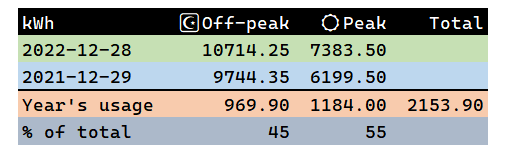
At the account website, you should be able to see meter readings for the last 400 days or so. So, to compare peak and off-peak usage over the past year, note the latest readings for ☪ and 🔆, then scroll down a lot to find the ones from a year ago. The difference between the ☪ readings will give you the year’s off-peak usage, and similarly for the 🔆 readings. Add the two differences together to get the year’s total usage. Like this, perhaps:
For Economy 7 to be worthwhile, you’ll probably find that the off-peak percentage (here 45) has to be at least 40% of the total.
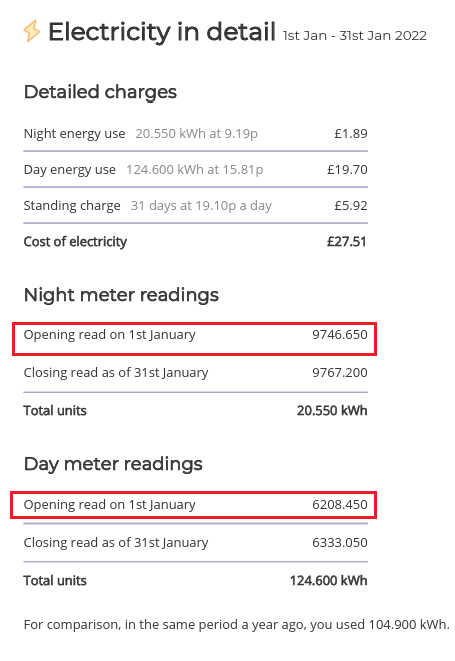
PS. If you don’t see meter readings online, you really only need two bills - the latest and one from, say, a year ago. You’ll find the actual meter readings on the bill, and that’s what counts:
Noel | I have no official status; I'm just a volunteer who comes here to help other customers. My gear: Aclara SGM 1416-B Electricity-only E7 meter; Chameleon IHD3-PPMID-AAA | It may look as if I know what I’m talking about, but don’t let that fool you. |
If you’re looking for alternative suppliers based on price alone, it’s not worth doing. The fact that fixed rate deals currently don’t exist means that basically everyone is charging the same at the moment. That’s unlikely to change anytime soon either.
The chances of you getting a better deal elsewhere right now are basically zero. To be brutally honest, your best option is just staying with OVO for the time being.
Securing energy by zapping security bugs... For that is The Blastoise Way! Remember, I'm just like you - AI Powered Evil Geniuses aren't Staff!
If you have a smart meter that reports every half hour the data you want does exist. The problem is how to get hold of it in a form that you can use and I don't think there's a way to get old data. So I'm not sure there's a way to do what you want.
As for alternative tariffs, there are companies offering tariffs with cheap periods. I would have a look at what Octopus can offer.
1992 4 bed detached house. Solar PV + battery, Zappi EV charger, Mitsubishi Ecodan ASHP and i-life2 fan assisted radiators.... No gas 😊
Thanks for replying. I don’t have a Smart meter. I am looking at alternative suppliers but they invariably ask for the breakdown of night and day usage - hence my question.
To use the calculations below you’ll need to visit the ‘Meter Readings’ section of your online account / app. We’ve got some handy guides here:
At the account website, you should be able to see meter readings for the last 400 days or so. So, to compare peak and off-peak usage over the past year, note the latest readings for ☪ and 🔆, then scroll down a lot to find the ones from a year ago. The difference between the ☪ readings will give you the year’s off-peak usage, and similarly for the 🔆 readings. Add the two differences together to get the year’s total usage. Like this, perhaps:
For Economy 7 to be worthwhile, you’ll probably find that the off-peak percentage (here 45) has to be at least 40% of the total.
PS. If you don’t see meter readings online, you really only need two bills - the latest and one from, say, a year ago. You’ll find the actual meter readings on the bill, and that’s what counts:
Noel | I have no official status; I'm just a volunteer who comes here to help other customers. My gear: Aclara SGM 1416-B Electricity-only E7 meter; Chameleon IHD3-PPMID-AAA | It may look as if I know what I’m talking about, but don’t let that fool you. |