
I hereby start a new thread, with a link to Open Energy Monitor.
I blame the interest shown by

I hereby start a new thread, with a link to Open Energy Monitor.
I blame the interest shown by
Routing joints into oak beams is a very slow process.

But it’s good therapy. ![]()
Three weeks ago
But I’ve just been forcibly reminded that Ovo is still sometimes presenting me with negative values for daily gas usage.
Given the enormous rise in the price of gas over the past months, are you now able to ‘sell’ this gas export back to OVO at a profit? ![]()
Please don’t think such suggestions haven’t been made regularly, around here, over the years ...
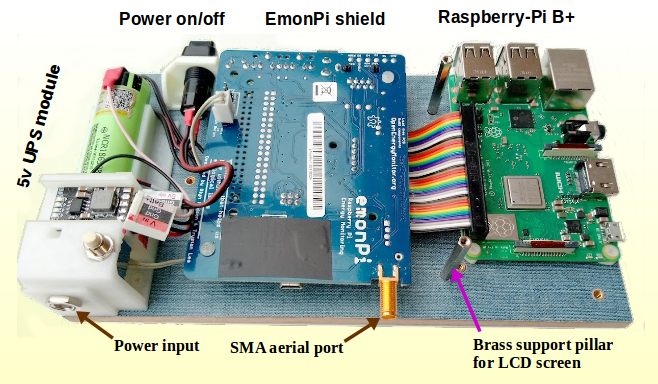
The majority of component parts for my own Energy Monitor have now arrived:
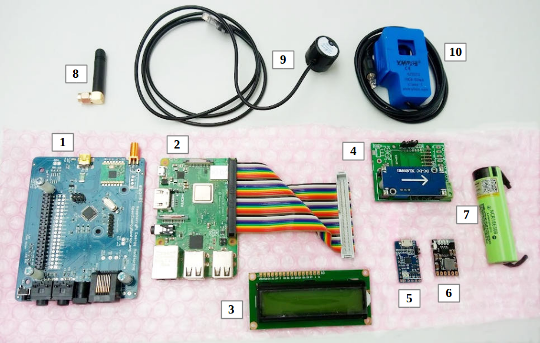
Power-supply and connecting leads between modules not shown in this photograph. The pink bubble-wrap is an anti-static layer to prevent damage to sensitive electronics.
Nice. Depriving yourself of the stylish Al case - or is that still on its way?
This lot wouldn’t fit in a ‘standard’ Rasp-Pi enclosure.
As I have a workshop with a 3D printer, I’ve decided to depart from the usual layout and build a case into which everything fits.
This can then be wall-mounted in a position (red dashed area) with close access to the circuits being monitored and the ModBus-style energy meters.
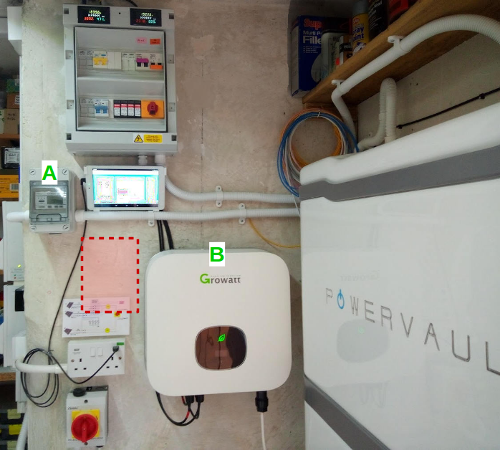
Both the battery export meter A and the Growatt solar inverter B have Modbus ports, currently unused.
I’ll provide some basic level of information on the Energy Monitor construction here so that others can follow.
I’m hoping that other distractions (new boiler, missing data games) will calm down soon, and I can get back to Emonpi.
Last I remember, I was struggling to tweak the pulse counting. I’m looking forward to hearing how pulse counting works in your setup for you,
Thanks for discussing energy monitoring devices. Personally, I feel the need of a good energy monitoring system because I do not have a way to gauge the energy consumption except for the electricity bill.
Thanks
Well
I’m making no assumption that you’re an OVO customer, because lots of people here aren’t. So let’s keep this general for the moment.
Give us some more bits of background information please:
1: Do you have a Smart Meter with an In Home Device (IHD) to show you your energy consumption?
2: Do you use the online accounts page to track your energy usage from day to day?
3: Do you want energy monitoring to help with keeping costs low, or are there other aspects of monitoring which you’re interested in:
Thanks for discussing energy monitoring devices. Personally, I feel the need of a good energy monitoring system because I do not have a way to gauge the energy consumption except for the electricity bill.
Thanks
Perhaps surprisingly, I read your comment
For those who worry about gas as well as electricity ...
I don’t know of any easy way to get better information than the 30 minute resolution data that our smart meter infrastructure provides. Instead of something easy, I’m reduced to spending time, pressing buttons on my gas meter at frequent intervals, just to find out exactly what my new boiler is up to, gas consumption-wise, on shorter timescales than that. (Ok that is easy, but it is really really tedious.) For example, I would really like to know if the boiler is cycling. (For example, by burning for 40 seconds at a time, but only doing that once every 5 minutes. That’s what it ends up doing, and I don’t need to make a detailed measurement to know that that is really inefficient.) That kind of thing really ought to stick out like a sore thumb, but with the kind of monitoring that is standard, it doesn’t.
Perhaps, when the new system is fully set up, it will provide me with some extra information, but I’m far from sure about that.
In the meantime, I’m reduced to setting the old (and soon-to-be-replaced) programmer to make HW come on for only 10 minutes at a time, once an hour. My money’s on that solving the cycling problem (because, from a cold start, the boiler will burn continuously for almost 10 minutes), but really - should I have to be doing this?
For example, I would really like to know if the boiler is cycling.
And please note
That’s the benefit of a Forum like this. You can get to read different ideas and then decide which best fits what you’re looking for.
For example, I would really like to know if the boiler is cycling.
And please note
That’s the benefit of a Forum like this. You can get to read different ideas and then decide which best fits what you’re looking for.
FWIW, my solution doesn’t require live monitoring either - the cylinder is being replaced next week, the new one has two heating coils instead of one (solar thermal panels too, maybe, in a few months), and they are more efficient, to boot. And, just because it’s obviously a good idea, I’ve asked the installer in the meantime, pending the possible installation of those solar panels, to connect up the second coil in series with the first. If I can increase the efficiency of heat transfer between boiler and hot water cylinder, why would I not do that? And yet, such details are, so far as I can tell, not standard practice.
Anyway. I’ll bet that solves the cycling problem. In the meantime, I’m in observe and interpret/understand mode. I can wait till next Wednesday for a more intelligent solution…
But this forum (and other fora elsewhere, specialising in different aspects) are where such ideas are worked out, tested, exchanged, and evolve.
The majority of component parts for my own Energy Monitor have now arrived:
Power-supply and connecting leads between modules not shown in this photograph. The pink bubble-wrap is an anti-static layer to prevent damage to sensitive electronics.
Wow it’s arrived - very exciting!
I’m looking forward to hearing how this project evolves, now that you’ve got some hardware. If you’re able to get valuable, reliable data and therefore insight into your electricity usage, I’ll be sharing the news of this project throughout OVO to show what is possible.
Yes this isn’t something we’ll expect our members to replicate, but it looks like powerful collaboration and DIY innovation to me!
...
Can I ask that we leave this Monitoring subject alone here, rather than get distracted from solar panels. If anyone knows more about Modbus networks and the SCADA software used to handle the commands and data, then please send me a PM ![]()
Energy monitoring needs to be a separate topic on its own.
I can’t help with modbus, but see that it’s mentioned by a fair few users of the Open Energy Monitor system on their forum.
A separate thread on energy monitoring could perhaps start by looking at OEM (if there would be any interest here...)
And
Or would this be more specific to generation?
Node-RED has some quite active modbus users and contributed nodes.
New thread now combined with related comments. In case this is missed,
Yes, I’ve looked at this in the past. The cost made it a little too rich for me to invest in since our needs are very simple.
I’ve always meant to get round to making up a simple sensor that can count the LED flashes on our electric meter. Just never quite made it to the top of the to-do pile though ![]()
There is something you could do for us all please
Whilst researching the matter of Energy monitoring and data-logging over the past three years, I’ve several times come across online comments mentioning Node-RED.
It wasn’t relevant when my research concerned substation monitoring on the OpenLV Project, because Node-RED wasn’t certified for use in that environment.
But it could save the rest of us some time if you give us an overview and explain why Node-RED popped up in connection with monitoring.
Thank you.
Hello energy monitor pioneers,
I wanted to check in on this thread, after seeing some of the fantastic insight
From this, I’m able to presume that your energy monitoring systems are in placed and working?
There is something you could do for us all please
Whilst researching the matter of Energy monitoring and data-logging over the past three years, I’ve several times come across online comments mentioning Node-RED.
It wasn’t relevant when my research concerned substation monitoring on the OpenLV Project, because Node-RED wasn’t certified for use in that environment.
But it could save the rest of us some time if you give us an overview and explain why Node-RED popped up in connection with monitoring.
Thank you.
Hi, sorry about the delay in responding.
Node-RED is a “low-code” development tool. It lets people create processes for automation and information processing without needing much, if any programming knowledge. It uses a flow-diagram kind of approach where you draw out a sequence of tasks in an editor and connect the tasks together with lines. For the technically minded, this is called a “graph” (the things most people think of as graphs are actually “charts” ![]() ).
).
We describe the process as a “flow” with “messages” “flowing” between the tasks (which are called nodes - hence that part of the name).
It is actually easier to understand when you see it than it is to describe it in words! There are some great introduction videos on YouTube for those that want to learn.
It started as a tool developed in IBM for working in the field with Internet of Things but has since flown the nest and was gifted to the JavaScript Foundation and is fully open source and free.
It has also been embedded in all sorts of places. For example, a lot of people who use Home Assistant for home automation use the Node-RED addin because they can do some really complex processing very simply without any code needed. A number of commercial systems now also have Node-RED embedded to enable users to create automations and data-processes without coding. Siemens, Hitachi and various others are doing this.
Node-RED is all based on JavaScript and it is quite easy for people (like myself) to contribute nodes. There is a thriving community of developers and thousands of contributed nodes that do all sorts of tasks whether interacting with external systems like Hive, Nest, Alexa, etc; Comms services such as Telegram, Email, WhatsApp, etc and much more.
It comes with a very easy to use User Interface development tool called simply “Dashboard” that also requires no programming knowledge. Of course, that inevitably has some limitations once you want to get more complex processing and interfaces. That’s where my own main contribution comes in, “uibuilder” - which lets you use standard web development knowledge to easily build data-driven web applications.
I also developed a module that can be used in Node-RED and other Node.JS (a JavaScript-based server that Node-RED is built on) applications that talks to the Drayton Wiser smart heating controller. It lets you get the latest info, listen for changes (so that you can trigger other actions) and update settings.
Node-RED was originally built around the use of MQTT - which is a service that you can send messages to and allows other systems to subscribe to such that they get updates when information is updated. MQTT is lightweight, easy to install and works on very limited platforms such as Raspberry Pi’s (as does Node-RED) and is ideal for IoT systems including, of course, home automation. Many commercial and open source systems and services use MQTT as a message broker. For example, the Shelly remote switch modules have MQTT options. This allows smart IoT modules to have a standard way of exchanging information and Node-RED can take full advantage of this.
Here is a typical example of a simple flow in Node-RED that does some lighting control:
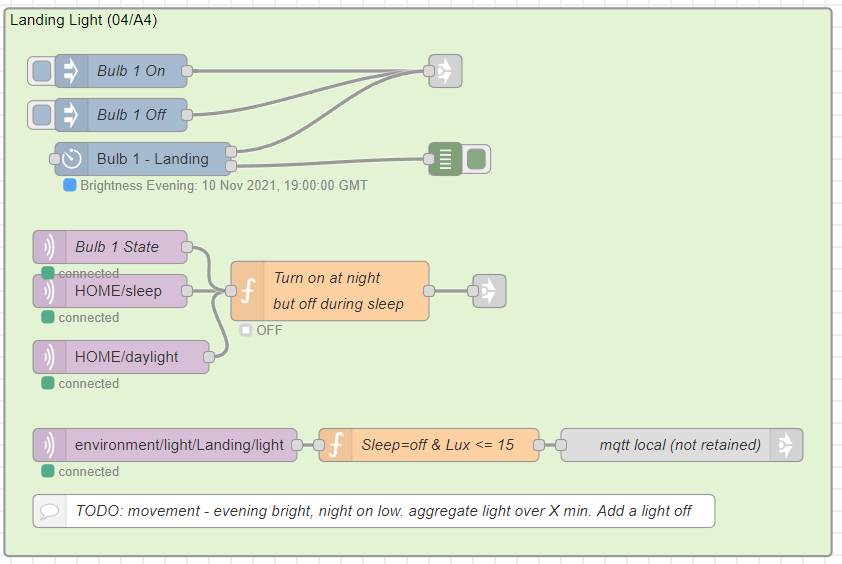
As you can see, it makes extensive use of MQTT (the pink and grey nodes), timers (the 3rd blue node). Many of the MQTT subscriptions are listening for messages created by other flows. Such as the daylight on/off message that is generated by another node that knows about sunrise and sunset. You can also see in the bottom orange node (which is some JavaScript code - you can easily include custom code in a flow) that the flow is also listening to updates from a custom sensor that I built that sends out information about temperatures, humidity and light levels. The light is turned on if the light level falls too low unless it is sleep time.
Here is another example that shows how simple it is to do something really useful. This sends a warning message to Telegram when the front door is opened or closed.
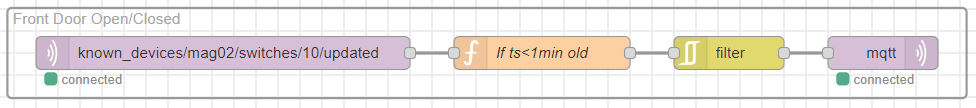
The actual output to Telegram is another flow that listens for a particular MQTT message. I use a lot of function nodes because I know JavaScript but if you don’t, you can use a few simple extra nodes.
Node-RED also has a thriving forum which is one of the friendliest forums on the Internet (and I’ve used a LOT of forums over the years) where beginners and experts alike share and ask for help. The core developers are always on there in addition to a bunch of other regular contributers like myself.
Tagging in
...
There were a couple of days in May when DCC may have had problems, because Hildebrand’s Bright app is missing data too (albeit at slightly different times). Zooming in a lot:
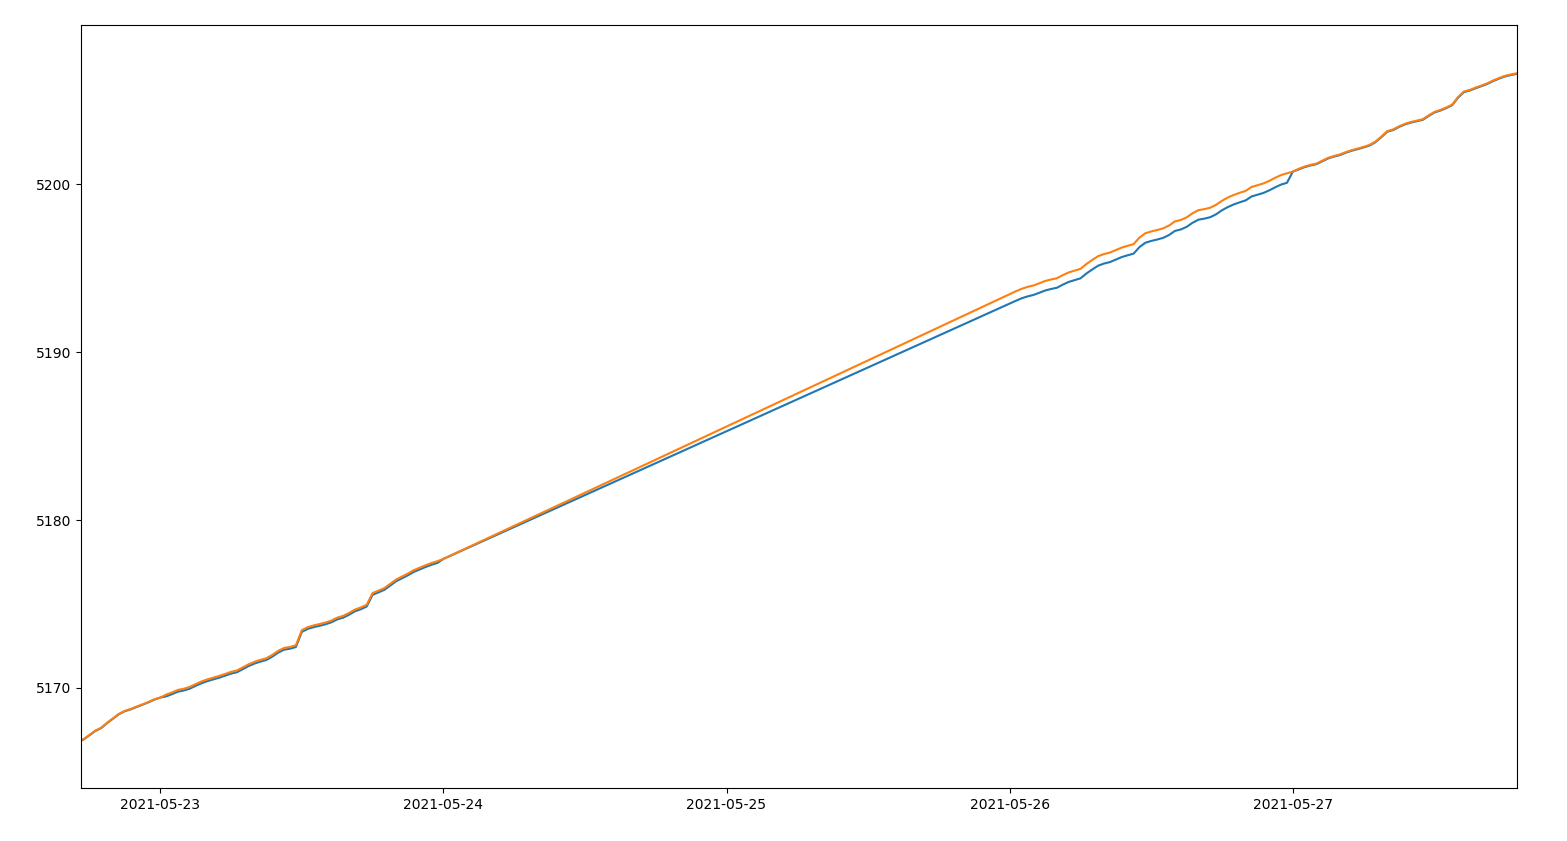
The difference between these bounds, in kWh, is plotted in the graph below - it’s always within 1 kWh of zero, and the missing data in May results in the largest positive spike, to the heady heights of 0.6 kWh.
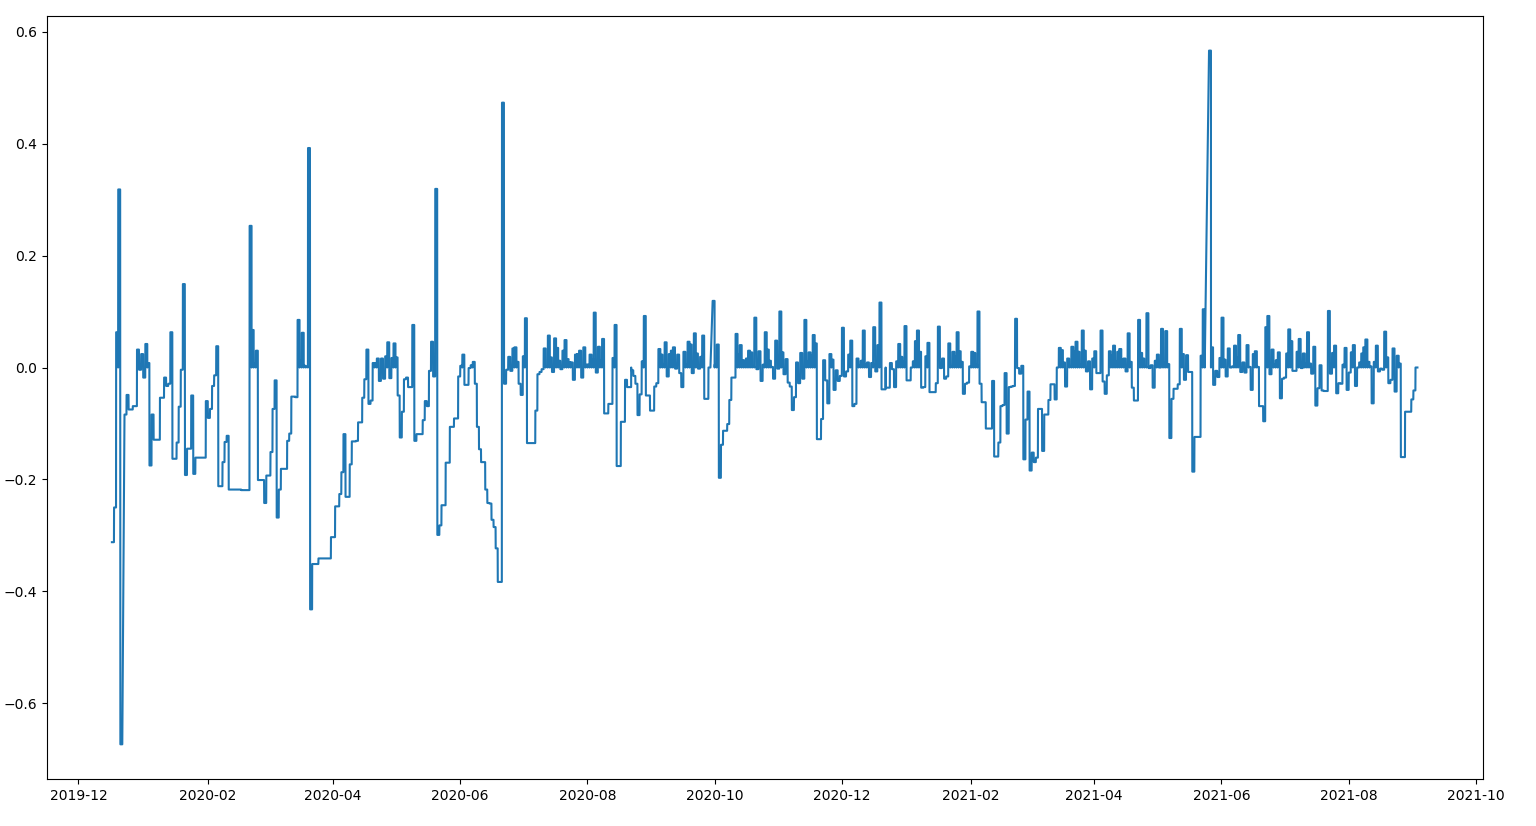
The more I read about this, the more I am getting the feeling that the whole smart meeting system is poorly designed. There should not be any deltas in the whole system, it should all be based on meter readings. As you show nicely, the mixed use of both leads to huge complexity and uncertainty that could easily be avoided by only using meter readings *with decent resolution*. If a meter reading is missing, the uncertainty is completely bounded by the next two meter readings, but if usage data is missing, the uncertainty could span over very long times.
I do agree. However, as they say,
We are where we are.
... and I can only speculate on the colloquial name for the waterway we've arrived in and how, precisely, our equipment might be lacking …
;-)
End of November so it’s time for a progress update.
My energy monitor still under construction on a HDF (high-density fibreboard) base with a plastic facing.
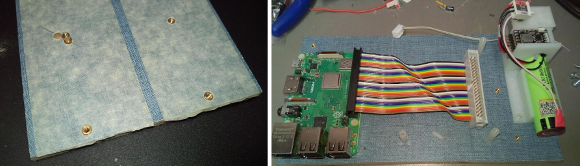
The technique I’m using is to mark out the modules’ fixing points on masking tape. The required holes are drilled (mostly 3.8mm) and then a brass nut-insert hammered into place.
These enable the individual modules to be fixed into place using M2.5 nylon bolts and standoff pillars.
OOOOOOOOO wow serious looking stuff.
Have you already outlined what this computer power is going to be doing? I’m really looking forward to seeing this (literally) take shape, and then see the data it produces (if you’re happy to share it on the forum that is!) - keep us updated!
Another piece of the jigsaw prior to assembly:
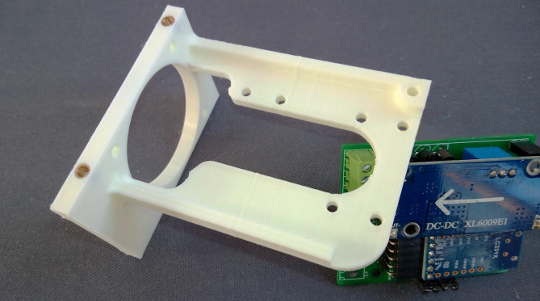
This view shows brass nut-inserts encapsulated within a 3D printed part.
Have you already outlined what this computer power is going to be doing?
Yes. Monitor everything!
It’s going to be sited alongside my consumer unit, PV Inverter and PowerVault battery, and be connected to the Smart Meter on the other side of the exterior wall. Then I can clip current transformers onto whatever wires are of interest.
I want to be able to run ‘short’ experiments to get a much better idea of what goes on between the half-hour chunks recorded by our Smart Meters.
We should be able to take about 100-readings per second, depending on the number of sensors deployed at that time. So if there’s any tussles between my inverter and the Storage Battery for example, then this monitor will pick up the transients/spikes.
No account yet? Create an account
Enter your E-mail address. We'll send you an e-mail with instructions to reset your password.