Why does the usage shown whilst my property was empty vary from day to day?
I do have another query, I was away from midday 19th December and returned at around 5 pm on 3rd January , so as my home was empty during that time I expected the usage for 20/12/2021 to 2/01/2022 to have been exactly the same but it isn’t and I would like to know why this is
Page 1 / 1
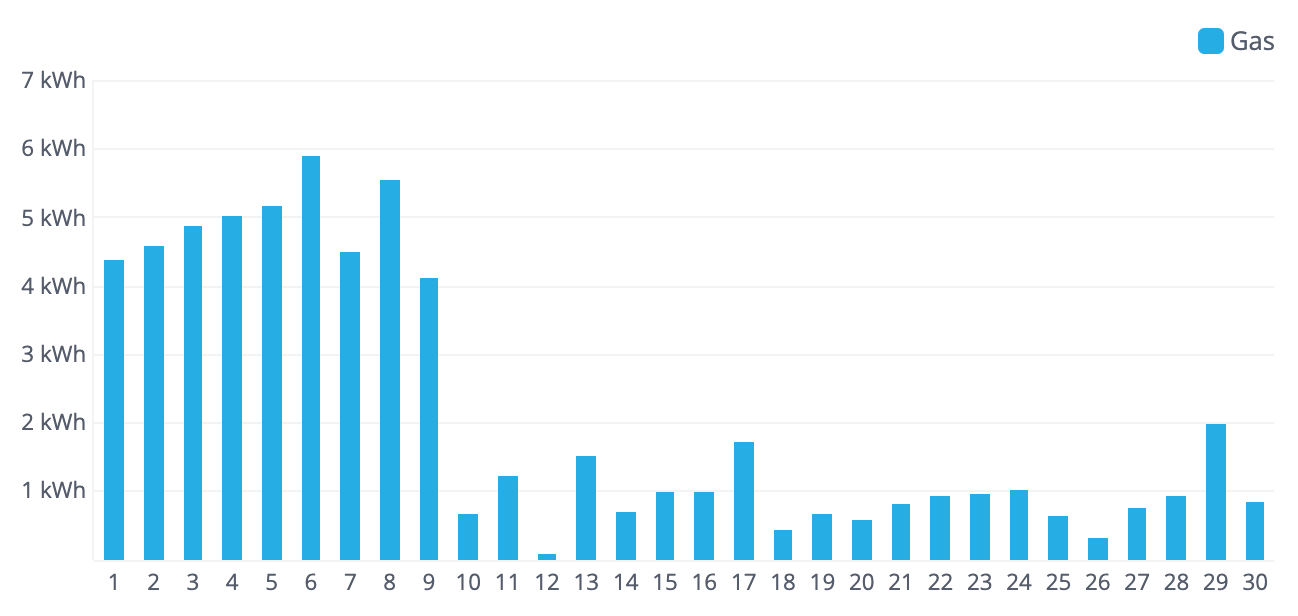
@Cefynbach that’s a bit of a ‘how long is a piece of string?’ question as it depends entirely on whats connected to your gas and electricity. However, last year I stopped using my gas central heating (but I hadn’t switched off the pilot light) and thought I was just used gas for my hob. I was amazed to see how much the pilot light was using. When I was getting through more than 100kWh of gas for heating the odd 4 or 5kWh per day wasn’t visible. As you can see the pilot light was turned off on the 10th. The cost of the gas on the 6th was 18p.
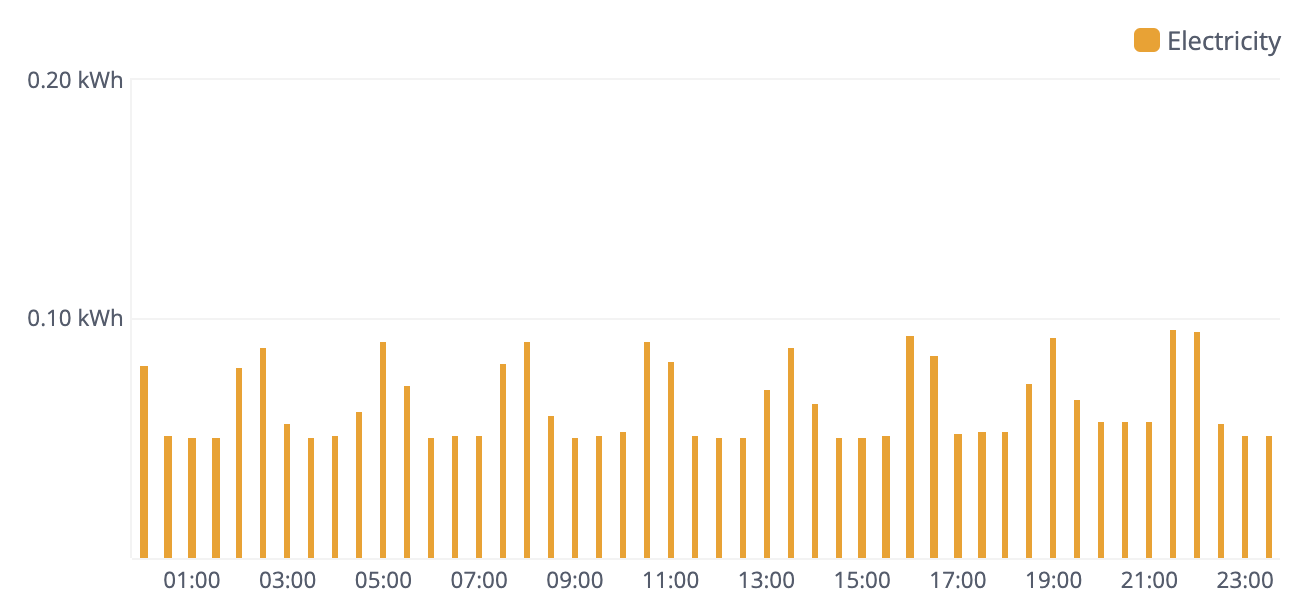
Similarly, it’s not till you switch everything else off that you’ll see what the fridge uses. This is a day in July when the only thing running was the fridge, and I presume the PVR.
That day was a total of 3.1kWh for electricity and cost me 50p.
Think you are missing the point here I only have electricity in my house and my house was uninhabited between 12 noon 19/12/21 till 5 pm 3/1/22 , so I can’t understand why all the days between wouldn’t use the same amount of electric as there would be nothing being turned on and fridge and freezer weren’t being opened
Updated on 14/09/23 by Abby_OVO
Sorry @Cefynbach I didn’t know you didn’t have gas ! The chart I showed ref my electricity was when I was on holiday - fridge shut the whole time.
I just looked this up on confused.com A fridge-freezer with an energy rating of A might use 408 kWh per year. This is just an example of course. Looks like mine’s not performing very well .
...and you’re quite right I did miss the point. What else might you have had plugged in ? Anything on standby eg for tv recording ? Security light on random ?
@Cefynbach Is OVO your energy provider ? You should be able to see the daily usage graphs on the MyOVO web page (or the app) for those days in question and they might give a clue as to what was going on.
Fridges and freezers don't always use the same amount of electricity all the time. The compressor will start and stop periodically. This means the exact amount of electricity used each day might not be the same. What's the difference in the amount of electricity you used each day?
@Cefynbach Is OVO your energy provider ? You should be able to see the daily usage graphs on the MyOVO web page (or the app) for those days in question and they might give a clue as to what was going on.
well I would have thought as you are an OVO person you would be apply to see what my graphs are showing.
Actually I don’t think you are even bothering to help me understand what went on
Wendy
Actually Wendy I’m not an OVO person, I”m a mere OVO customer trying to help you. I can’t see anything about you at all unless you write it here.
Sorry Juliamac I didn’t realise that basically on the 13 days the house was empty the average daily usage was 2.91 kwh but when I got back and was cooking, washing, watching TV etc as normal it was only a daily average on the next 13 days was 5.87 kwh and as you can see that is only about twice as much which doesn’t seem right
2.91 kWh is only 121w for 24 hours, which isn't very much. OVO can't tell what appliances you've got that are using that electricity.
If you think your meter is wrong, this thread explains how you can check it yourself.
@Cefynbach have you looked at the graphs that show the half hourly usage over those days you were away ? Has that shown what pattern or time of day the electricity was used ? Did you switch off all hot water and heating ? Some heating systems still have a low background output to prevent freezing. Only you know exactly what electrical goods you have.
Thanks @juliamc didn’t realise that it showed that, just had a look and still doesn’t make sense as there is hardly any difference between before midday and after midday but just realised that actually I would have left my tv box on standby to record a few things but that would have been evening things, so surely it should have been higher than
@Cefynbach how do those days compare with days when you were at home ?
Those days when you were away and your average use per day you say is 2.91 kWh sound like that’s just the fridge (compared to my 3.10kWh for my fridge that is). I don’t think TV stuff uses much energy, so probably wouldn’t have registered on the graph.
Reply
Need advice from other members?
Ask your question to our members - they have the experience you're looking for: