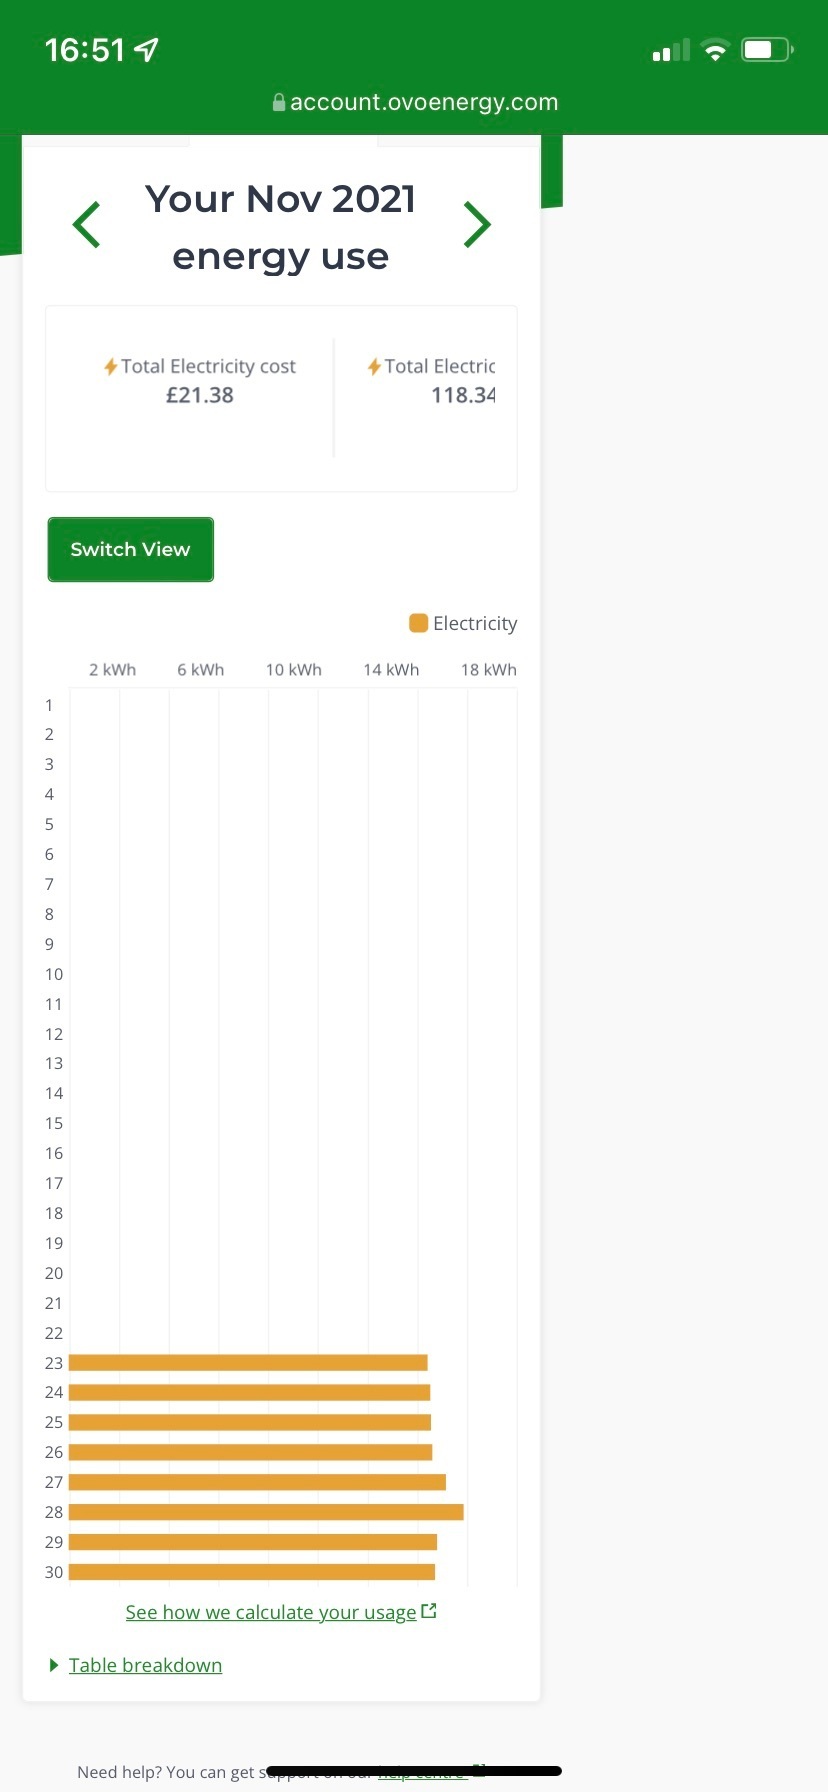
Why do my online usage graphs show I was using energy during a power cut?
I noticed that I was charged electricity during the 5 days outage as the smart meter sent the same data daily as the last day we had power, so I ended up paying almost £2 a day for a service I did not receive, SSE paid compensation for the inconvenience, and the girl I spoke to seemed to indicate that the compensation also included and payment we would have made for electricity not supplied - this seems wrong and separate issues as this means folks with smart meters paid a daily rate for the electricity they did not receive and those without smart meters didn’t.
seems wrong - OVO must have received tens of thousands from lots of customers for a service not provided - I want to take this up with Ofgem and it is not a fair practice
Page 1 / 1
Updated on 18/09/23 by Abby_OVO
Hi @paulbrash .
Was this on OVO’s side or SSE’s side of things? Your post isn’t quite clear so I’ll have to assume it could be either one for now.
If you’re purely looking at the usage data, please bear in mind that this is only a guide and is not used for billing purposes - only the actual meter readings are taken into account. If your meter isn’t spinning at all on a particular day due to an outage, the only charges you’ll rack up (at most) would be the Daily Standing Charges, but the Usage Charges for that day should be zero. MyOVO will sometimes try to estimate usage for any day where it doesn’t have usage data available, but it will correct itself for the billing purposes once the next actual meter reading comes in - and this can automatically wipe out any overcharges caused by the estimates. This rule is the same regardless of what kind of meter you’ve got.
I should probably also mention that while OVO might have some of your cash in the bank, they cannot do anything with it until you’ve actually spent it and this only happens after a bill is generated. Any and all spare credit has to be ringfenced and the only thing OVO can do with it in the meantime is simply keep it safe and either withdraw what you’ve actually spent and throw that into the main accounts, or send it back to you if you ask for a refund. Otherwise it just sits there waiting for something to happen. This isn’t profit per se, because OVO cannot readily use it for any other purpose.
Of course, if the billing does get out of line due to an outage like this, OVO and SSE will indeed be happy to issue refunds if needed. But please bear in mind that the usage graphs alone for any supplier, your In-Home Display and any apps/web dashboards should not be relied upon for billing purposes. It’s all about the meter readings.
If you’re still unhappy, you cannot go to Ofgem about this as your complaint will bounce back. Please follow the complaints processes for OVO/SSE depending on which side you’re on and if you still can’t resolve it you’ll want to go to the Energy Ombudsman rather than Ofgem.
It is OVO and I assure you I have been charged
Whilst I am not concerned about the few pounds I want clarity and I mean energy ombudsman rather than ofgem
Actually, that’s just your usage graph that you’re seeing there. It’s only a guide and is not something that’s linked to the actual bill. As mentioned, the graph uses estimates for any day where it didn’t have any data. The system doesn’t know why the data didn’t come in and it can’t know that you had a power outage, so it just gave you its best guess on those graphs. To verify how much you actually used and were actually charged, please refer to the bill for that month. You’ll probably find it’s a little bit lower than what the graph says.
It looks like you’re on iPadOS, so if you grab the OVO Energy app for iOS (which does also work on iPadOS) you can use that to check your actual meter readings under Account > Meter Readings. If there’s none for the days of the outage, or there are but they all stayed the same, that will help to prove you’ve not been charged.
This sounds like an account specific issue though, so I’m unable to do anything to adjust the figures or regenerate your bills.
Why was my usage no different even tho I was away for 2 days? Unplugged all unnecessary appliances and only had boiler on for one hour on timer per day. Usage was even more on one day than when I was in the house?
Do you have a smart meter giving half hour or daily readings? Any less than that would mean your usage figure is averaged out across the days between readings
@carla.mark you should also check if your usage is based on actual or estimated readings
I have a smart meter
Half hourly readings
I have a smart meter
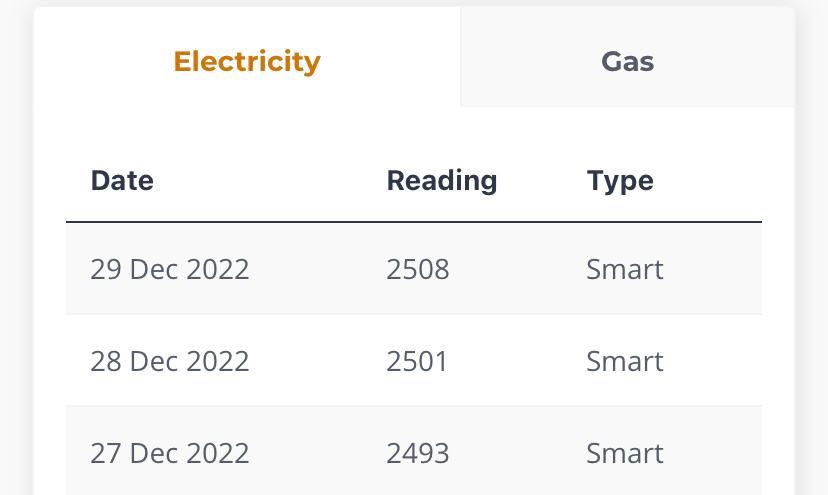
But are the readings used for your usage taken from it or estimated? You can see on the page of your meter readings
Like this
Thanks BPLightlog. Mostly all Smart but lay one (15th Dec) estimated. Looks like I have some missing readings
As 31 December to 5 January there is no one at home, why the electricity meter chat showing on my account had used the same amount electricity as normal day?
You should check your meter readings @LkS . They might be estimated rather than actual
Hey @LkS,
Welcome to the OVO Online Community,
You should check your meter readings @LkS . They might be estimated rather than actual
I’d advise checking the readings themselves, this is what you’ll be charged too.
These articles might be helpful:
Hope this helps.
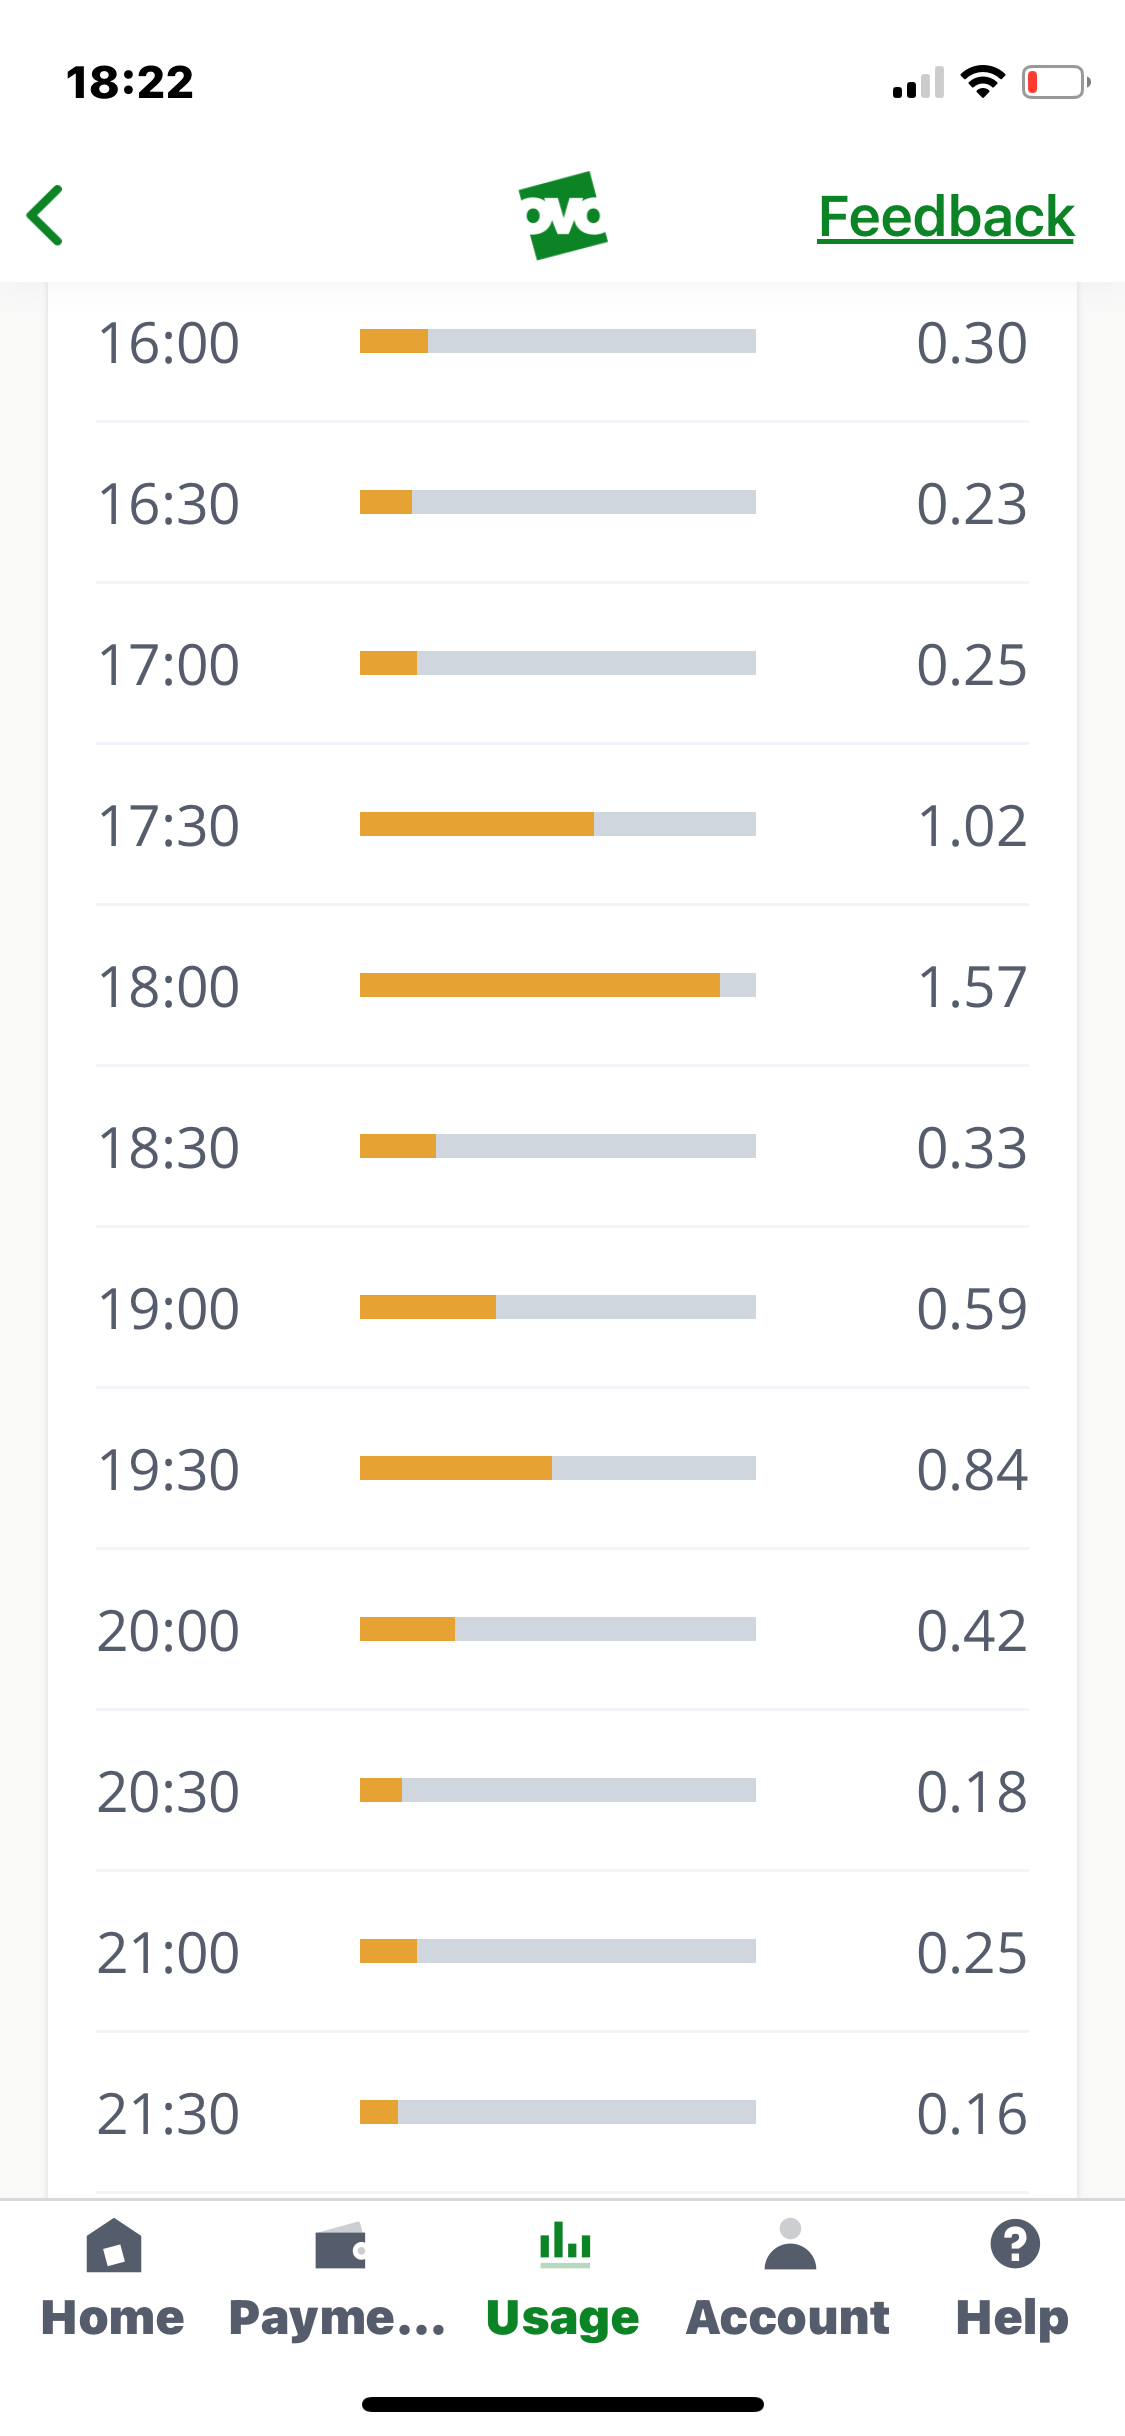
Why is it showing on my usage for the day used gas and electric, before that time has come
Hi @ayoung1966 if you’re talking about your in home display, it’s probably the standing charge that pops up first thing
No it’s on the online account usage
Ok - are you sure you’re looking at the right day. The current day is not normally showing on that screen
Yes definitely correct day
So it’s showing a time slot in the future, @ayoung1966? How many hours into the future?
The time of picture is at the top 18:22
the gas was the same showing usage before time reached
The time of picture is at the top 18:22
the gas was the same showing usage before time reached
Ooooops thanks @ayoung1966 I should’ve spotted that!
If you’re certain that you’re looking at the current date when on that usage chart, and it’s providing half hourly slots of usage data into the future, I’ve never heard of this issue and it would be great to get this flagged to our Support team here. You can just copy a link to this topic to save you having to explain anything again.
Thats great thank you for your help
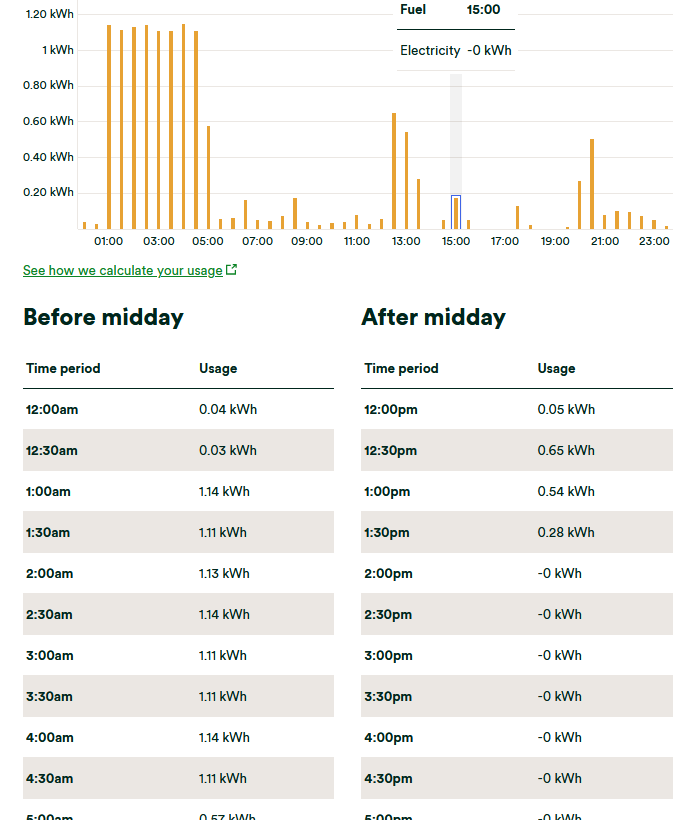
I had a similar issue where we had a serious outage between 13:00 and 17:00 (ish) and the graph suggests that we could have been using electricity when we weren’t. It does seem that the graph is for illustration when there is an outage and when you hover on one particular HH period it does indicate the correct usage as zero.
BTW: When the power did come back the lights were dim and flickering quite noticeably all the time and there was only two of the three phases as some of my near neighbours in the same road had power and some were using candles / torches. My car also refused to charge as my Garo Open PEN unit refused to supply power suggesting that there was no protective Earth/Neutral back to the substation. I’ve never had a outage / partial restore quite like that before.
Reply
Need advice from other members?
Ask your question to our members - they have the experience you're looking for: