
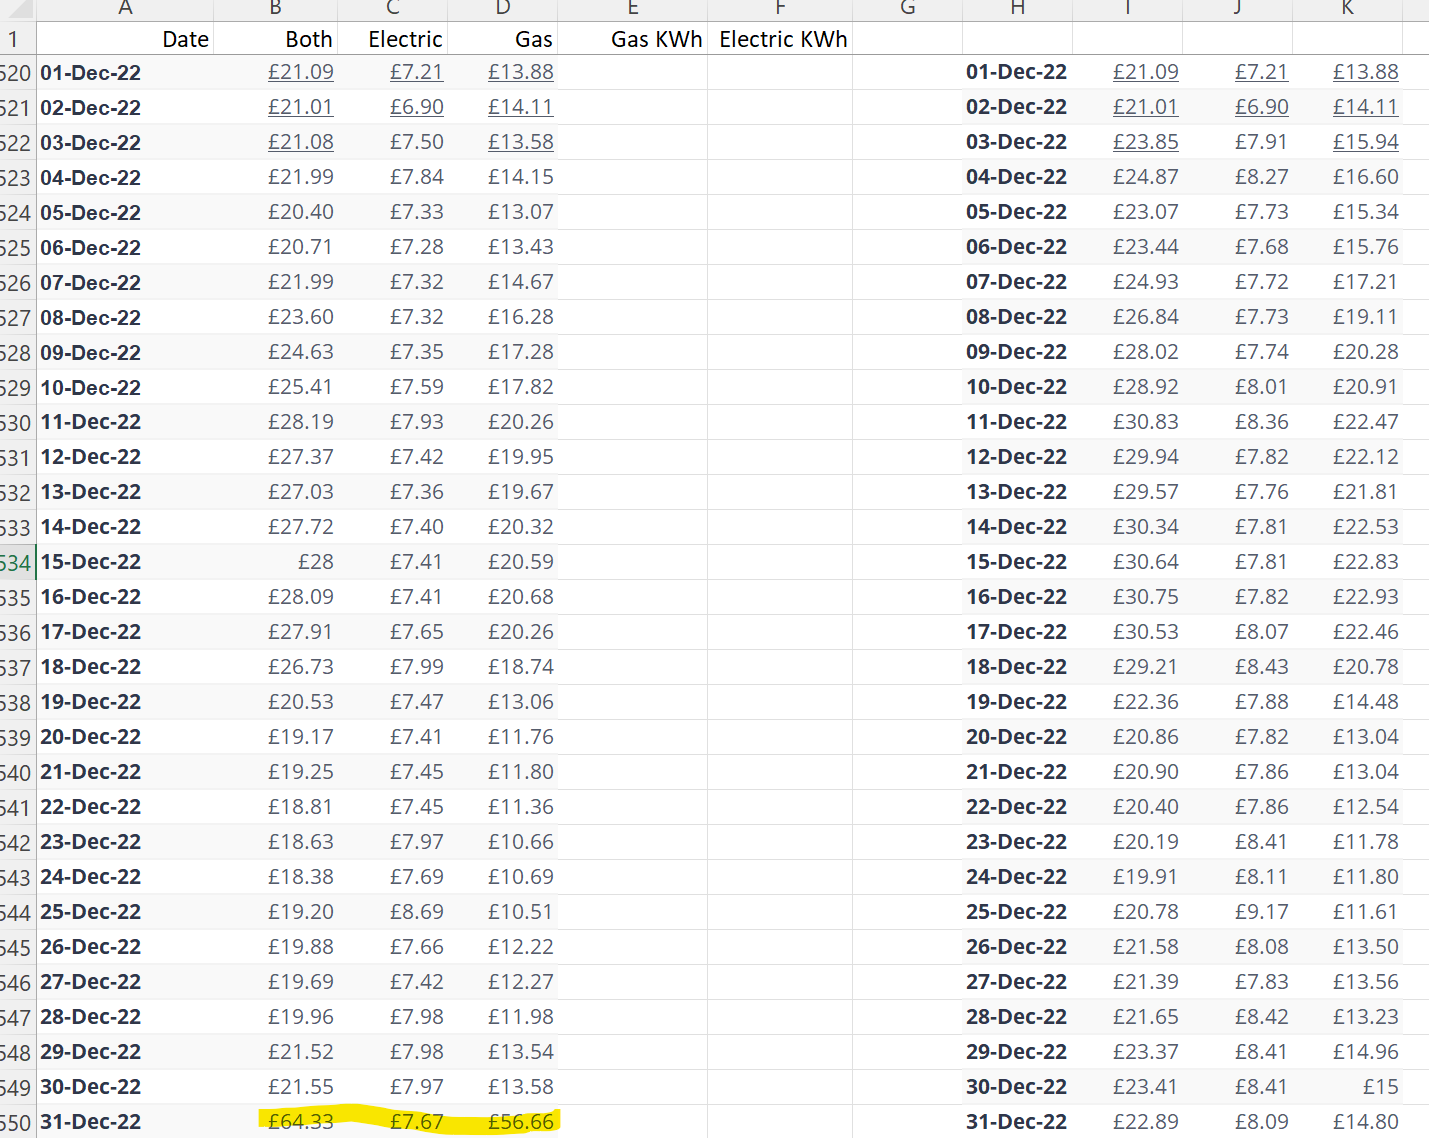
I’m in the habit of cut and pasting my usage cost date into an ongoing spreadsheet. The costs for one day in December were wildly out of kilter with the rest - impossibly so - and I was about to cut and paste the data from the website to ask Ovo what that was about. Yet I now find that all of the data for December - apart from the first two days - is different from what I captured from it two months ago: It has been changed.

The three columns on the left are the December data when I captured it (and 31/12 is obviously ridiculous - even if I’d accidentally captured the wrong month, it could never be right. The three columns on the right are what the website now shows.

Anyone got any insight into what this could be about? Decidedly dubious in my eyes...


Updated on 31/10/23 by Abby_OVO

Hi @timfg

1. Do you have smart meter?

2. What page on the OVO website did you extract the data from?

It does happen that figures are recalculated if estimates have had to be used (either with or without a smart meter) or if the Calorific Value of gas is updated for example. It is not particularly unusual to be raised on this forum. 

It is difficult to be more specific in an answer to questions like this. 

The quarterly change in the Energy Price cap on the evening of 31st Dec etc can often cause strange looking readings that net out OK. I always see that on the meter reading page for my account. I think that is what you saw at the end of December. So you may see it again at the end of March. The big change looks like a correction due to the change over perhaps. 

I don't think it is anything to worry about in your case looking at the figures. The overall change for the month is relatively small, perhaps look at the net effect over a longer period. 

You could try contacting the OVO Support Team and asking for the reason in your specific case, but you may end up spending an awful lot of time if you do this. Depends on how much you want to find out. It would likely take weeks or months for OVO to get back with any account specific responses and even then it may well not give you the detailed answer you may or may not be after. 

The changing readings are simply a feature of the OVO system. 

I don't work for OVO, i am just a customer like you. 


Yes @timfg , it’s the meter readings themselves which are key in charges. One of the regular posters has pointed out that on one of the cost pages you can see some figures underlined (usually actual readings) and others not (often estimated readings). 
Even then gas figures are calculated from other data from national grid, not published until after the event and so even with actual readings, these sometimes need a correction. 
Dec 31st was a problem date for many readings. With price changes the data storage centre was busy updating and lots of meter readings got delayed. Eventually corrected of course

Yep, a similar thing happens on every what was 6 month change and is now 3 month change on my account for example. I see something every time on my readings page

@timfg i am not sure if your actual bills have changed, but perhaps vote for this if you think it might be useful?


Interesting.  I have smart meters, updating every half an hour, which I assumed meant that these readings (and costs) were accurate - but, reading other similar concerns, it appears that’s far from the case.  I’m struggling to understand why that would be so: if my meter is recording my usage every half an hour, what better measure can there be of the energy I have used? The price I am charged for that energy is a known, even at the point of a price cap change, with an adjustment seeming appropriate if there is a delay in receiving a reading on that day, but should have minor effect.

I am not particularly concerned about the accuracy of what I am being billed, but publishing data at this level of granularity seems pointless when it is, in fact, subject to adjustment and significant correction. I did see a big blip at the March price cap change, which I have never questioned, but it now seems it’s probably a result of the same thing.  It appears the figures published for daily use are just a fairly blurry estimate of reality and the best they will ever be is a broad retrofit of the numbers, distributed according to some unpublished algorithm as a best guess that matches actual (and billed) usage.  It makes a mockery of all these shiny dashboards and datasets, which imply some degree of precision and transparency that simply isn’t there.  I would very much like a clear indication of the point when the data is as good as it is going to get (ie no further massaging to be done) so I could at least not waste time on it any further.

And, for the record, this is what my data capture for the last 18 months looks like.  Clearly, the March price cap change needs revisiting…

Personally I’d much prefer that Ovo made the raw data available for any selected period, published only when they could commit to its finality, rather than have to scrape it off the website month by month - a laborious process at best - only to find that the data isn’t even accurate.  The whole approach is something of a transparency sham and needs some rethinking.


The smart meters certainly capture the data @timfg but it’s often the communication back to the data hub which is not always made in the same timescale. When the readings do get through then what might have been an estimate on the suppliers system gets updated and therefore changed. 
There are a number of third party apps which can also track this and graph for you. 
 

Incidentally, the data for the national grid gas calorific value is also available 


Interesting.  I have smart meters, updating every half an hour, which I assumed meant that these readings (and costs) were accurate - but, reading other similar concerns, it appears that’s far from the case.  I’m struggling to understand why that would be so: if my meter is recording my usage every half an hour, what better measure can there be of the energy I have used? The price I am charged for that energy is a known, even at the point of a price cap change, with an adjustment seeming appropriate if there is a delay in receiving a reading on that day, but should have minor effect.

I am not particularly concerned about the accuracy of what I am being billed, but publishing data at this level of granularity seems pointless when it is, in fact, subject to adjustment and significant correction. I did see a big blip at the March price cap change, which I have never questioned, but it now seems it’s probably a result of the same thing.  It appears the figures published for daily use are just a fairly blurry estimate of reality and the best they will ever be is a broad retrofit of the numbers, distributed according to some unpublished algorithm as a best guess that matches actual (and billed) usage.  It makes a mockery of all these shiny dashboards and datasets, which imply some degree of precision and transparency that simply isn’t there.  I would very much like a clear indication of the point when the data is as good as it is going to get (ie no further massaging to be done) so I could at least not waste time on it any further.

And, for the record, this is what my data capture for the last 18 months looks like.  Clearly, the March price cap change needs revisiting…

Personally I’d much prefer that Ovo made the raw data available for any selected period, published only when they could commit to its finality, rather than have to scrape it off the website month by month - a laborious process at best - only to find that the data isn’t even accurate.  The whole approach is something of a transparency sham and needs some rethinking.

You may already know this. 

The 30min data is never added up to make a daily total on your bill.

The meter will transmit the information separately. 

This is what feeds your bill assuming you are on a regular tariff

https://account.ovoenergy.com/meter-readings/history/electricity

https://account.ovoenergy.com/meter-readings/history/gas


Ideally there will be a reading every day and they all say smart

Don't rely on anything on the usage page for billing purposes. 

Sometimes there can be issues pulling the data off a smart meter and you end up with some estimated readings that are then sometimes updated. It could be an issue with a local transmission aerial in your area for example or heavy network traffic at every price cap change.


… and, interestingly, the April price cap figures are unchanged.  So that spike at that point seems very odd and unlikely to be a good representation of my actual usage over those few days.

I also found the page that shows whether readings are estimated or accurate: mine are all ‘Smart’ right up to today at the moment - which suggests that none of this data-massaging has been driven by non-receipt of readings, but by some inadequacy of central process.  I really don’t get  why such big changes would be needed: my usage is accurate to the half-hour, the price I pay is known, the standing charge is known


Interesting.  I have smart meters, updating every half an hour, which I assumed meant that these readings (and costs) were accurate - but, reading other similar concerns, it appears that’s far from the case.  I’m struggling to understand why that would be so: if my meter is recording my usage every half an hour, what better measure can there be of the energy I have used? The price I am charged for that energy is a known, even at the point of a price cap change, with an adjustment seeming appropriate if there is a delay in receiving a reading on that day, but should have minor effect.

I am not particularly concerned about the accuracy of what I am being billed, but publishing data at this level of granularity seems pointless when it is, in fact, subject to adjustment and significant correction. I did see a big blip at the March price cap change, which I have never questioned, but it now seems it’s probably a result of the same thing.  It appears the figures published for daily use are just a fairly blurry estimate of reality and the best they will ever be is a broad retrofit of the numbers, distributed according to some unpublished algorithm as a best guess that matches actual (and billed) usage.  It makes a mockery of all these shiny dashboards and datasets, which imply some degree of precision and transparency that simply isn’t there.  I would very much like a clear indication of the point when the data is as good as it is going to get (ie no further massaging to be done) so I could at least not waste time on it any further.

And, for the record, this is what my data capture for the last 18 months looks like.  Clearly, the March price cap change needs revisiting…

Personally I’d much prefer that Ovo made the raw data available for any selected period, published only when they could commit to its finality, rather than have to scrape it off the website month by month - a laborious process at best - only to find that the data isn’t even accurate.  The whole approach is something of a transparency sham and needs some rethinking.

You may already know this. 

The 30min data is never added up to make a daily total on your bill.

The meter will transmit the information separately. 

This is what feeds your bill assuming you are on a regular tariff

I didn’t, actually. I would have guessed that the 30m data isn’t ‘added up’ to make up the bill and that it was based on a known reading at the billing point.  But I would also expect the daily usage figures, assuming that readings are being transmitted, to near-enough exactly align with the ultimate billing for someone like me on a tariff that is known.  The fact that such huge adjustments might be needed says to me that there is something very wrong with the timeliness and precision of what happens centrally in the publication of the data. Which, frankly, shouldn’t be published.


Up to you @timfg 

You can follow up with the OVO Support Team

https://help.ovoenergy.com/#contact_us_container

It is just customers sharing our knowledge on the forum.

Alternatively post an idea in idea section

https://forum.ovoenergy.com/ideas

We added one idea as a starter that you can expand on

But obviously feel free to add nee ideas you think are needed or would be useful. 

Feel free to post any further questions and i am sure one of the regular customers here will try and help. 


I’m not sure there’s much more help to be garnered! It’s been useful to update my understanding of the reliability of this data and I’m disappointed to find the precision of what’s published to be rather less than I feel should be possible.  But I think it’s probably an ‘is what it is’ thing.  If anything, it’s confirmed my historically-held suspicion that smart-meters are not the data-scientists’ wet dream that some hold them up to be 😁

Thanks for your input @Jeffus 


@timfg are you OK if we mark this thread completed?

You can of course pop back at any time to ask questions or help answering them. 


@Jeffus and @BPLightlog have as usual given sterling advice. I’d just add that you might consider storing the usage data rather than (or as well as) the displayed costs. Usage figures are based on meter readings, so they might change if ever there’s an estimate involved which subsequently gets corrected.

Many of us have personal spreadsheets, essential if you want to keep an eye on OVO’s shenanigans 😉. I just plug today’s readings into mine and let Excel do the rest. Until they change something again, it’s working smoothly. Gas, with its variable CVs, would be a bit more complicated. Just to brag a bit, here’s today’s page:
  

The left-hand panel takes its figures from the tracking worksheet; the right-hand one is a smart copy & paste from the Billing page. I don’t think I’ve ever got this far into a month with not even a penny’s difference, usually a rounding deviation somewhere. The 2p difference in the starting balance is historical and I’ll continue to ignore it.


It’s also worth remembering that the various pages of the account site are managed by different teams; I experienced recently a situation where readings, usage and billing were all missing a few days’ data, but different days in each case. Readings come first, then usage and billing comes last, especially at the end of a billing period when everything has to match before the statement can be issued. That’s why the costs shown on usage pages can’t be relied upon, as you’ve discovered. 


I think what most use the more granular data for is to compare. For example via the Bright app, I can see todays usage compared to the last few days or the last few Tuesdays .. without scraping data from anywhere


Also worth knowing the daily kWh totals on the Bright app are not worked out the same as the the daily total figure on OVO. 

On Bright it adds up the 30min data as it can't access the daily data from your meter under its license agreement. 

So for me for example my 30 min readings for gas are often not complete as my gas meter is a bit to far away from my electricity meter.

So i often see different daily data on OVO and Bright. 

There are lots of quirks with smart meter data and different apps you need to watch out for depending on your individual circumstances. Some of these correct over time, others don't refresh. 


For my own perspective, the relative differences for each day/week etc is what I want. If I want billing, I would look at my meter reads and OVO info


Also worth knowing the daily kWh totals on the Bright app are not worked out the same as the the daily total figure on OVO. 

On Bright it adds up the 30min data as it can't access the daily data from your meter under its license agreement. 

So for me for example my 30 min readings for gas are often not complete as my gas meter is a bit to far away from my electricity meter.

So i often see different daily data on OVO and Bright. 

There are lots of quirks with smart meter data and different apps you need to watch out for depending on your individual circumstances. Some of these correct over time, others don't refresh. 


For my own perspective, the relative differences for each day/week etc is what I want. If I want billing, I would look at me meter reads and OVO info

That is true. Good point. 

It is just important as we often direct customers to 3rd party apps to check their data, and the daily data is quite often different between OVO and other apps if there are issues.

The Bright app is unusable for me for gas as i can't compare daily or weekly differences. The daily and weekly kWh data is inaccurate on Bright for me, always has been.

I just use the daily total on OVO which is always fine. Daily readings get to the hub, 30min readings unfortunately don't always for me. 


Also worth knowing the daily kWh totals on the Bright app are not worked out the same as the the daily total figure on OVO. 

On Bright it adds up the 30min data as it can't access the daily data from your meter under its license agreement. 

So for me for example my 30 min readings for gas are often not complete as my gas meter is a bit to far away from my electricity meter.

So i often see different daily data on OVO and Bright. 

There are lots of quirks with smart meter data and different apps you need to watch out for depending on your individual circumstances. Some of these correct over time, others don't refresh. 


For my own perspective, the relative differences for each day/week etc is what I want. If I want billing, I would look at me meter reads and OVO info

That is true. Good point. 

The Bright app is unusable for me for gas as i can't compare daily or weekly differences

Because it doesn’t record? Like this?


@timfg are you OK if we mark this thread completed?

You can of course pop back at any time to ask questions or help answering them. 


Yes.  Completed as in ‘what a complete mess this whole equation is’!


Also worth knowing the daily kWh totals on the Bright app are not worked out the same as the the daily total figure on OVO. 

On Bright it adds up the 30min data as it can't access the daily data from your meter under its license agreement. 

So for me for example my 30 min readings for gas are often not complete as my gas meter is a bit to far away from my electricity meter.

So i often see different daily data on OVO and Bright. 

There are lots of quirks with smart meter data and different apps you need to watch out for depending on your individual circumstances. Some of these correct over time, others don't refresh. 


For my own perspective, the relative differences for each day/week etc is what I want. If I want billing, I would look at me meter reads and OVO info

That is true. Good point. 

The Bright app is unusable for me for gas as i can't compare daily or weekly differences

Because it doesn’t record? Like this?


If your gas meter is too far from your electricity meter then often the daily reading will get through by retrying

But the 30min readings will be missed and never re transmit.

Although i can see this graph a random selection of 30min readings is missing, usually in a chuck of a few hours. 

So i can't compare either 30min reading or hence daily or weekly on Bright for gas.

Some people often have an issue with electric 30min readings. 

Bright pointed out that the licence the 3rd party apps have is different to suppliers

They can't access the same data.

For me i am better looking at daily readings for gas on OVO and taking anything else with a bit of suspicion.

This flags all the days on loop when i have missing random 30min data


That’s interesting. If I look at Loop for one day with missing data I get 

but if I look at Bright for the same day I get 

I know that licenses differ from third parties to suppliers but this seems odd as presumably the data must be there. 
 

Actually thinking this through - I do have the Bright IHD so that may be filling in some gaps I guess


That’s interesting. If I look at Loop for one day with missing data I get 

but if I look at Bright for the same day I get 

I know that licenses differ from third parties to suppliers but this seems odd as presumably the data must be there

It depends how often each provider  retries requesting the data.

It does vary by provider. For me Loop is the worst, Bright a bit better but similar to OVO.

But for me all 3 never get all the 30min gas data consistently unfortunately on every day. 

The OVO daily reading hasn't been an issue luckily. That is fine for me.

I can reliably look at the 30min on many days just not all of them.

So take 13th Feb 

OVO daily 58.18 kWh

OVO 30min 44.21 kWh

Bright daily 43.77 kWh

We have seen this with some other customers, even for electricity in some cases.


My data from Hugo is the most reliable just not ‘in day’ available. 

Looking at the same day as the rest Hugo data shows as above and OVO as below


@timfg perhaps vote for this as an alternative to cut and paste of data


Incidentally, I just checked on the last few days of data from Bright and compared to the OVO data. It is exactly the same kWh readings for both fuels. As has been mentioned, I don’t use these for any billing but it’s interesting to note that they must both feed from the same source .. possibly how the data graphs on the usage page differs to billing


Reply