Solved

The solar pv inverter data includes a "Pload" column of non cumulative figures at 5 minute intervals. What are those figures & how can I get the total KWH consumed for the day please?


Userlevel 2
Badge

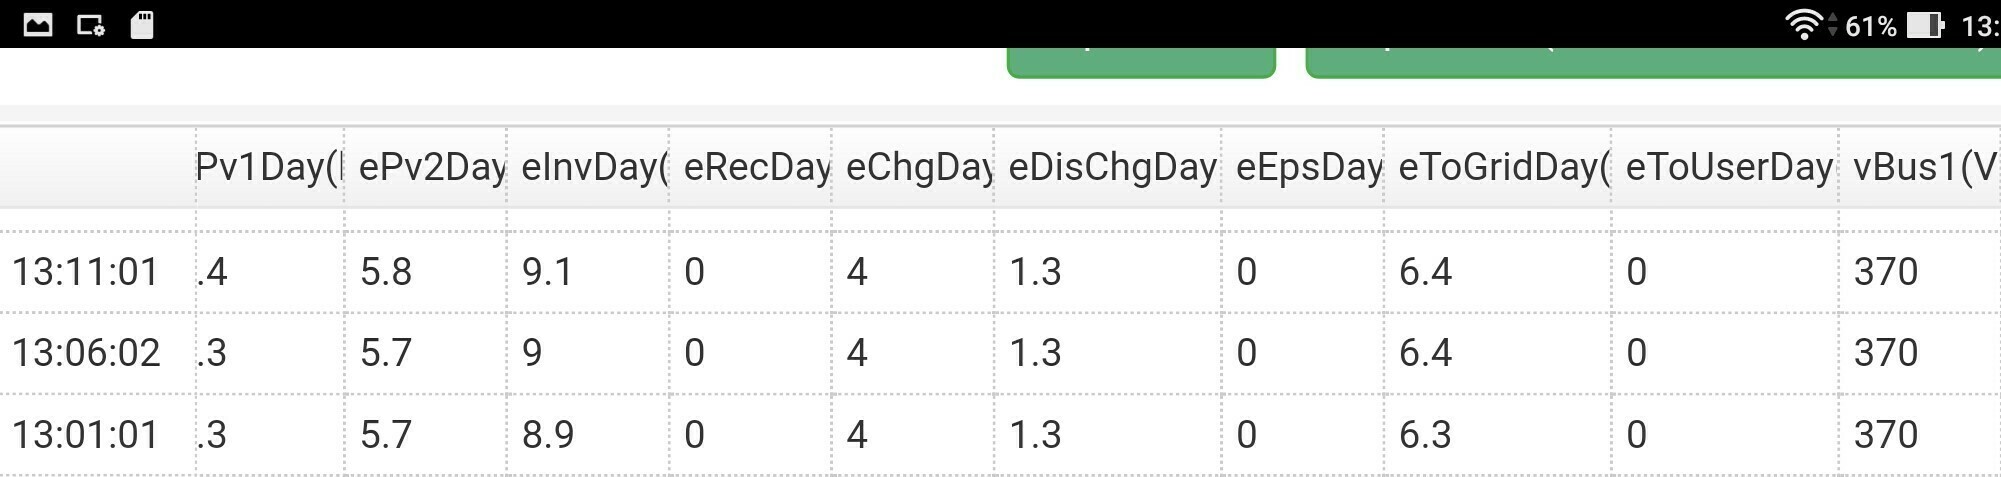
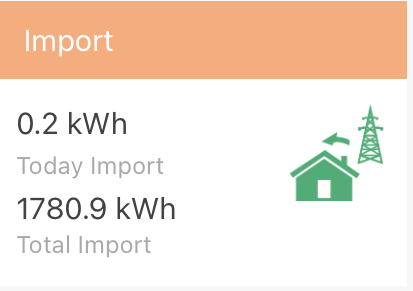
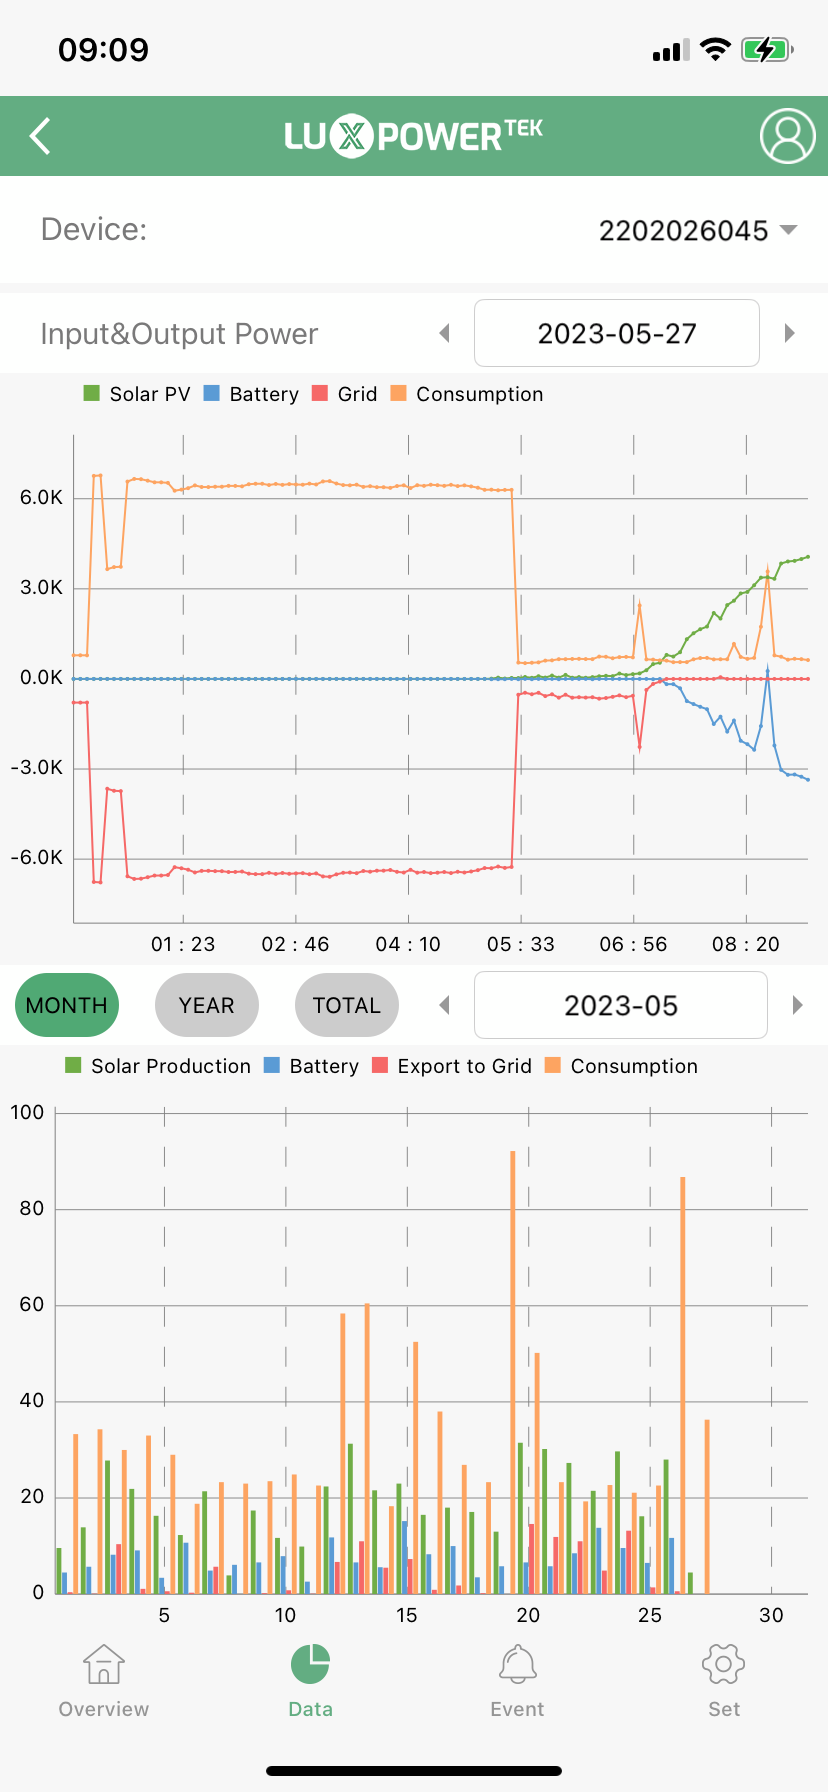
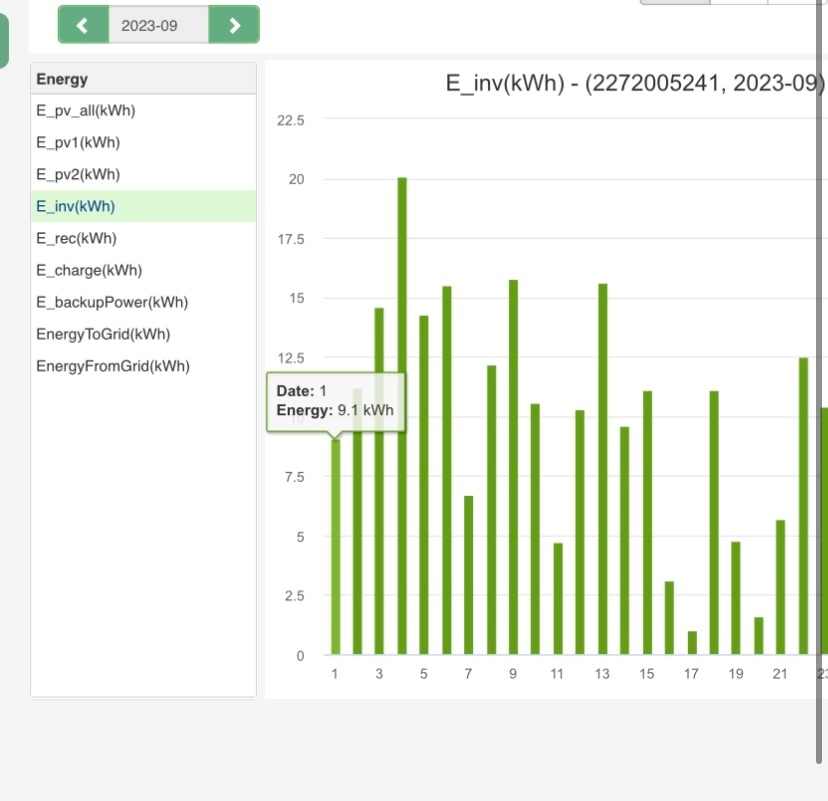
Most of the data I download from the on line monitor for my Luxpower Hybrid inverter makes sense. The data includes total figures for the day for solar production, power imported from and exported to the grid etc. but not a total self-consumption figure.


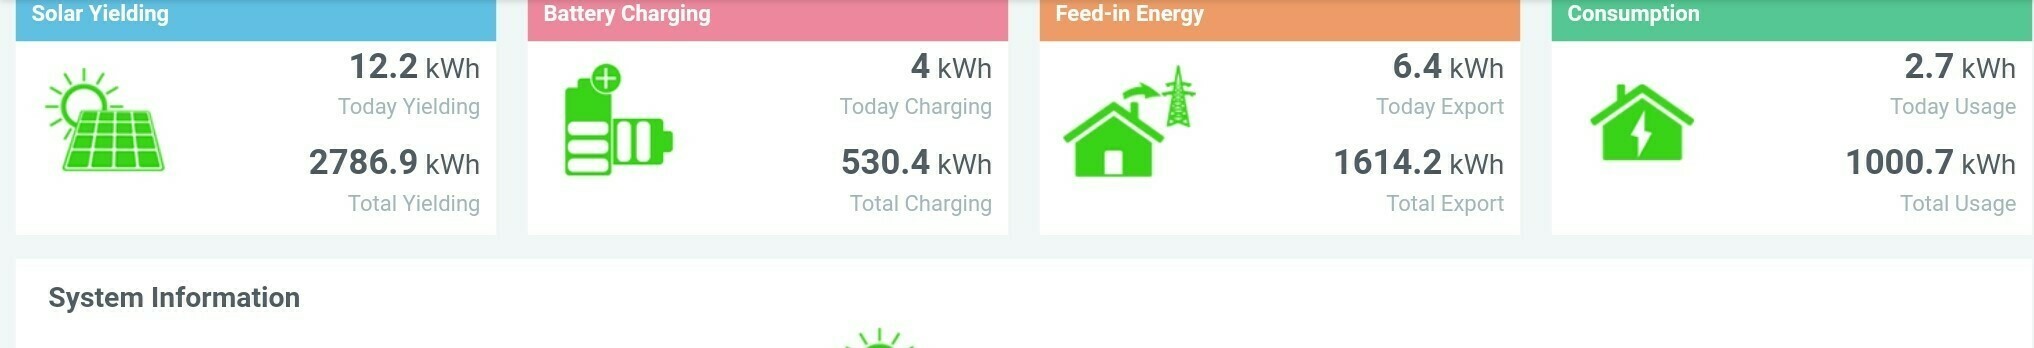
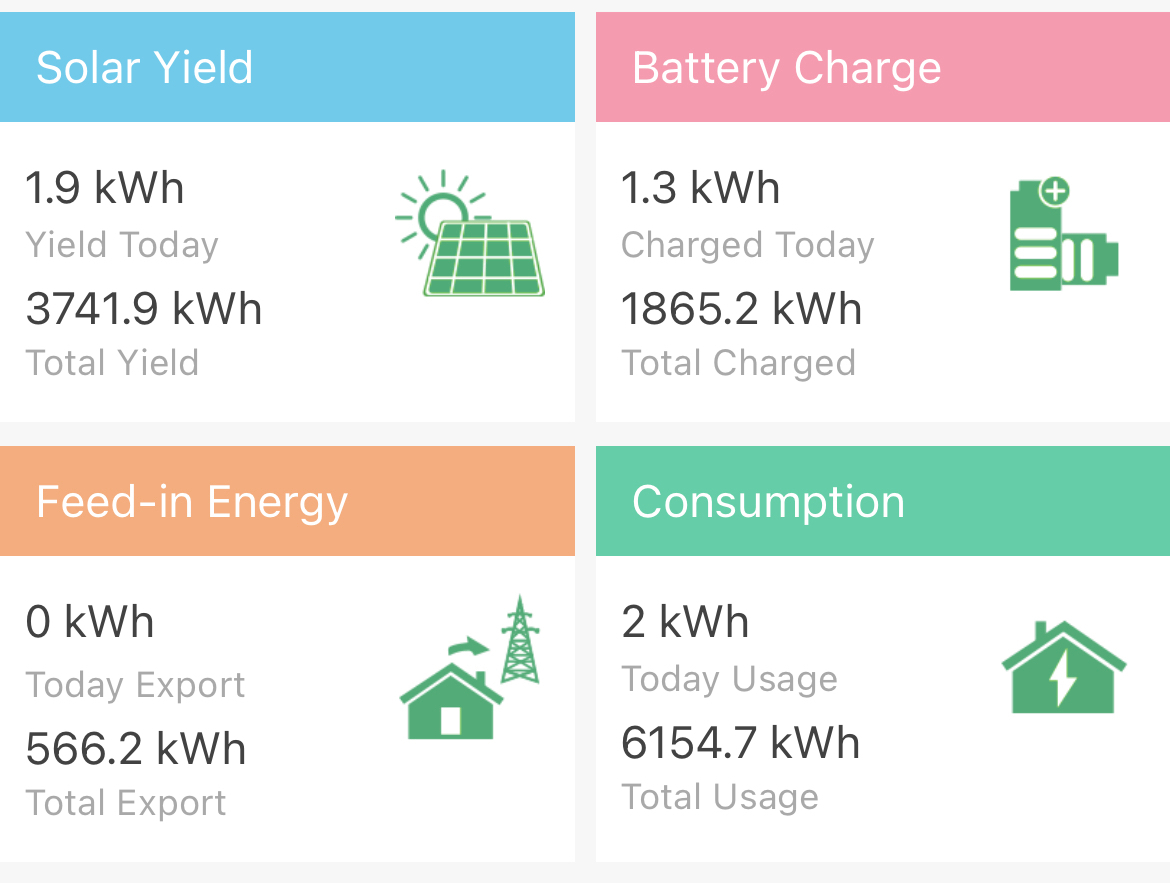
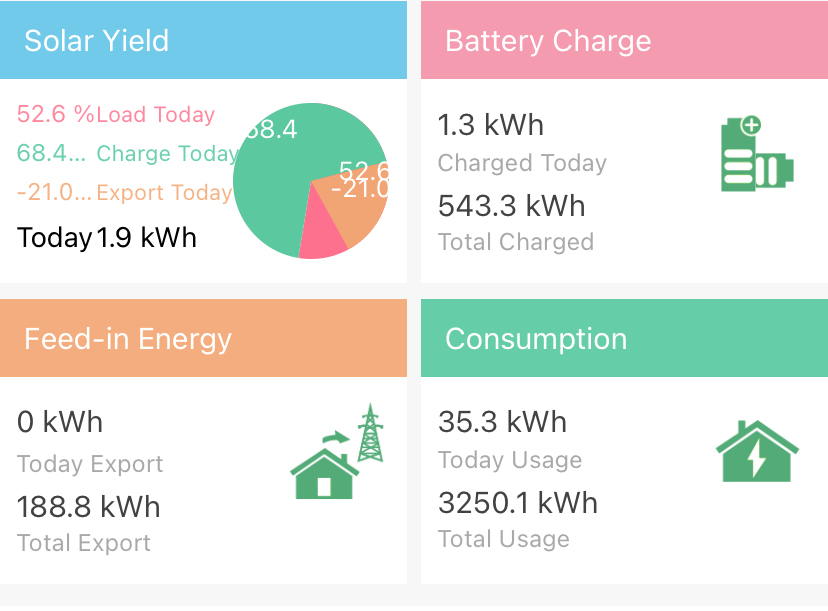
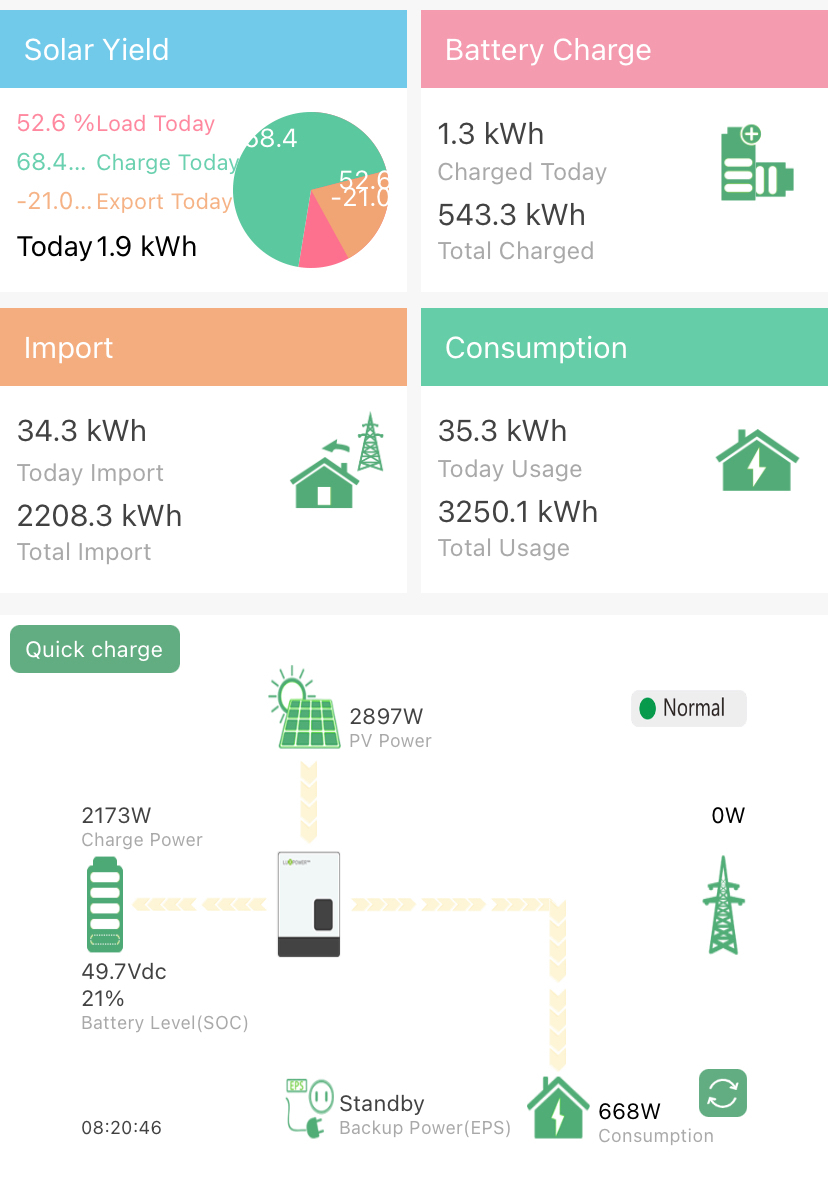
When I log onto the monitor there is a headline display of some daily totals. These DO include consumption for the day up to the point in time at which I am looking at the monitor. That’s fine as far as it goes but I don’t wish to stay up until 11.55pm every day to check how much I have used.


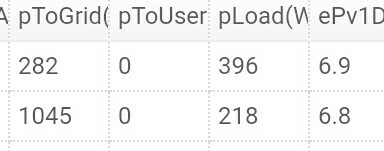
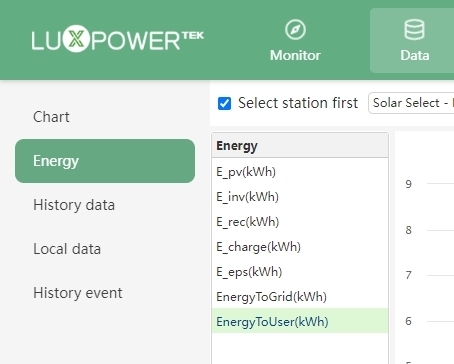
There is a “PLoad” column in the data. It shows non-cumulative figures at 5 minute intervals eg around 150 to 250 for background use like lights, fridge etc and about 2500 when something like the oven is on, so it looks like watts. However yesterday, for example, the total for that column was 95414. By comparison at 9.19 pm when I looked at the monitor the total consumption was 8.1 KWH. So what is PLoad showing? What units is it in? and how can I get a daily self-consumption figure please?

icon

Best answer by BPLightlog 16 October 2022, 21:43

View original

23 replies

Userlevel 7
Badge +1

Can you show us some photos please @maryjay ? And what make/model is your equipment?

Userlevel 2
Badge

It’s a Luxpowertek hybrid inverter LXP3-6K.

Screenshots


  online data, I can’t widen the column but W suggests watts


All the online columns giving totals in KWH at the end of the day


                            Monitor headlines showing some totals for the day so far. 

The 95414 total pLoad figure I referred to in the question was calculated by the spreadsheet from the data download. It is the total of the individual figures in the pLoad column up to 9. 19pm. I’ve just checked the other p column totals. Similarly, they are also very large compared with the comparative figures in the daily total data. 

So, do you have any idea what the relationship between 95414 and 8.1 KWH is and how I can work out the consumption for the day without staying up until 11.55pm, please?


Userlevel 7
Badge +1

The closest I’m getting for that is Plug Load. https://en.wikipedia.org/wiki/Plug_load

Userlevel 7
Badge +4

I'm going to guess that pload is power to load. I.e. the amount of electricity going to the house. Is there anything showing the units? W would be Watts. Wh would be Watt Hours.


If it's Watts then it's how much electricity is going to the house at a moment in time. If it's Watt Hours then it's the total amount of electricity used over a period of time.

Userlevel 7
Badge +5

@maryjay you do realise that there’s a history tab for the data so that you can revert to previous days to see power consumed?


I agree that it could be easier to follow but I’ve taken to loading the data into a spreadsheet to look more closely. 
You just need to make sure that you look at the import total from the grid presuming that you want to look at what you are paying for, otherwise there’s a ‘consumed’ total right in the app showing for each day. From your data shot, pLoad refers to the load power at that point in time - remember that LuxPower only logs the instantaneous info at 5 min intervals  


Userlevel 7
Badge +5

@maryjay just taken another look at the web portal (I mainly use the app) and there is some data with a bar chart to give you exactly what you are looking for

On the data tab, select Energy and then EnergyToUser(kWh) and you will see consumed power for each day in the month. You can also see monthly and yearly totals.

Your column total figure of 95414 is not of use as it is simply the total of the various instantaneous readings and not the sum of daily use.

Userlevel 2
Badge

Thank you all for finding time to reply.

M.isterW

re pLoad - yes it has to be the watts of electricity going to the house at the time. The figures tie up with the equipment in use and Bryan P’s answer explains why the daily total makes  no sense.

Bryan P

I missed the chart, hidden away at the bottom of the window. Oh dear. How stupid of me. I can stop worrying about the total of the pLoad column and just look at the chart for daily consumption and trust the individual pLoad figures to show me what the oven uses compared with the microwave etc.

I do download the history figures but the imports and exports to the grid according to the inverter are rather different from the corresponding figures according to the smart meter so I look at the smart meter to see how much I’m paying.

Thank you again for answering my questions.

.

Userlevel 7
Badge +5

Just another quick thing that isn’t obvious @maryjay is that on your dashboard header, if you click on the orange ‘Feed in Energy’ box, it changes to show ‘Import’ giving a running daily total of use. Click again and it changes back.


Just to jump on to this thread and understanding the data display in the app.

Am I right in thinking the orange consumption field is the total consumed by the property?

this total would include solar and battery consumption so deducting these from the consumption total would give what you actually pay for?

over usage is high compared to most other screenshots I've seen so understanding this is important.

We have an old dumb meter and the numbers don't seem to tally.


Userlevel 7
Badge +5

Hi @Dcann , don’t forget that the solar monitor is not as accurate as your meter. 
The orange consumption figures are total consumption for the property - regardless of where the energy comes from. You can see figures against the bars if you ‘pull’ the graph wider with your fingers on the app. 
The solar production (green) and battery (blue) levels are totals for each day but do not just subtract from the consumption level as grid export and different battery charge levels come into play. 
On another part of the chart 

You can see some daily totals. If you tap the Feed-In-Energy box (as I mention above in this thread), it becomes Import from Grid which is the figure you would pay for. If you want to look at earlier days, you can do this on the web version of the data feed from LuxPower

Userlevel 7
Badge +4

Yes, that's correct. However, this is measured using a CT clamp and they aren't 100% accurate.  So it's no surprise that the figures don't match your electricity meter.


How far off are they?

Thanks both, that's good news. It is as I assumed but good to get clarification.

BP I've added 2 further screenshots. So click feed in energy give totals consumption (at the moment) of 33 KW but the green consumption tab shows 35. Is one more accurate than the other. Obviously with the amount we consume, it can make a difference.

As it is a dumb meter the export doesn't help. I think the wheel turns backwards but not the numbers although without watch constantly on a good day!


my mani query has been answered though so thank you.

Mister W thanks. I'm not too sure I'll have to calculate them accurately and Take exact readings between a period. I think the biggest thing is to try and reduce usage.

*34.3 compared to 35.3* total consumption 

Userlevel 7
Badge +4

That's pretty close for a CT clamp. Ours can be 10% out.

Userlevel 7
Badge +5

Thanks both, that's good news. It is as I assumed but good to get clarification.

BP I've added 2 further screenshots. So click feed in energy give totals consumption (at the moment) of 33 KW but the green consumption tab shows 35. Is one more accurate than the other. Obviously with the amount we consume, it can make a difference.


So the 33kW is what you are paying for (sounds high) compared to 35kW the property is using. Although the figures aren’t completely accurate, they are indicative. 
At that point then, your solar has provided around 2kW unless the monitoring is not connected correctly

Has the solar not provided 1000KW? Total import 2208 total usage 3250


Sorry, read that wrong, you meant 2KW today. Thanks 

30 odd KW is high by 9am! Correct.


usage was around 6KW per hour between 1 am and 5.30 am then drops considerably.

I'll need to check if there's a cannabis farm tapping off us 🤦‍♂️


Userlevel 7
Badge +5

That looks like a heater or something significant at 6kw

Yes we have a swim spa/large hot tub which is the reason we got the panels in the first place. Consumption increased about 50% with it. Not too sure why it ramps up at that time though. It was used last night late on so explains some of it, cover off, , keeping the temp up but we get quite a few peaks around that time when it's not been used. Bit weird.

Userlevel 3
Badge

So I guess Pload is instantaneous power load.  If it adds up to 95414 then a rough and ready calc is 95414(W) x 5(minutes) / 60(minutes) = 7951 Wh or ~ 8kWh over the day.  That checks with your metered consumption to the likely accuracy of the calculation. NB using the (95414 * 5) = calculating each individual (Pload * 5 min) and then adding those up for the day.

Badge

Hi.  
I am trying to see the ‘Energy to User’ data so that I can download it together with the ‘Energy from Grid’ data and then can calculate the energy provided by the panels and inverter.   
Does anyone know why I can’t see the Energy to user data please?

thank you in advance for the help.  


Userlevel 7
Badge +5

Like I’ve said over here @Sunpower 

I think it’s just a question of terminology 

Reply