Solved

Why is my overnight usage shown on my smart meter In Home Display (IHD) so high?

  • 29 September 2017
  • 82 replies
  • 101394 views

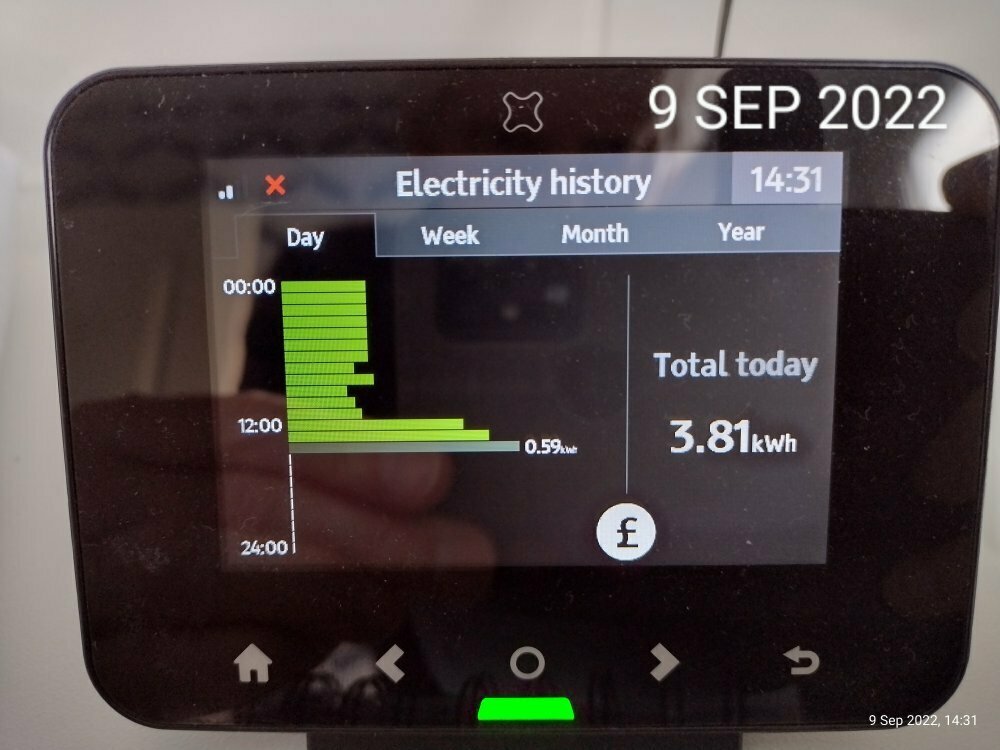
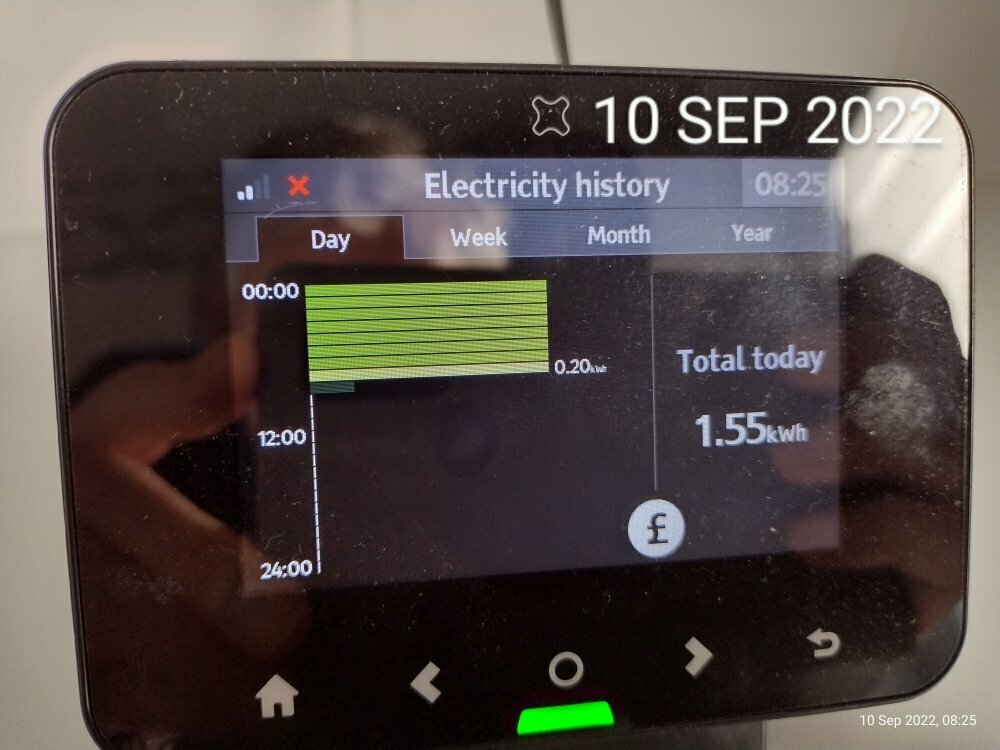
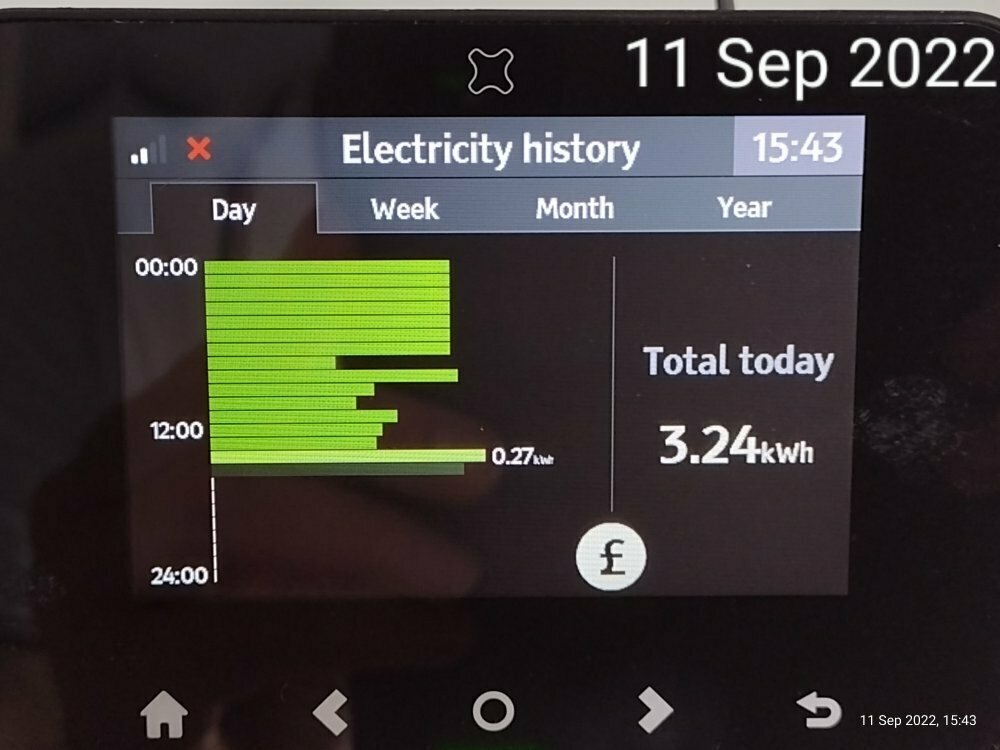
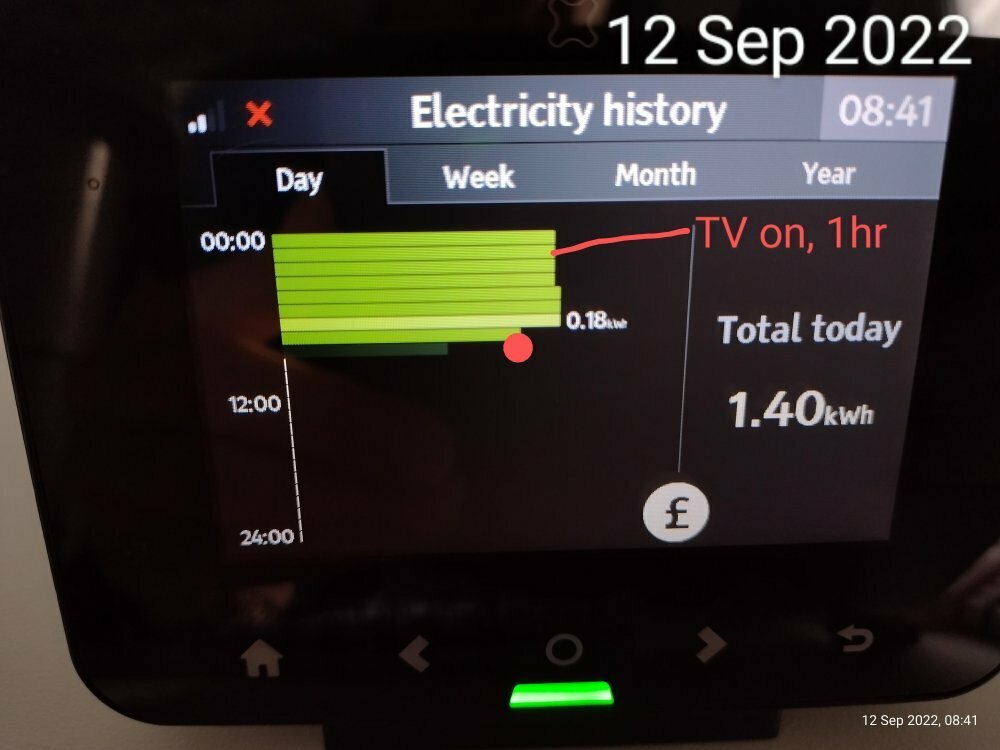
My smart meter was installed yesterday at 7.40 this morning my electric usage was 42p & gas usage was 28p. Even taking into account fridge/freezer, broadband, TV’s on standby overnight 42p electric seems high. The gas at 28p is a bigger mystery as no gas was used overnight (heating is off at the moment). Does some of the cost include a daily standing charge? Can anyone shed any light on this please?

icon

Best answer by Tim_OVO 4 October 2022, 10:01

View original

82 replies

Hi,

I’ve just moved into a house with smart meters for the first time and I’ve been monitoring the IHD for daily costs. What I can’t get my head around is what time the standing charge is added to it? Every morning the electric is on 80p, even when turning all the trips off at 11pm the night before, so I’m guessing the standing charge for electric is added first thing in the morning, even though the 80p doesn’t match my cost for standing charge even with the 5% vat. Gas is always on 10-15p so that’ll be my boiler cutting in for those 8/9 hours

My gas usage read 45p at 23:50 and just after 1am I read the previous days usage and it was at 98p so that makes no sense even with my 32p standing charge plus any vat?

Any help greatly appreciated!

Jon

Userlevel 7

Great question this one, @GeordieJon.


As you’ve spotted your daily standing charges will already show on your In-Home Display (IHD) when you check your usage costs in the morning. These are added around midnight every day. 


You mention that the figure shown is higher than your standing charge, as mentioned in this similar thread, this may be down to the energy used by appliances (such as your fridge/freezer) which are running overnight.


Have you been logging in to your online account or OVO app (download for Android or iOS) to check the usage data shown here too?

Hi Jess, thanks for the reply.

I understand the electric standing charge must go on at midnight but sometimes when I wake up at 8/9am my gas is only on 15p, which is lower than what my standing charge is at 32p

as I said before it was every so slowly creeping up throughout the day and nearly at midnight my gas showed 45p, so I expected the standing charge of 32p to be added in a few minutes. I waited until it reset after 12oclock and then went on the previous days usage and it said 98p so that doesn’t make sense either 

The meter readings are correct and my bill in the app so far looks to correspond with those readings, but the IHD seems to be adding and subtracting prices on both gas and electric whenever it feels like it. 


Userlevel 7

This is strange, @GeordieJon.


I’m wondering whether your gas daily standing charges are being shown under the electricity charges. This has been spotted by other forum users on the thread below.


Always worth viewing the daily usage costs on the device as more of a guide than your exact billed amount, Any inconsistencies here won’t impact how your charges are calculated on our billing platform so we’d recommend checking your balance and ‘current billing period’ figures on your online account or OVO app (download for Android or iOS) for a more accurate view.


Sorry for any confusion - Hope this helps.

My smart meter was installed last month (EDF)   this morning and every morning  my electric usage is 80p & gas usage doesn’t work as yet, Even taking into account fridge/freezer, broadband, TV’s on standby overnight 80p electric is very high Does some of the cost include a daily standing charge? Can anyone shed any light on this please is the standing charge added on through the night my electric every single night from 12 midnight till 8am is always 80p and most days between 8 am and 4 pm it’s rounder bout the same 80 give or take a few pence 

Userlevel 7
Badge +4

Your house will have a base load, which is the electricity used by appliances that don't get turned off. You can see it by changing the display of your IHD (the in home display connected to your smart meter). It will probably be a few hundred watts (w).

I suggest you have a look at how much you're using (in w) just before you go to bed when you've turned off the TV, lights etc. Check again first thing in the morning. If it's more than about 200w or 300w you might want to check for appliances that are using too much electricity.

Userlevel 7
Badge +2

My smart meter was installed last month (EDF)   this morning and every morning  my electric usage is 80p & gas usage doesn’t work as yet, Even taking into account fridge/freezer, broadband, TV’s on standby overnight 80p electric is very high Does some of the cost include a daily standing charge? Can anyone shed any light on this please is the standing charge added on through the night my electric every single night from 12 midnight till 8am is always 80p and most days between 8 am and 4 pm it’s rounder bout the same 80 give or take a few pence 


Hi @Ray Sis 

That is a very good question. 

Your In Home Display includes standing charge and VAT in the cost information

The costs on the Usage page on the OVO website and app don't include the standing charge or VAT. You would have to check with EDF exactly how their website and app worked. 

You do have to be careful when looking at energy cost information.

Let us know if you have any follow up questions. 

Can anyone tell me why at random days and times normally early hours of the morning my energy consumption electric almost quadrupled for 2 hours when nothing is actually being used and everyone is in bed? It keeps happening for 2 hours for 2 days about every 5th day? Tia

Userlevel 7
Badge +1

Hi @Alibongo ,

To be honest, that’s a very difficult question to answer. Only you know exactly what you’ve got around the house and we don’t have X-Ray vision so it’s really difficult for us to advise based on this information alone. I think @Jeffus and @M.isterW are pretty good at figuring this out though, so I’ll ask them to stop by.

Userlevel 7
Badge +2

Hi @Alibongo

I think i would start by downloading one of the regulated 3rd party apps and see what you see via them in terms of usage to see if it is the same

https://www.glowmarkt.com/

Let us know if it looks the same or different 

I have just checked my account and despite my economy seven being switched off for the summer, (heating), I notice my night readings increasing by exactly one unit every night, despite me not using any appliance on my economy seven since June this year.

I was wondering if anybody can clarify this for me before I contact OVO about this. If I am going to be charged for electricity that I’m not using I want to know. Many thanks in advance of any replies.

Userlevel 7
Badge +1

Hi @KenCristy ,

This sounds like normal and expected behaviour to me. It’s worth bearing in mind that Economy 7 makes it so that ALL your usage during the Night hours gets attributed to the Night rate, not just Economy 7 stuff like storage heaters.

It’s actually a good time to use appliances as well, because the Night rate will always be a lot cheaper than the Day rate.

Hope this helps.

Thanks, that’s clarified things for me. Thank you

Userlevel 7

I’d like to step in to say that blastoise is correct for the most part, usually everything in an economy 7 set up is connected to a meter that has an off peak and a peak register. So fridges, freezers, anything on standby, and in the winter, your heating, will make the off peak register clock over night. 


However there are examples where some appliances have their own circuit and they will only make the meter register clock if they are using electricity. If you have any doubts, a meter photo including the main fuse and all the area around it should help us work out the situation on the ground. 

I have one tv on stand by I have a small under counter fridge and freezer and yet every single morning 730am my monitor reads 80p 

Userlevel 7
Badge +2

What’s your standing charge @Ray Sis ? Are you on duel fuels ?

Hi,

Hope you can help.

I had SMART meters fitted in late 2020 and I’m trying to understand my overnight electricity consumption.

I’ve attached photos of the IHD for the last few nights.

I import all electricity used i.e. no solar panels or other generators.
I have one fridge/freezer in the kitchen and two freezers in the garage.  The garage freezers are N & ST-N rated however the temperature has not dipped below 20C recently so I don’t think either is operating out-of-spec (presently).
I have security lights on overnight: 20W lights on a timer (9pm to 5am) and 25W on a dusk to dawn sensor (typ. 7pm to 7am in Sept.). No steps are evident in the IHD graphs to reflect them switching off (?).
I have a number of other ‘permanent’ devices in use: Router, 3x cordless phones on charging stands, a number of small low consumption devices like clocks, 5v chargers etc.
There is no CH or hot water usage until 8am and none used on the days of the graphs.

What I don’t understand is:

  1. Why the usage appears to be perfectly constant (at ~200w) from midnight to approx. 8am each day (the fridge/freezers are the only significant appliances operating and I’d expect them to create infrequent demands).
  2. Why the overnight usage exceeds usage of many of the hours after approx. 8am (I’d expect the fridge/freezers to be working harder during the day).

Any thoughts would be appreciated.

Steve

Userlevel 7
Badge +2

This is @nealmurphy ‘s kind of thing !

Not sure how useful this will be to you but this shows my fridge freezer over a single day last November when it was the only thing on other than a single low watt light during the evening, plus router etc like you have.

For comparison, what does your daily usage graph look like for the days you’ve shown? That should be half hour data.


Hi Julimc,

That’s a very detailed graph, which clearly isn’t from the IHD.   You have me thinking now….is that level of detail available on my Ovo account?...I need to go look …...

Userlevel 7
Badge +1

Hello!

Please note that this comment was posted using the Blastoise AutoPost Macro, the latest in Robo-Blastoise innovations from BlastoiseLabs. I am a cog that is part of a bot called BlastAssist running under the supervision of my owner Blastoise186. Feedback is welcomed.

The level of detail provided by « User:juliamc » can be made available in MyOVO if you have Smart Meters. Please ensure that your Smart Meters are in « Mode:Half-Hourly Readings » and allow « Time:Days=5 » for your Smart Meters to update the Read Schedule configs.

Insert polite sign off here

Userlevel 7
Badge +2

Hi @Oakthorpe 

Agree that it would be useful to see the 30min graph as suggested by @juliamc 

The IHD’s hourly bars may be hiding the detail of your fluctuations, but I agree with you that it does look very uniform. However, I’ve no reason not to believe what your smart meter is registering as it’s very rare that the data is incorrect. There are also third party apps such as Bright or Hugo that can display 30minute usage and costs which you may like to compare.

I’m hoping to get my hands on a smart meter CAD at some point which would be capable of recording usage every 10 seconds to really delve into my usage profile. 

Morning all,

Many thanks for the inputs received.  I’ve learned something before you even look seriously at my data - that a detailed usage record exists on my OVO account !

As a result I’m a lot higher up the learning curve than yesterday. 

So below is a 30 min graph of usage together with the IHD graph of 11 Sep.  A notable difference especially in the lack of smoothness across the overnight period. Clearly the IHD does fail to reflect the detail despite seemingly being able to reflect it….unsure why!

Having three freezers (stupid I know - and will reduce that) will create spikes in usage as all three operate at the same time, similar ‘large dips’ as they all go quiet.

I think I’m broadly comfortable in what I see in the 30 min data as it was the constancy of the overnight usage in the IHD that was most odd to me.  The lower usage during the day (at times) equally doesn’t seem as pronounced in the 30 min data as it was on the IHD.

My conclusion is that the IHD is a bit of a simplification (which is okay) and invariably the cause of my concerns.  If you agree, and you’re not seeing an oddities, I’m quite happy to let my issue drop. 

Thank you again for your responsiveness and more importantly to juliamc for that very important snippet of info re. the data available to me online.  Thanks.


Nb. I was not on a 30 min data collection until I raised a query with OVO earlier this year (March), they then moved me from the default 28 day data collection.  In my opinion, having a default 28 day data collection seems a bit pointless given the capabilities of the SMART meter system.


Userlevel 7
Badge +2

That’s a pretty low baseload @Oakthorpe considering what you have running.

I must tell my children not to use the laptop / games console quite as much and see if I can get mine lower!

Userlevel 7
Badge +1

I can’t quite beat that sadly, but then again I am running crazy overpowered kit!

Well, I’m stunned….the reason I started looking at this was because I considered our daily electricity usage, around 8kW, to be high…..  typically 2,900kWh pa.  Clearly I can get it lower by getting rid of the N rated freezer in the garage which probably does struggle to perform to spec in the winter months (garage dips to ~5C).

Reply